- New Dashboard feature
- New Table-to-model feature
- More ready made statics for GRC
- Cloud Architecture Metamodel
- API Architecture Metamodel
- G-OWL Metamodel
- EDGY Metamodel
- Parameterized GenericQueries
- Cluster analysis in 3D visualization
- Model Gallery
- RepositoryExplorer – treeview
- New predefined reports
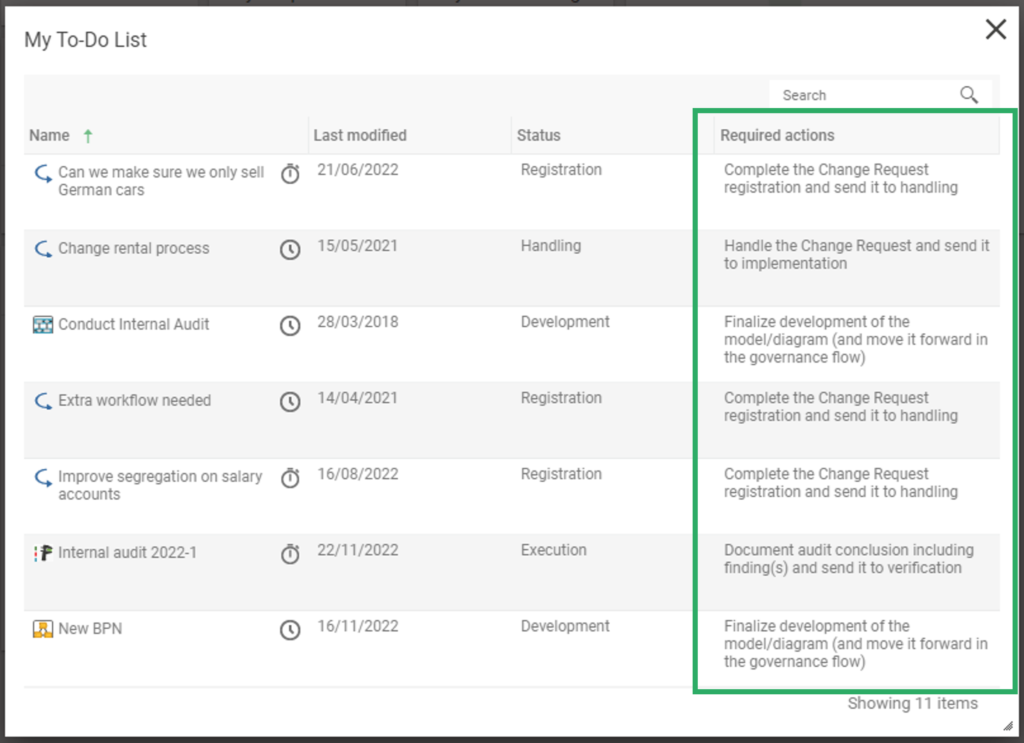
- Required actions on governance tasks
- Unattended installation
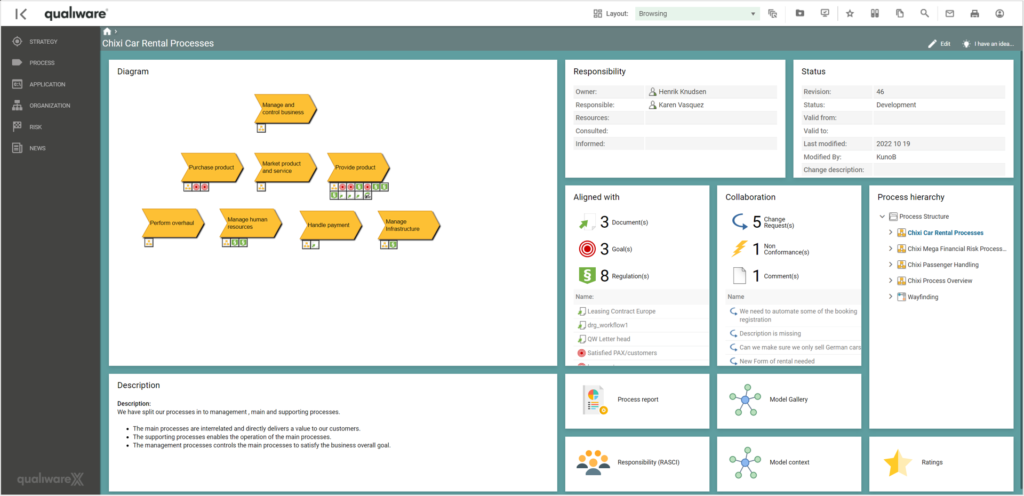
New Dashboard feature
- it is possible to set up multiple layouts for a diagram type, e.g. browsing view for the content user; and a analyzing and improving view for for the content owner
- the dashboards can be customized by the user
- the content is responsive, showing associated data either for the diagram as a whole or for the selected object
- a set of new tiles have been added to provide easy access to associated features, well known as well as cool new features
See more details about the new Dashboards on the feature page.
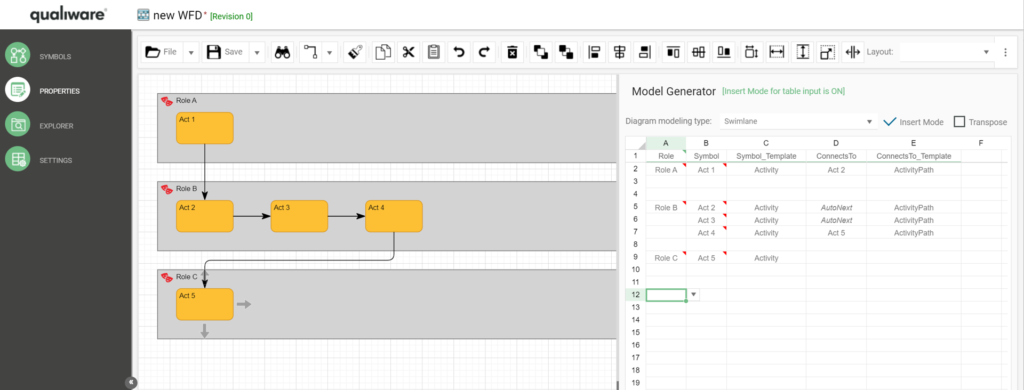
New Table-to-model feature
See more about the web-modeler here
More ready-made statics for GRC
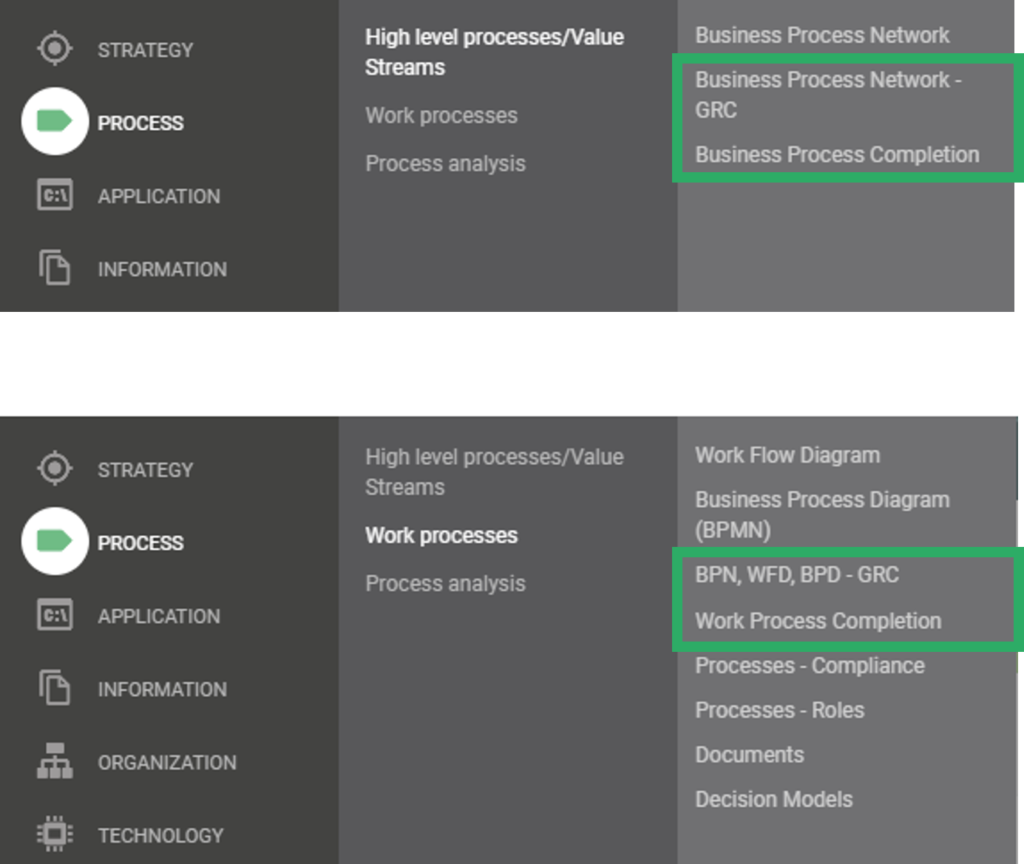
“Business Process Network – GRC” lists all the business process network with the essentional revison information (revision number, validation dates and governance state), along with information about the owner and responsible.
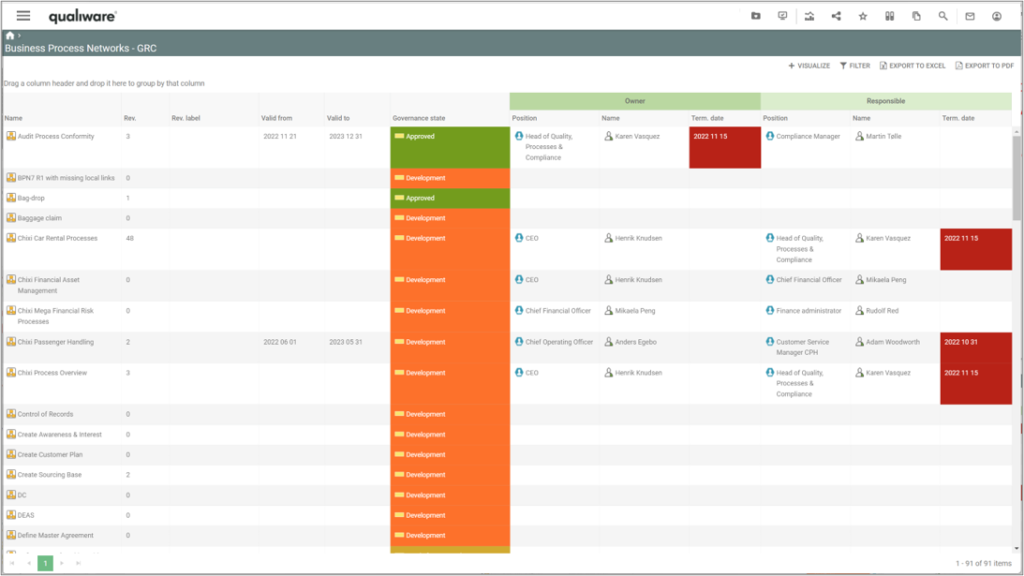
The list is configured, using “Postions” as process owner and responsible, and shows the person holding the position, as well as Termination Date (if available) of the person.
This list gives you get a comprehensive status of all the processes, and can used to monitors the status of the processes:
- when has is last been modified (are they updated recently)
- is the process still valid
- does the process have an assigned postion as process owner and process responsible
- does the position have a postion holder
- and is the person still employed, or will he/she leave the company soon?
If the termination date has passed the cell will be collered red.
“BPN, WFD, BPD – GRC” are structured the same way, as the one above, showing status of all process diagrams (Business Process Networks, Work Flow Diagrams and Business Process Networks) in the repository.
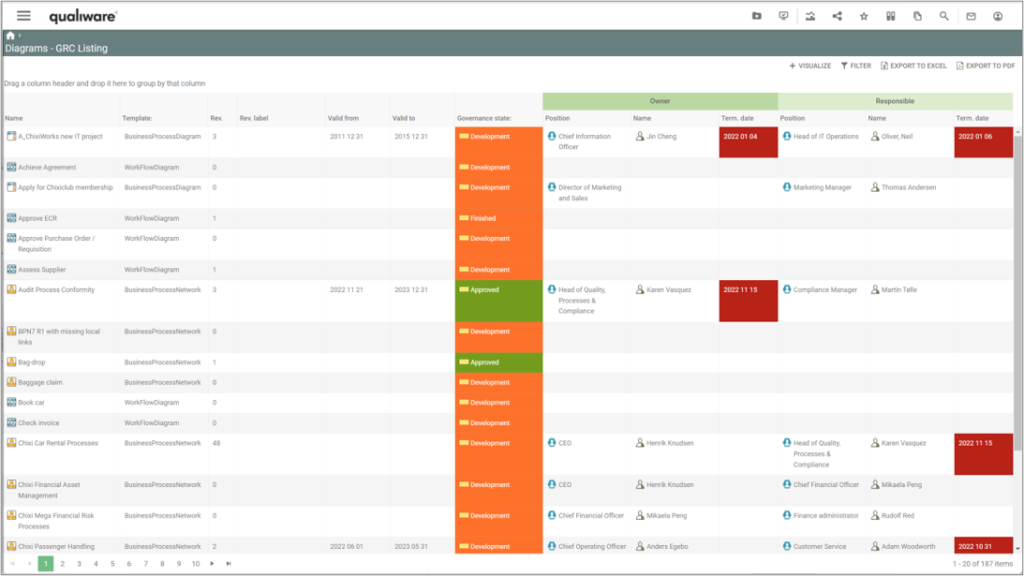
“Business Process Completion” lists all the Business Process Networks and their Business Process and calculates a compleness score for the diagram as well as each business process.
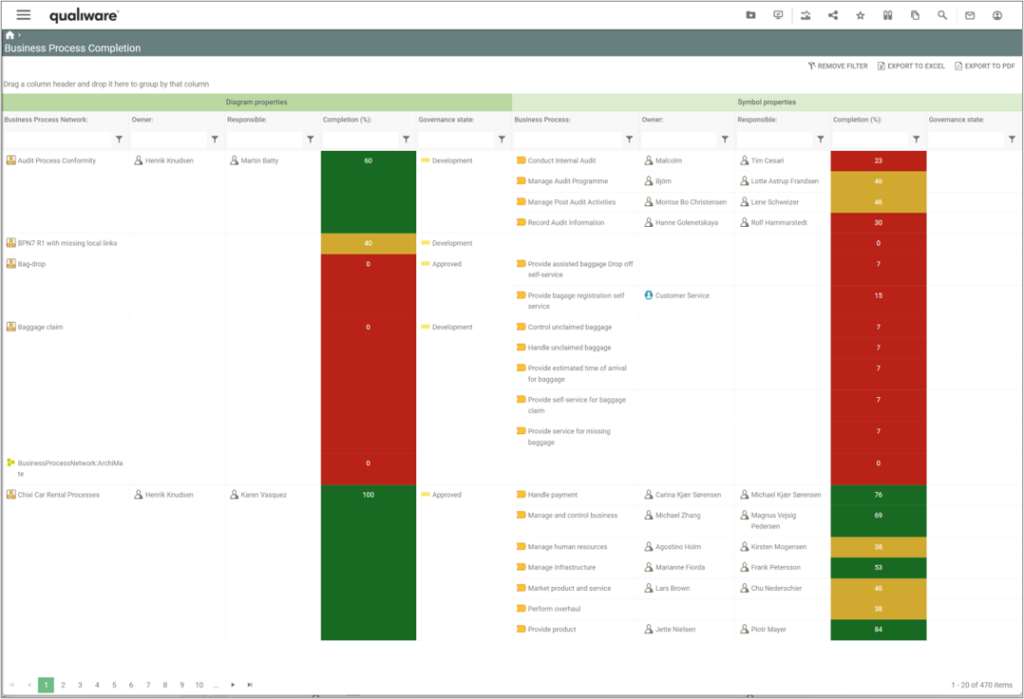
The compleness score of the diagram is a calculated based upon how many of the following fields have been filled out:
- Owner (OwnedBy),
- Responsible (HasResponsible),
- Description (Description),
- Valid from (RevisionValidFrom),
- Valid to (RevisionValidTo)
The compleness score of the business process is a calculated based upon how many of the following fields have been filled out:
- Owner (OwnedBy),
- Responsible (HasResponsible),
- ShortDescription (ShortDescription),
- Description (Description),
- Purpose (Purpose),
- Ressources (Employs),
- UsesInformation (UsesInformation),
- IT Support (HasITSupport),
- Deliver Capability (DeliverCapability),
- Compliance With (ComplianceWith),
- Associated Document (AssociatedDocument),
- Valid from (RevisionValidFrom),
- Valid to (RevisionValidTo)
It is possible to configure the scope of the completeness score, selecting the approprate fields in the underlying query.
“Work Process Completion” lists all WorkFlowDiagrams and BusinessProcessDiagrams and their Activities, and calculates their completeness score for the diagram and each of the activities.
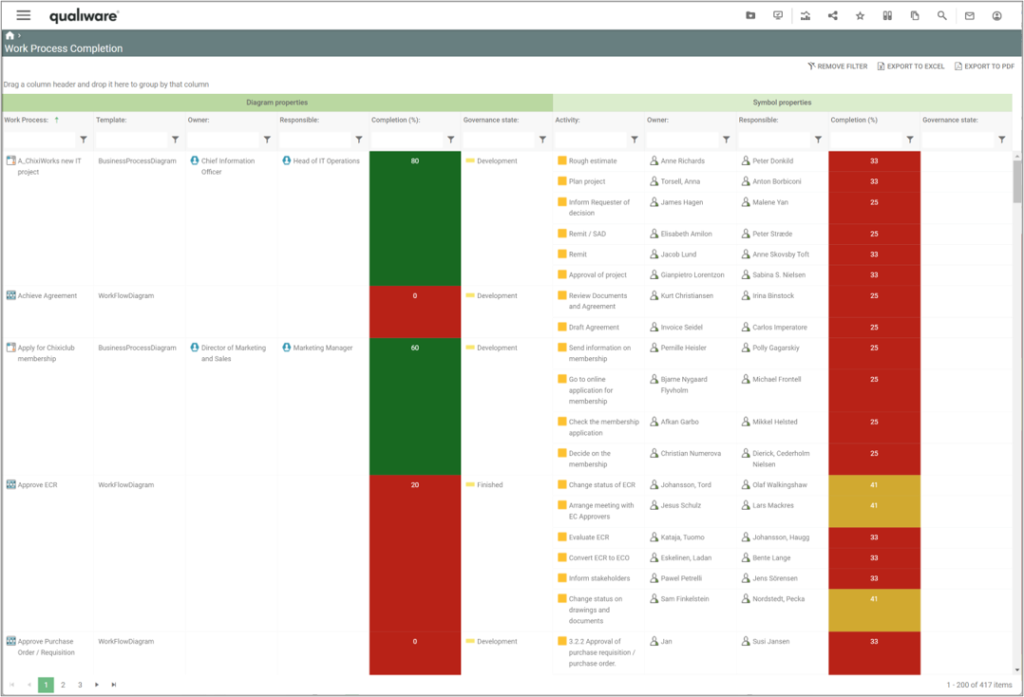
The calculation is similar to the one above for the Business Process Network. The only exception is that the activity completion is calculated based upon 12 fields, since “Purpose” is not part of an activity-object.
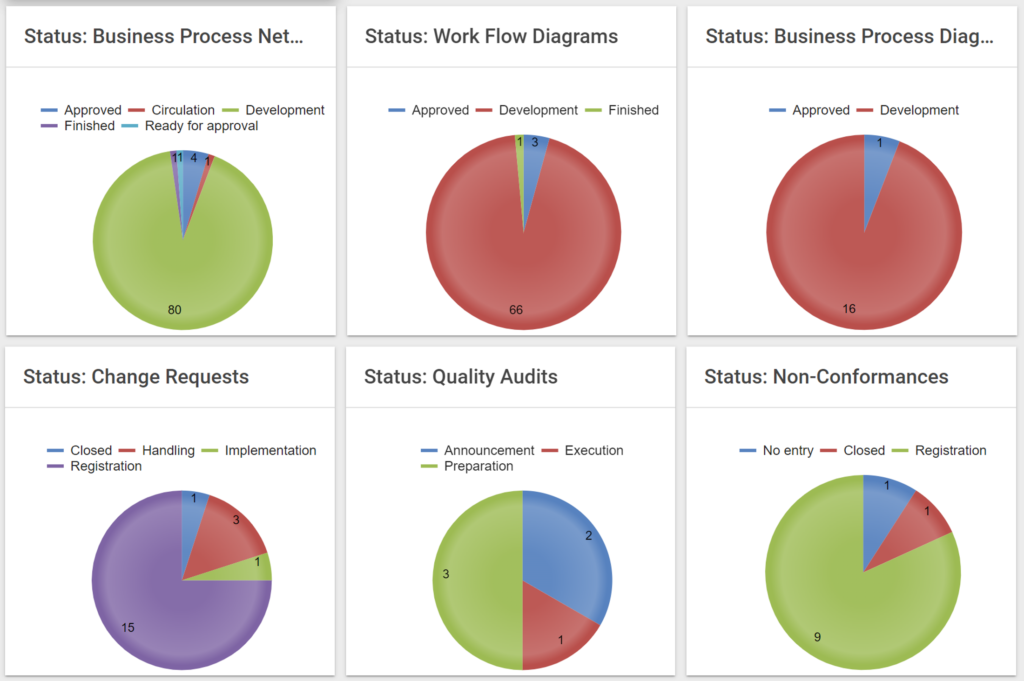
New charts on the Compliance Desktop
In addition to the new list a new set of statistics charts have been included in the Compliance Desktop, showing the distribution of the different types of process diagrams, audit, non-conformancies, and change requests according to their governance status.
Cloud Architecture Metamodel
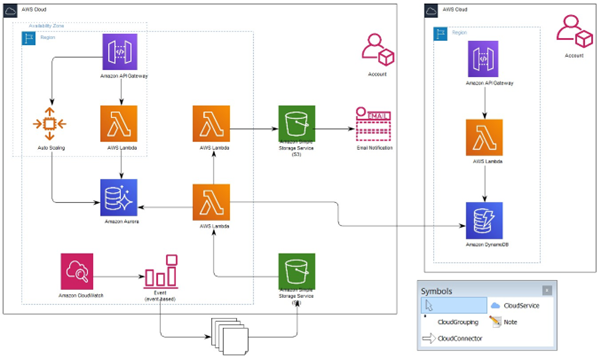
As an example, the sample diagram, in the picture below, is a “Cloud Architecture Diagram” qualified with “AWS” as provider.
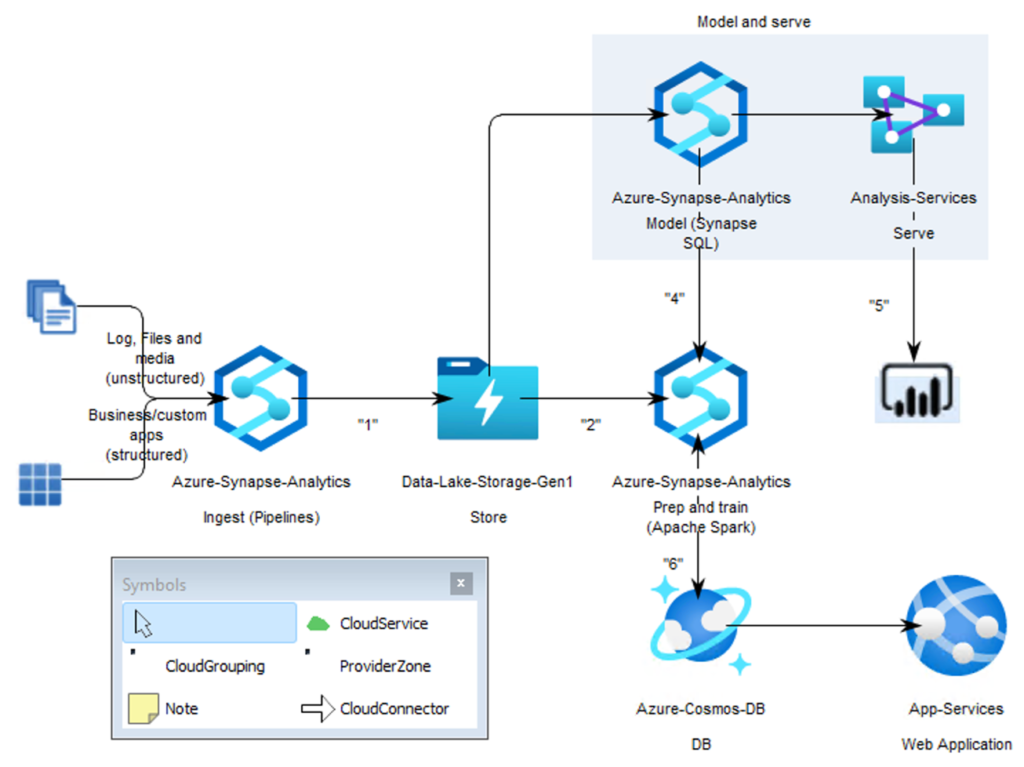
Another example in the picture below, is a “Cloud Architecture Diagram” qualified with “Azure” as provider.
Read more about the Cloud Architecture Metamodel here.
API Architecture Metamodel
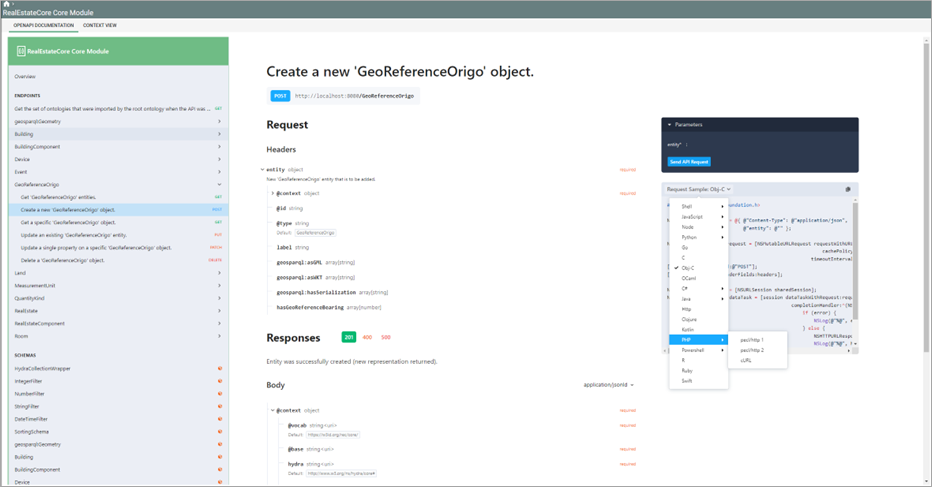
Architecting APIs in QualiWare can be automated using our new Web Ontology Diagrams, and the APIs themselves can be tested and interacted with directly from the QualiWare front-end by leveraging our adoption of the OpenAPI specification.
See more about the API Architecture metamodel, and how it can be used here.
G-OWL Metamodel
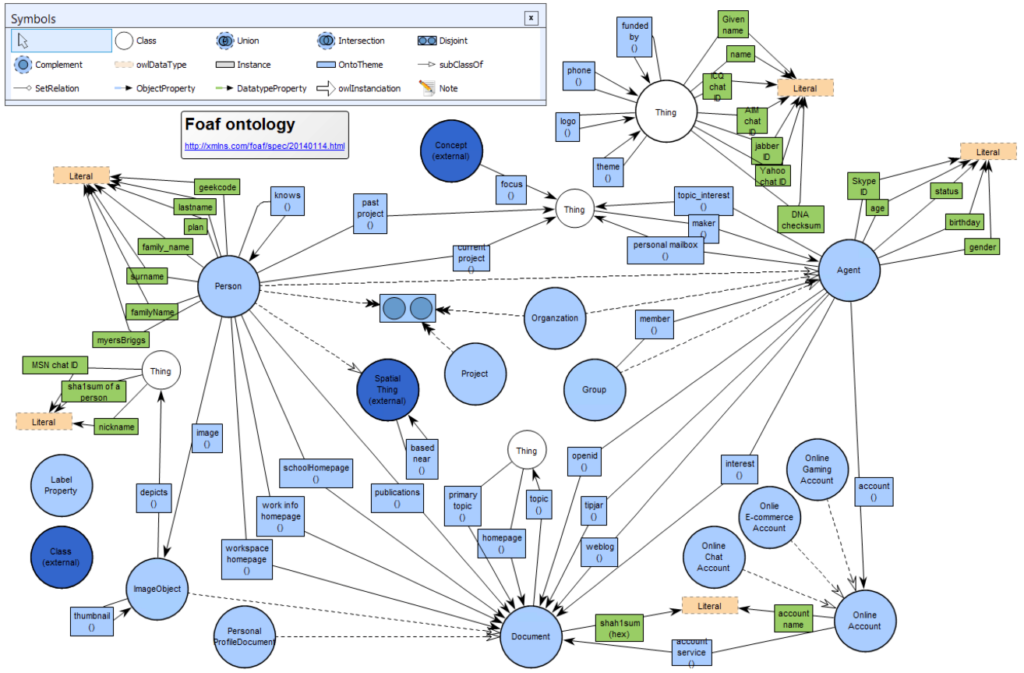
G-OWL is a Graphical Ontology Web Language, used to document ontologies.
An ontology is a representation of concepts and relationships among them within a domain of interest
Read more about ontologies and how QualiWare supports it here
EDGY Metamodel
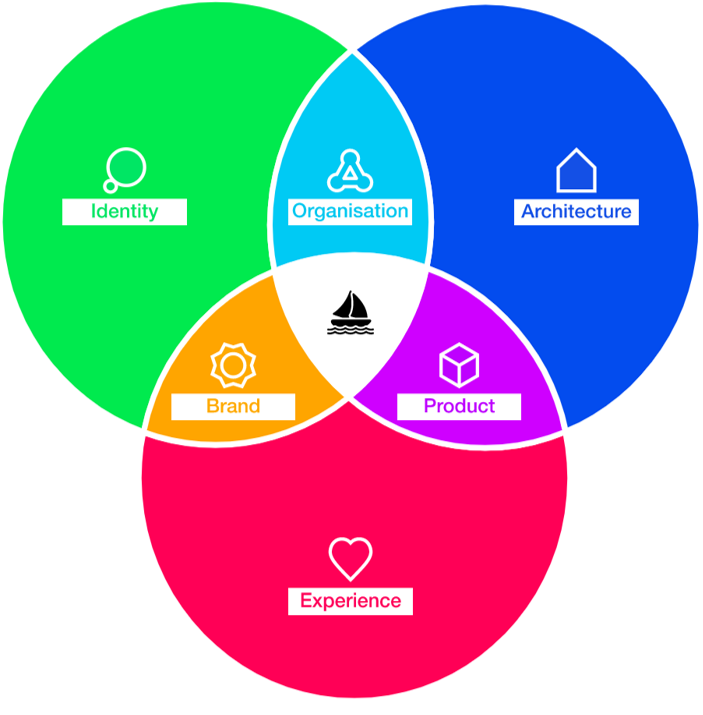
EDGY introduces a set of reusable Enterprise Elements as a simple but powerful graphical language everybody can understand and relate to. This is a tool that enables designers, architects and change makers to co-design a coherent enterprise by collaboratively exploring the most impactful perspectives and translating between them.
Facet elements
- Identity: describing the identifying elements that explain why the enterprise exists and what it seeks to achieve.
– Purpose: A reason why our enterprise exists and what our people pursue and believe in.
– Story: how we make sense of our enterprise and communicate to people what it does.
– Content: what we communicate to people, expressed in information and media. - Architecture: describing the way the enterprise works and how its different parts fit together to deliver.
– Capability: what we can do by orchestrating our people and assets.
– Process: a set of related activities our enterprise carries out.
– Asset: something we need and use to perform our mission. - Experience: describing the way the enterprise seeks to appear in and add value to people’s lives:
– Task: what people want to achieve and get done (with our help)..
– Journey: what people go through in their lives (and when interacting with us).
– Channel: the way people engage and interact with our enterprise.
Intersection elements
- Product: what we make, offer and deliver for people’s benefit.
- Brand: our name and what it stands for, our reputation and image.
- Organisation: a group of people working together to create intended outcomes.
Common base elements
- People: individuals or groups of people relevant for the enterprise.
- Outcome: a result, goal or change we achieve within our enterprise or its ecosystem.
- Structure: a object or entity that is relevant to our enterprise.
- Activity: what is being done or going on in our enterprise or its ecosystem
The EDGY-language has been incorporated in the QualiWare version 10.8 with a whole set of new diagram-templates:
- ActivityBoard:EDGY
- AssetBoard:EDGY
- BrandBoard:EDGY
- CapabilityBoard:EDGY
- ChannelBoard:EDGY
- ContentBoard:EDGY
- JourneyBoard:EDGY
- MilkyWayEnterpriseMap:EDGY
- OrganizationBoard:EDGY
- OutcomeBoard:EDGY
- PeopleBoard:EDGY
- ProcessBoard:EDGY
- ProductBoard:EDGY
- PurposeBoard:EDGY
- ServiceBlueprint:EDGY
- StoryBoard:EDGY
- StructureBoard:EDGY
- TaskBoard:EDGY
Parameterized GenericQueries
A example of how this is used, can be seen in the new charts on the compliance desktop.
Learn more about how to create parameterized generic queries.
Cluster analysis in 3D visualization
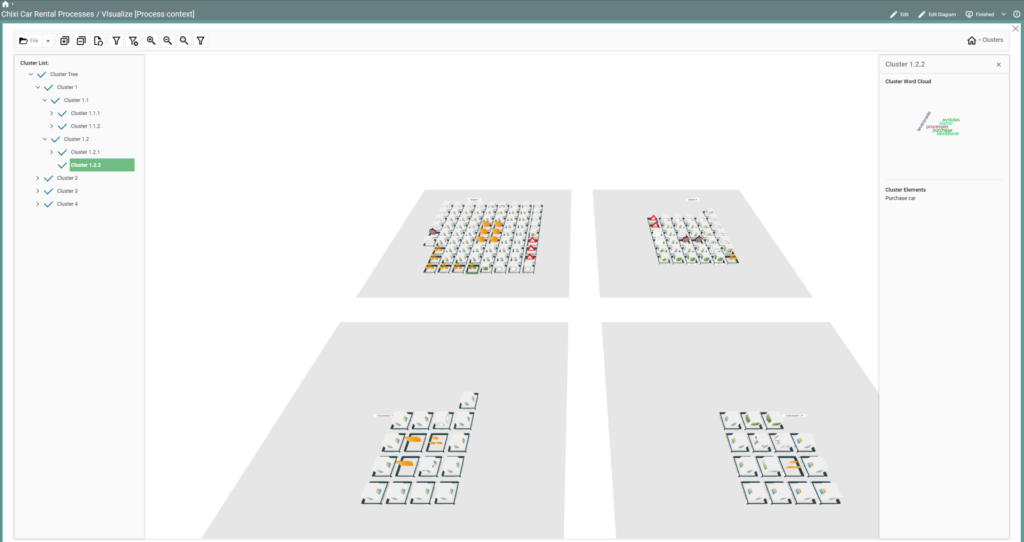
Once clusters have been created, users can select a specific cluster or sub-cluster to view the relevant grouping of objects. Users will also be provided with a word-cloud which is generated from various attributes of the objects in the cluster.
These clusters can be given a specific name or theme, and the selected objects can be “tagged” using an existing hashtag or by creating a new hashtag. Once the objects from a cluster have been tagged, users can easily navigate to the repository explorer to further interact with individual objects for further analysis. This provides an entirely new way of creating logical groupings of objects based on their concepts or relationships without needing to create custom folders. Identifying patterns and outliers in the repository is a valuable tool for conducting analysis, rationalisation, and transformation activities.
See more details about the new clustering feature here.
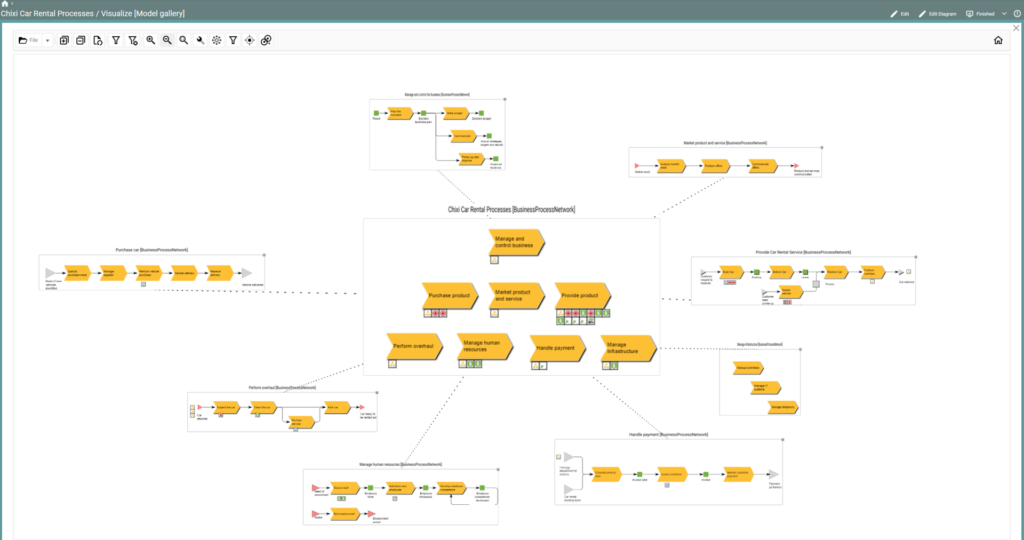
Model Gallery
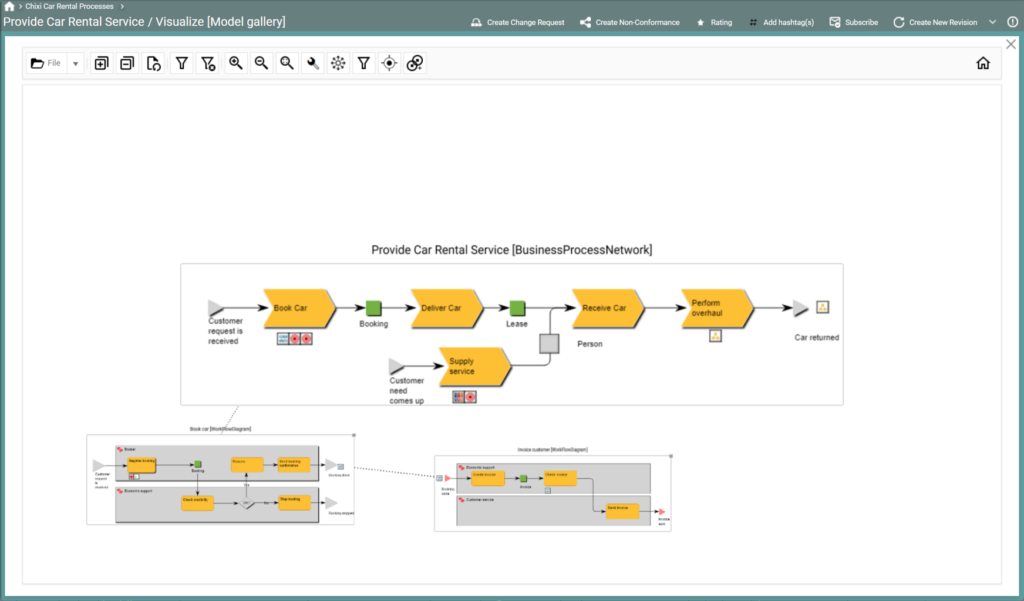
In the example below all diagrams on the “next level” is shown.
You can also explore the processes end-to-end via the connecting business event.
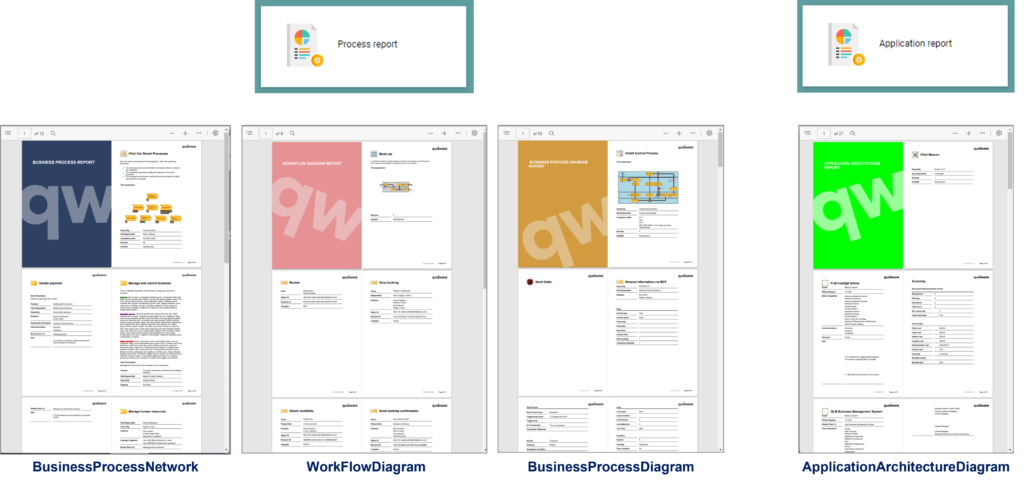
New pre-defined reports
The reports are available from the new dashboards for the following diagrams: BusinessProcessNetwork, WorkflowDiagram, BusinessProcessDiagram, ApplicationArchitectureDiagram.
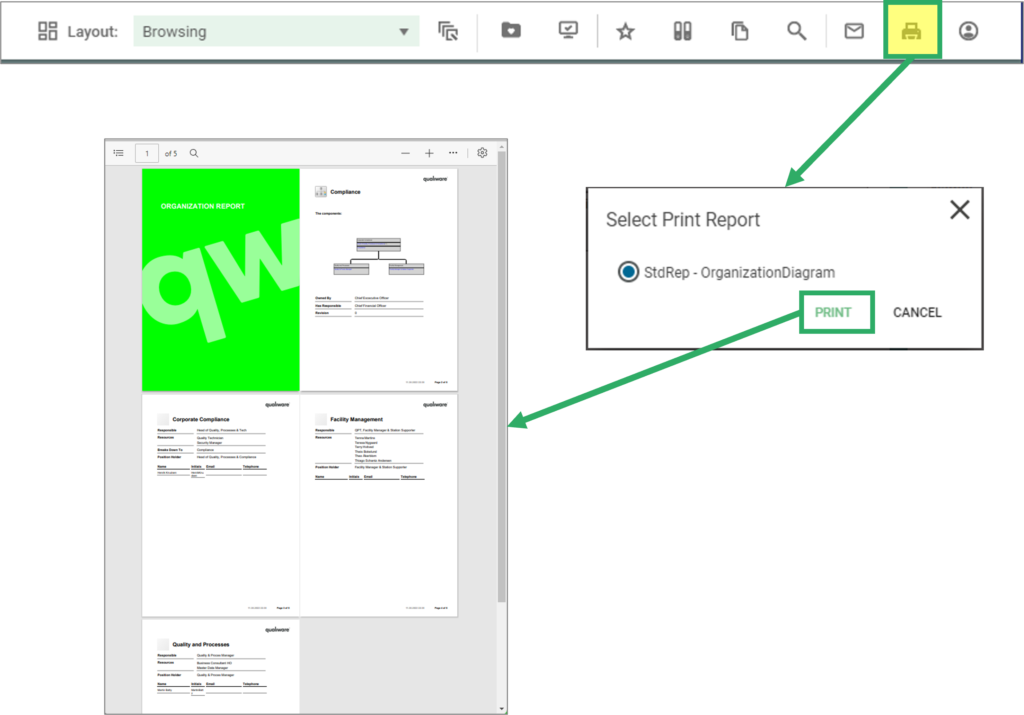
It is still possible to access available report(s) via the “Print” icon in the toolbar in the top right corner.
Here, the new standard report for the OrganizationDiagram can be found.
Unattended installation
The unattended installer is meant for IT departments with high volume of installations, automatic deployment environments and environments with a high focus on correct initial configuration. For single deployments, the tutorial based graphical installer is recommended.
The unattended installer will install QualiWare Execution Framework (QEF) and all available modules. After the installation configuration of AccessLog databases, Repository databases, licenses and directory services must be completed.
