Contents
Business Continuity Management
Sustainability
New desktops and tiles
New menu structure
New analysis reports
Context menu in Repository Explorer
Complete set of default web-forms for all templates
3D Visualization
Business Continuity Management
The COVID-19 pandemic has taught the modern businesses of the world the importance of establishing a business continuity management system as part of the traditional process-oriented business management system.
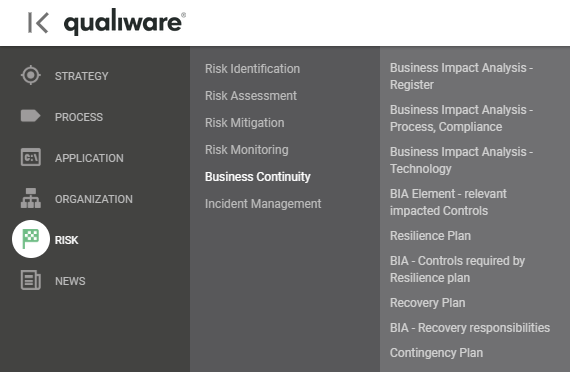
QualiWare 10.3 supports the development and implementation of a business continuity management system supporting ISO 22301. The new features are positioned under the Risk menu and contains four major deliverables:
- Business Impact Analysis
- Resilience Plan
- Recovery plan
- Contingency Plan
– as well as a series of relevant analysis report.
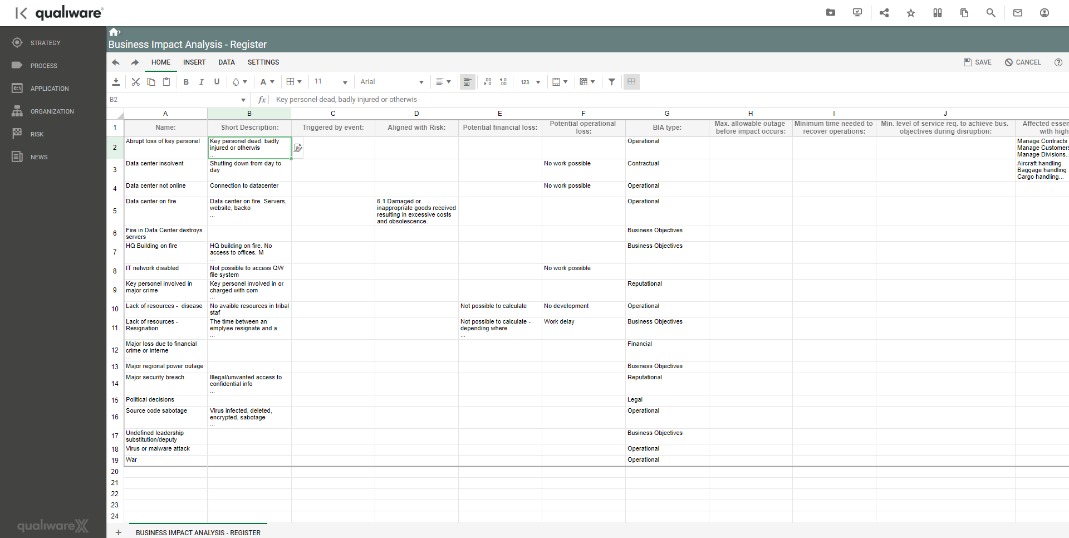
The Business Impact Analysis (BIA) handles the “What can go wrong”-view and is split into three focus areas supporting the strategic view, the process view and the technology view. Using the pre-configured dynamic spreadsheet all aspects of the BIA may be described.
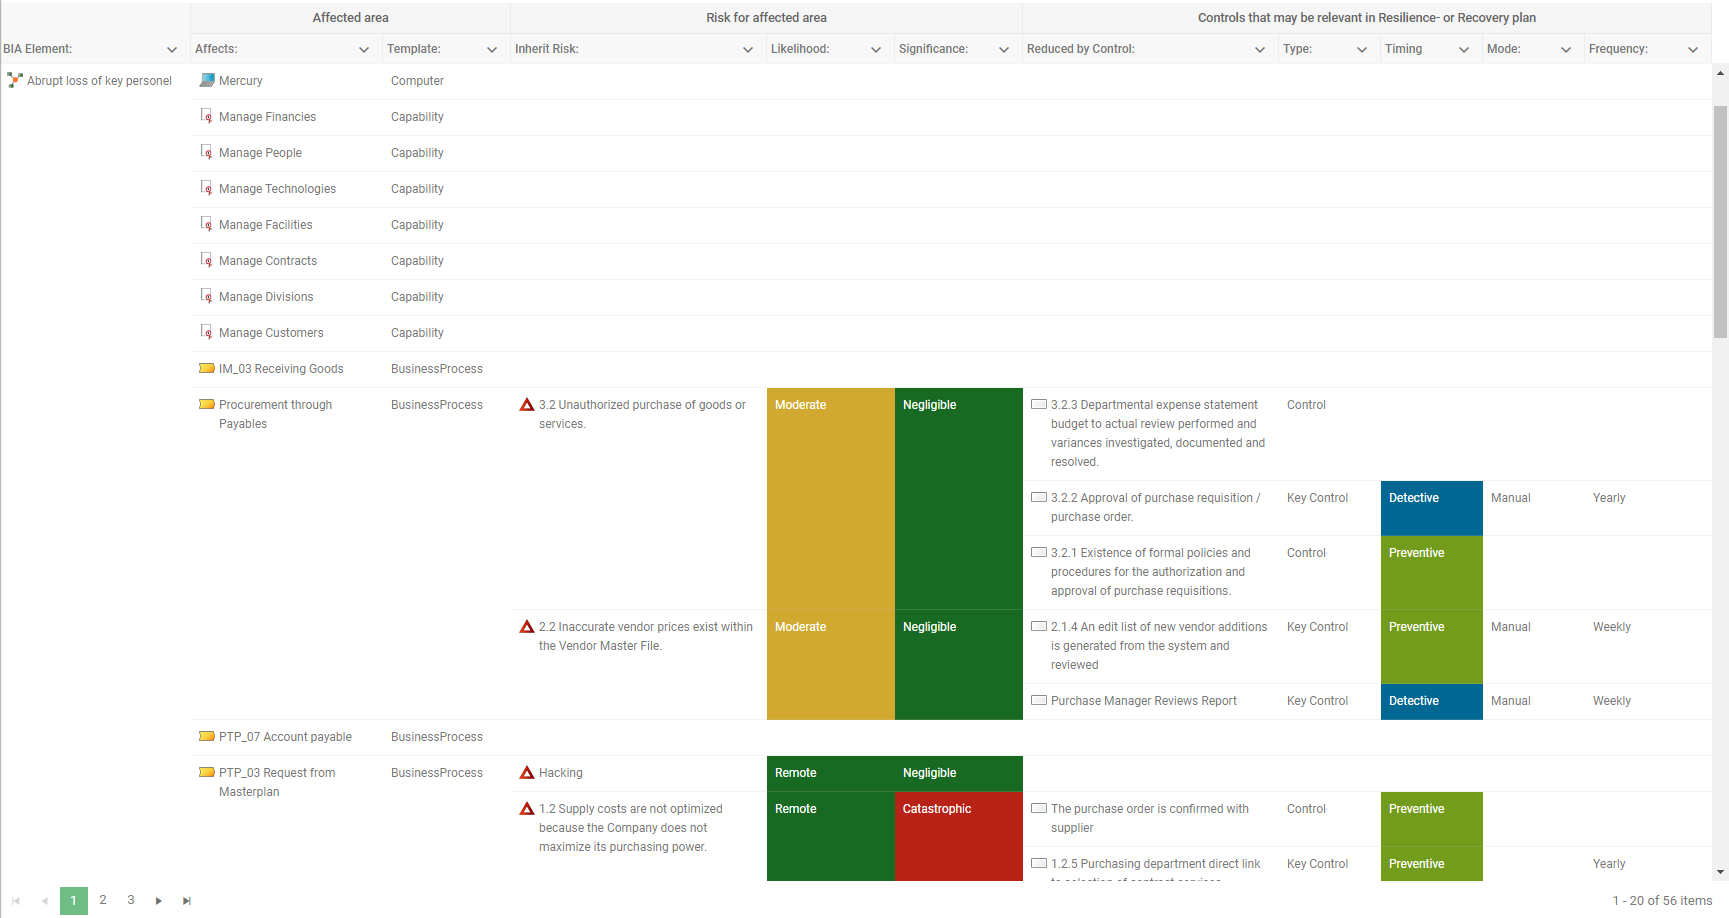
When the BIA analysis has defined the business-context impacted by the BIA elements QualiWare 10.3 can analyse the risks and controls already established in these business areas, and present these as an inspiration to developing the Resilience plan and the Recovery plan.
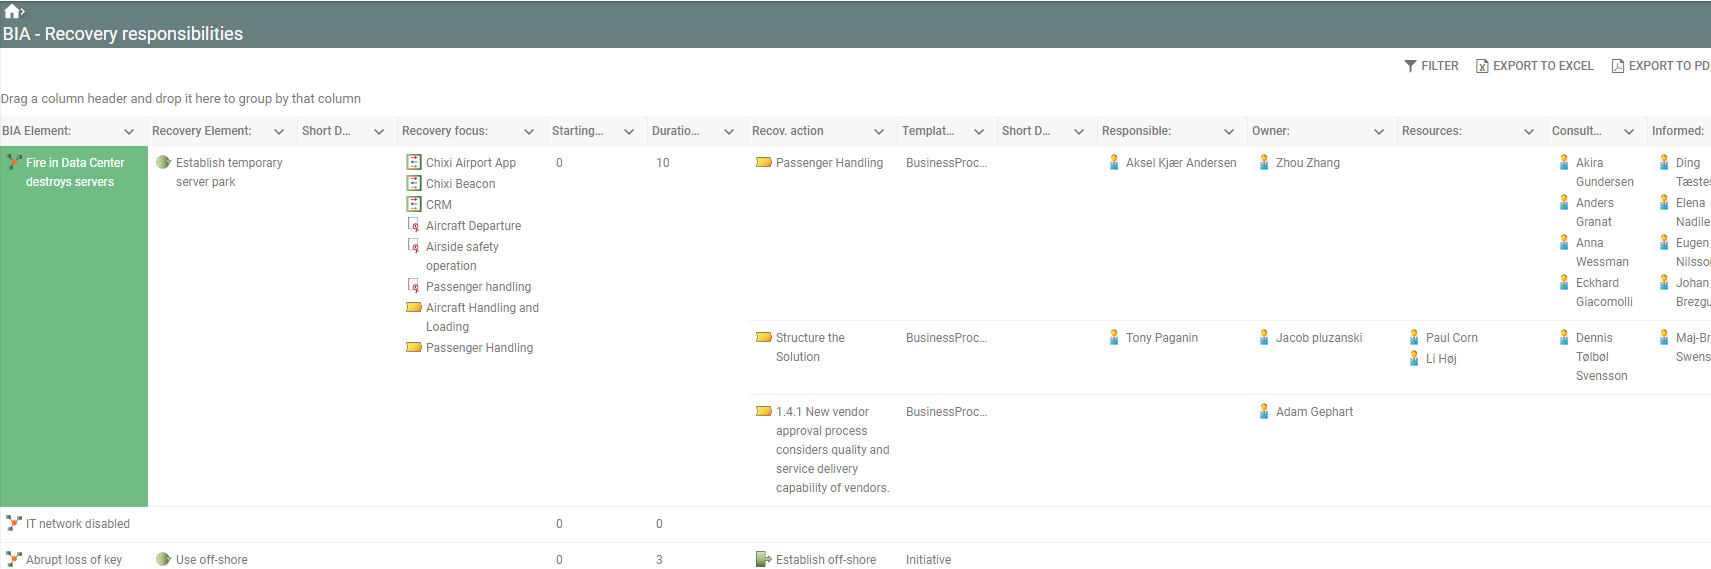
Other analysis reports will help you build, test, train and maintain the business continuity management systems including a report that clearly defines the recovery actions and schedule as well as all responsibilities and employee involvement in the recovery.
Sustainability
QualiWare 10.3 has extended its existing support for environmental management and ISO 14001 with support for a wider sustainability agenda adopted by modern businesses. This includes support for UN Sustainable Development Goals and UN Global Compact.
If you wish to be able to look your grandchildren in the eyes and tell them, that you did what you could, your business need to focus on these concepts
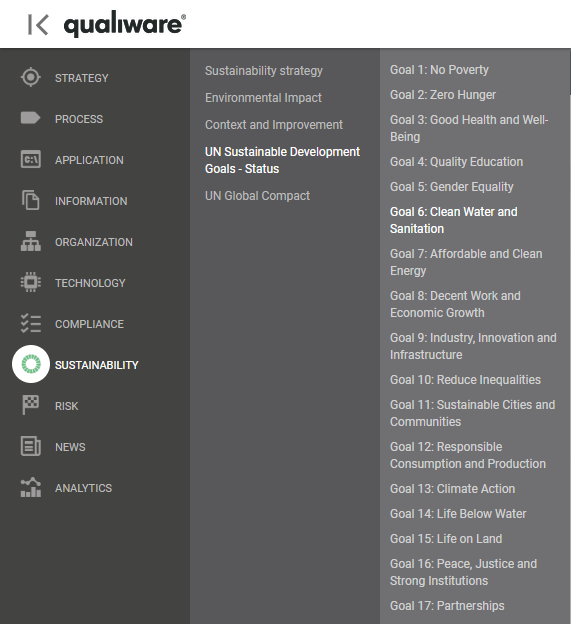
The Sustainability menu will out-of-the-box appear only if your role includes Management or Enterprise Architect, but this may be changed with a simple configuration of the menu.
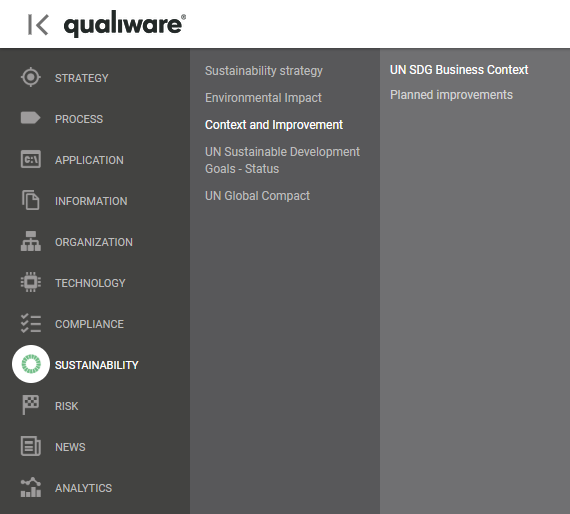
The Sustainability strategy focus on the eco-system in which the business exists, in other words, “Where do we have a challenge?”. This menu also allows you to document goals and strategies related to a sustainability agenda, and to document planned initiatives and projects that is assigned to approve the sustainable performance. All Business Eco System diagrams, Goals and Initiatives must be tagged with #UN to be included in these reports.
The environmental impact menu-option refers to the existing support for Environmental Impact Diagrams and Environmental Aspects.
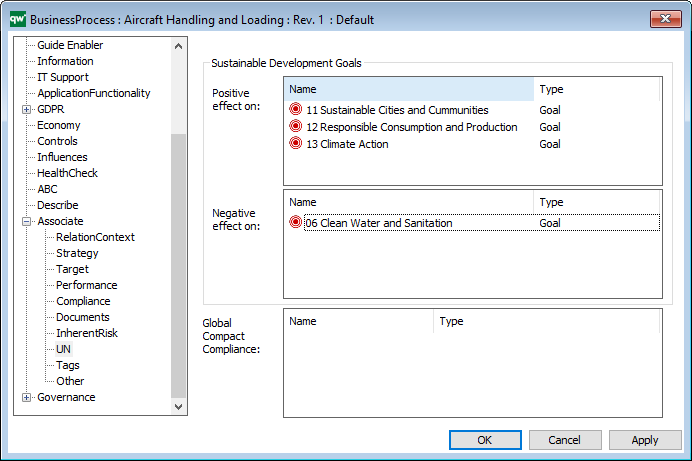
To relate the existing business models to a sustainability agenda a new “UN” sub-tab has been included under the Associate sub-tab. This allows the content owners to relate to the UN goals that will be positive or negative affected by the content (process, application, product etc.).
See below:
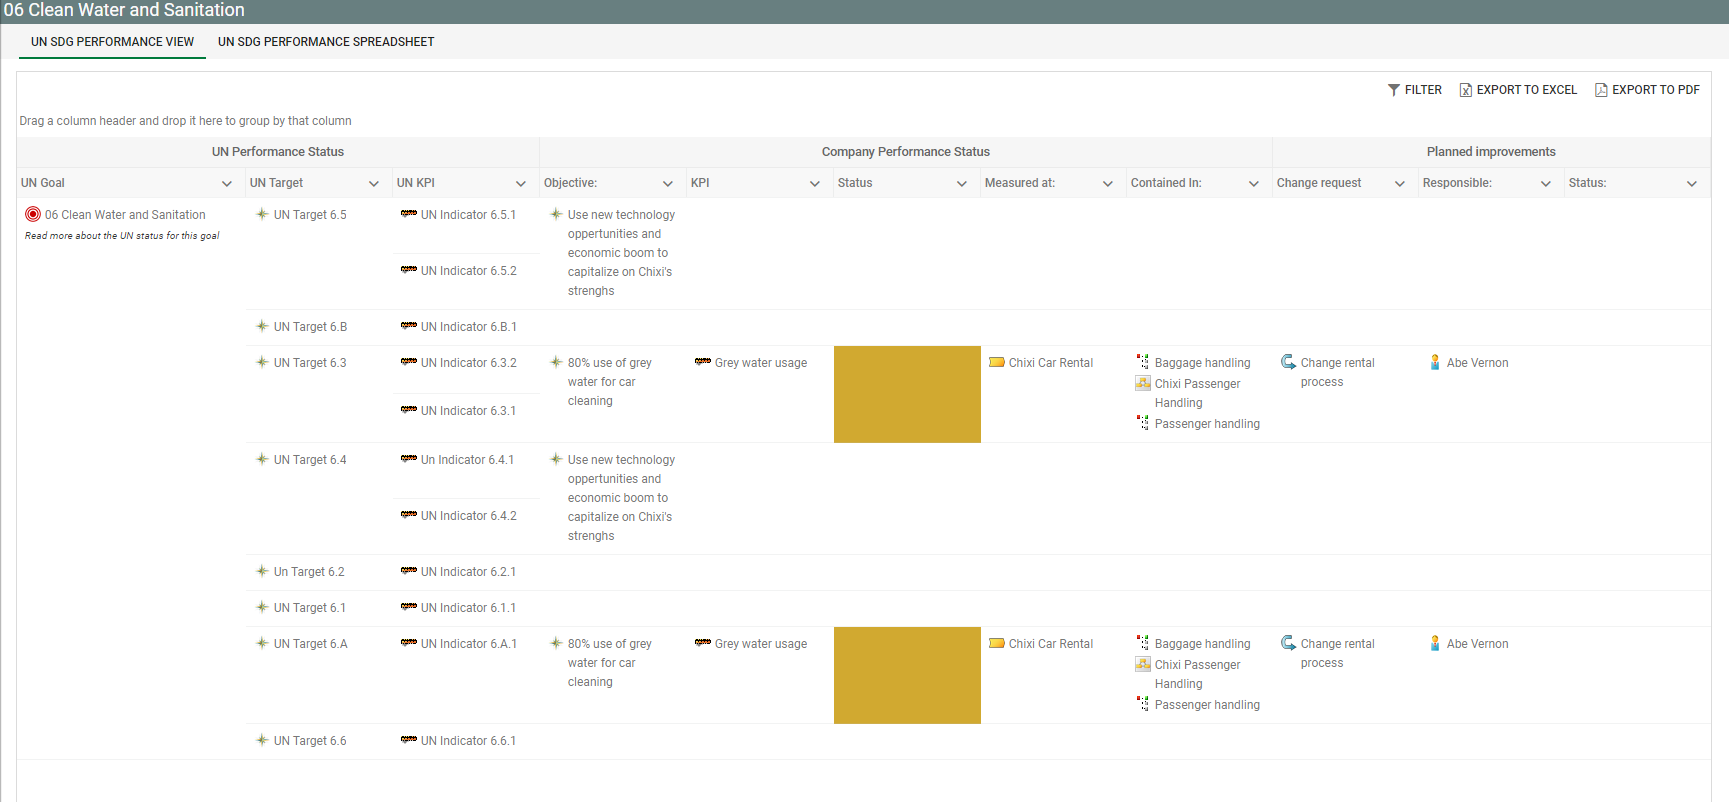
The UN SDG Status menu has two options: One for analysing the business context for the 17 UN Sustainable Development Goals, and one for assessing the impact of the planned improvements.
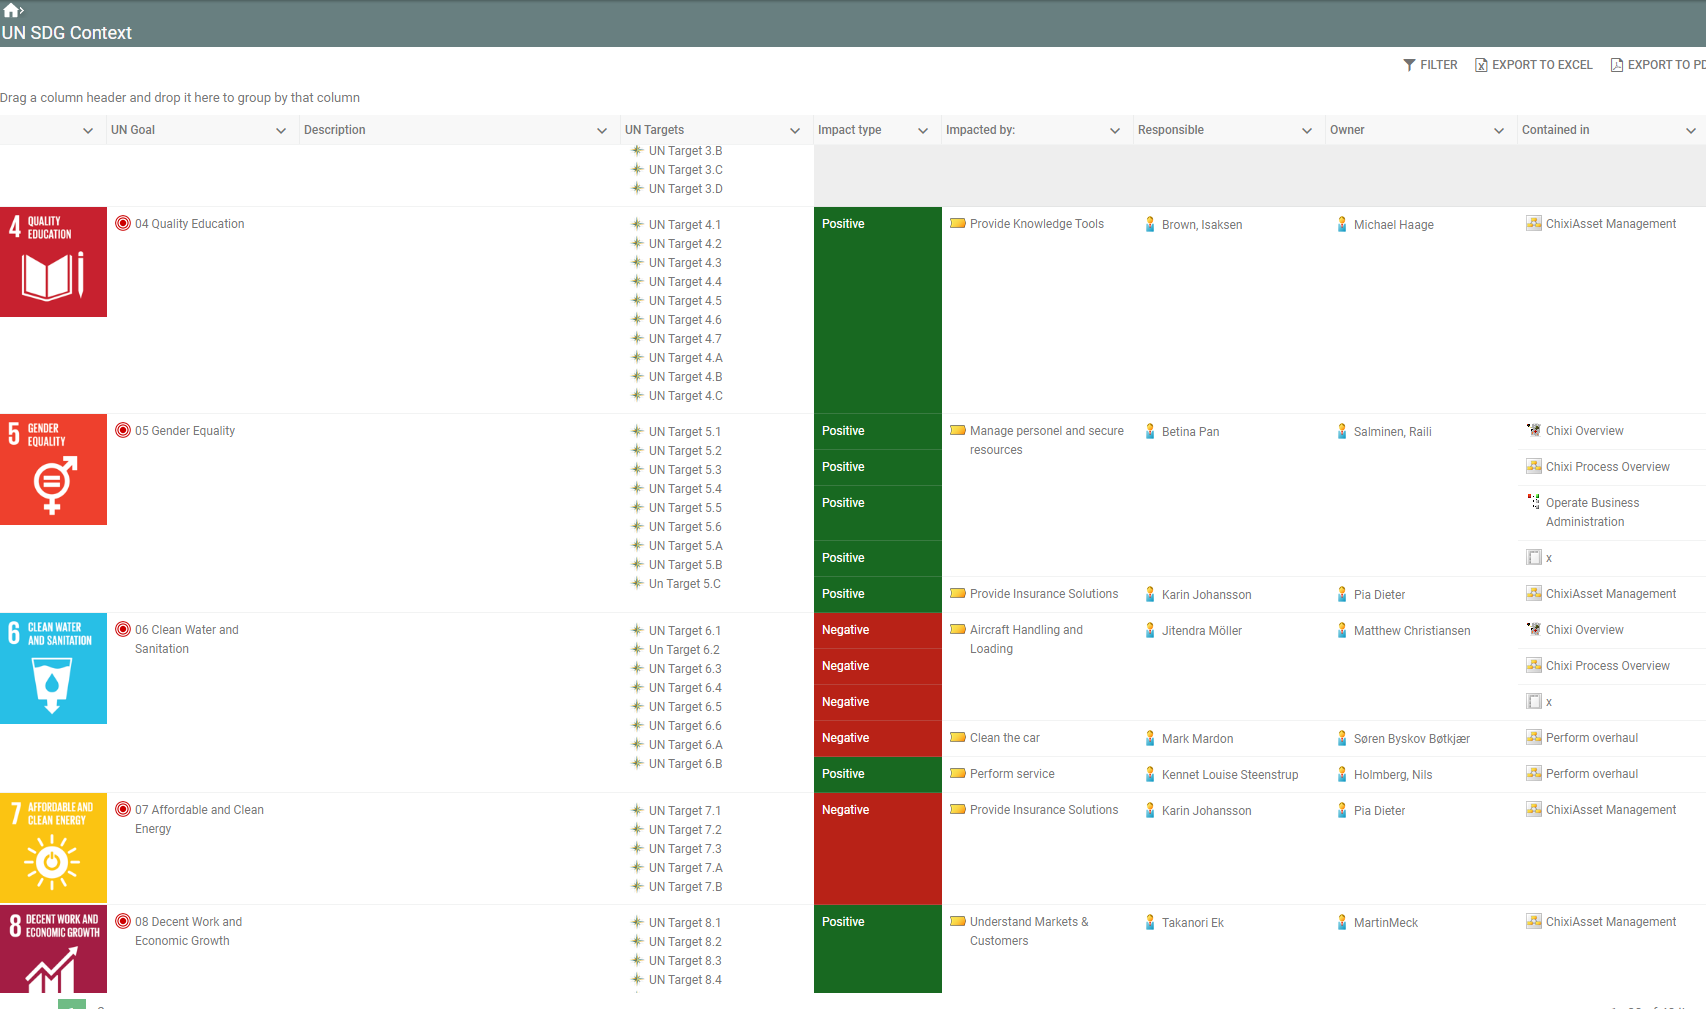
To analyse how a specific UN Sustainable Development Goal is handled by the business, a menu showing each goal and the business performance is included.
This analysis will show the UN SDG including a link to the UN web-site for inspection of the global performance, and it will show the company KPIs related to the UN Objectives and what the performance status of the business is.
The performance status for each UN SDG is reached through this menu:
The performance report has an included sub-tab where a spreadsheet allows the user to update the performance data.
New desktops and tiles
New role-based desktops and tiles are provided with QualiWare 10.3.
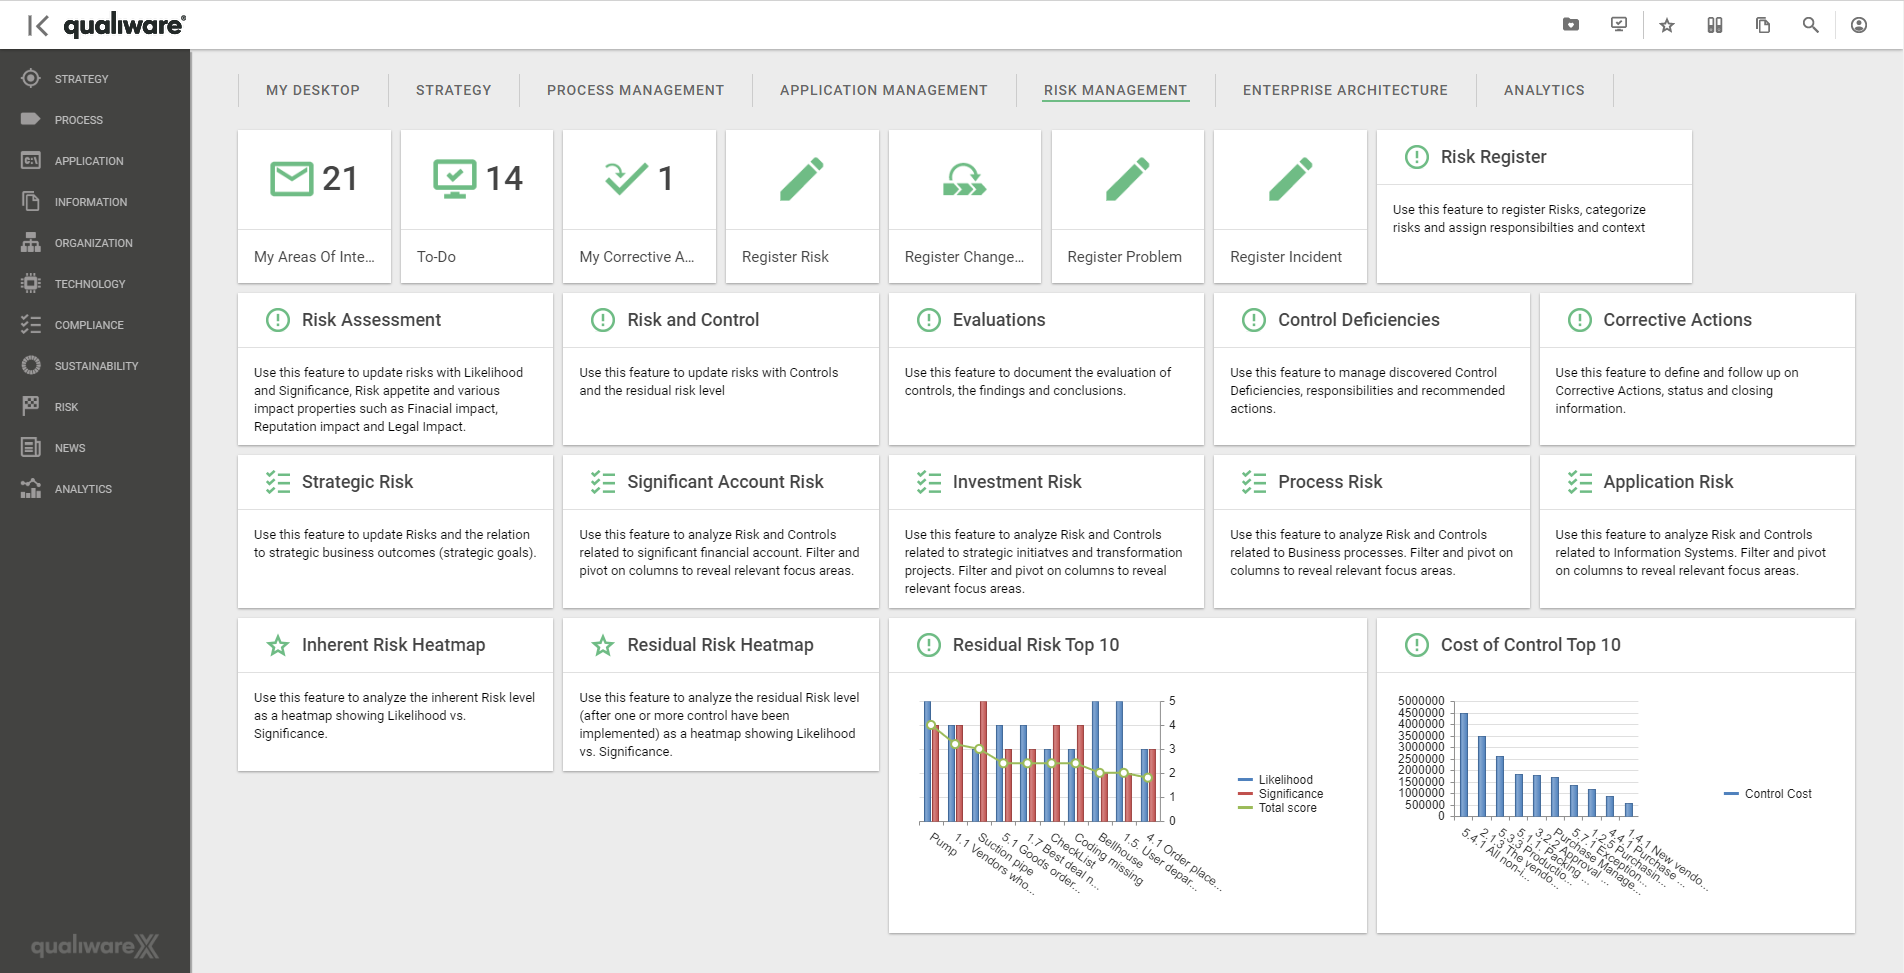
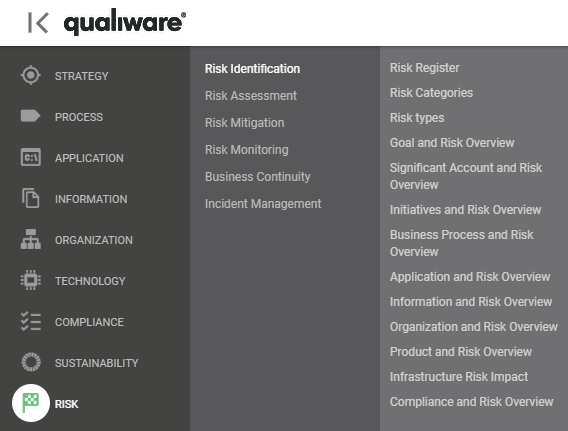
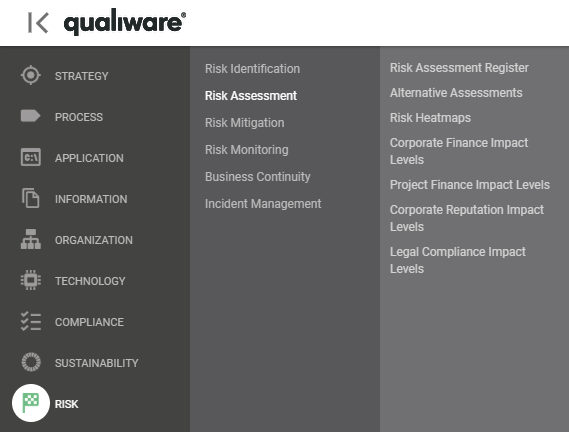
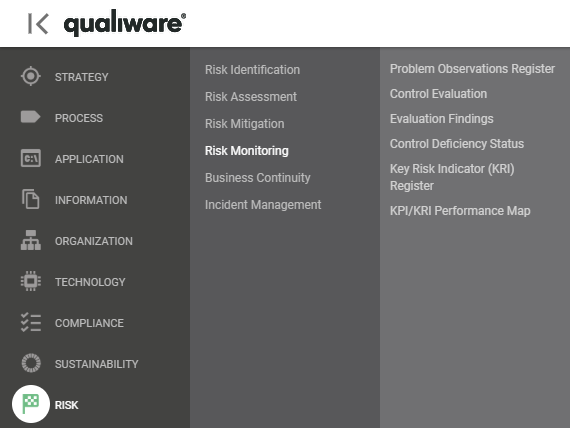
The Risk Management desktop and the Risk menu-option has been updated to support all aspects of a modern integrated risk management system.
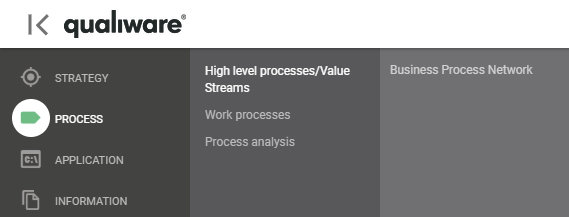
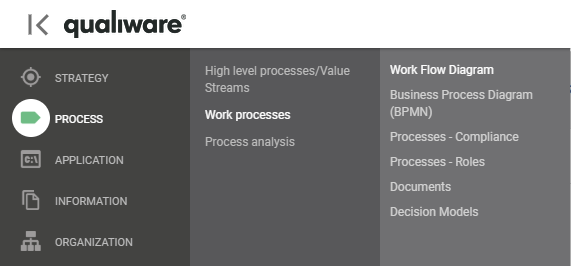
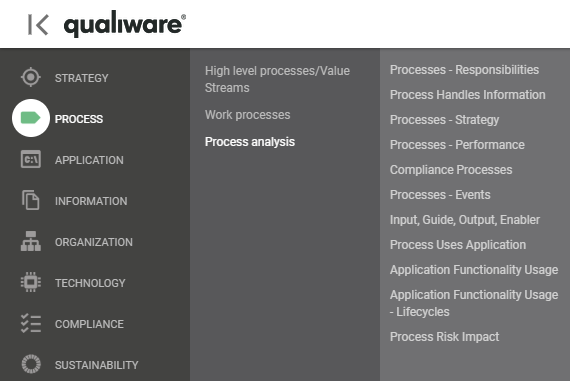
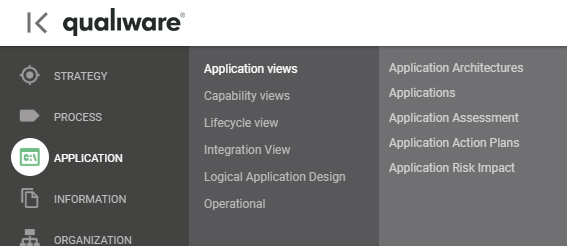
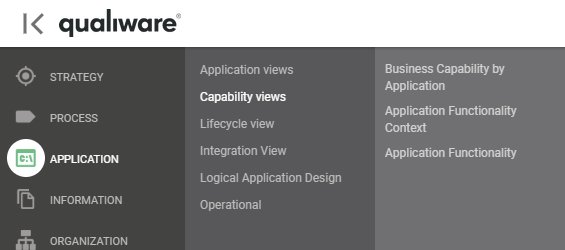
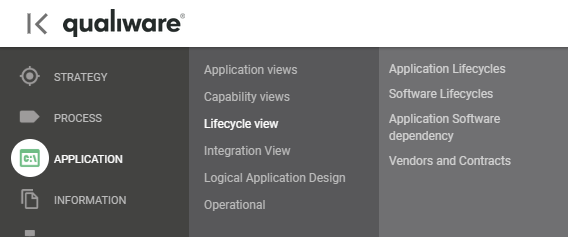
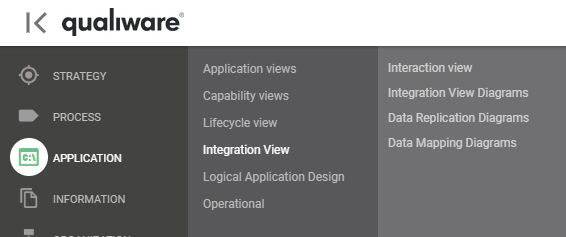
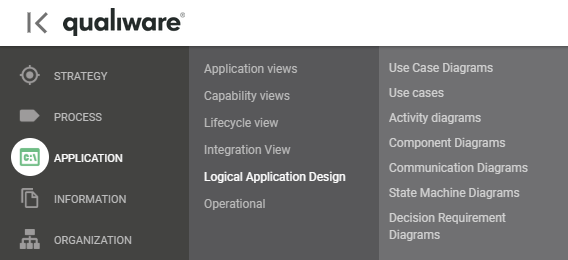
New menu structure
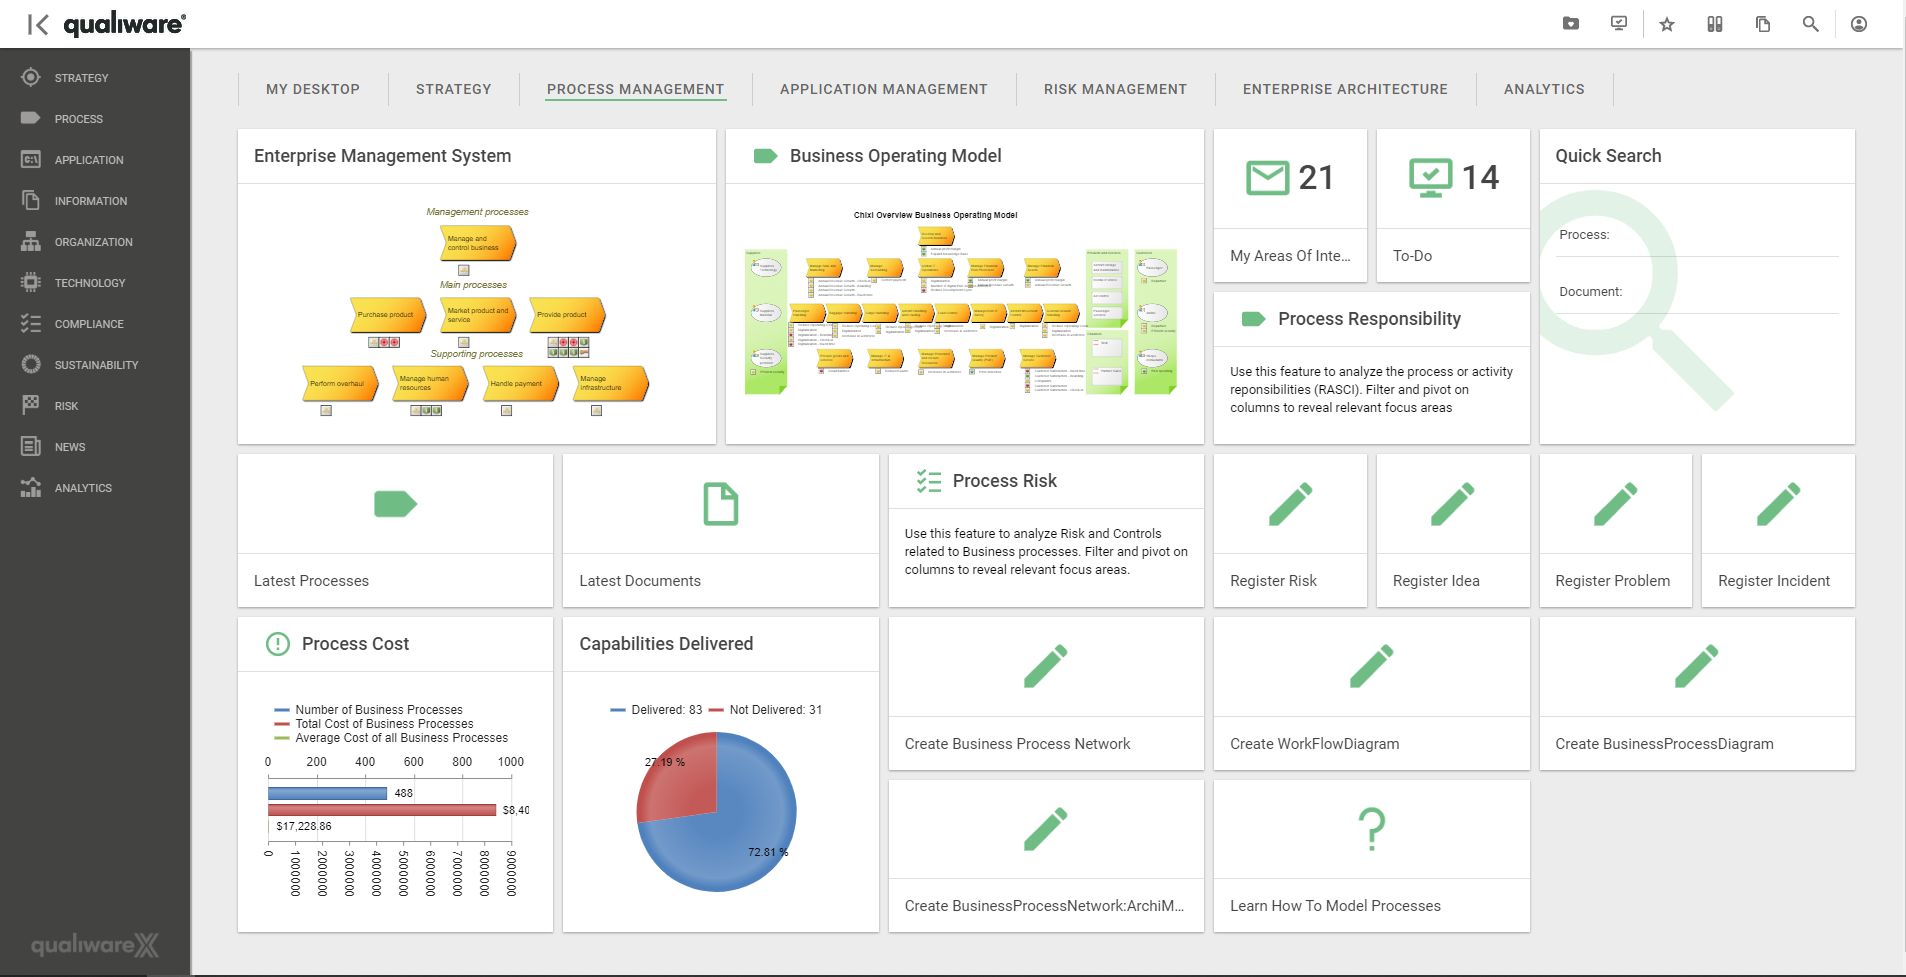
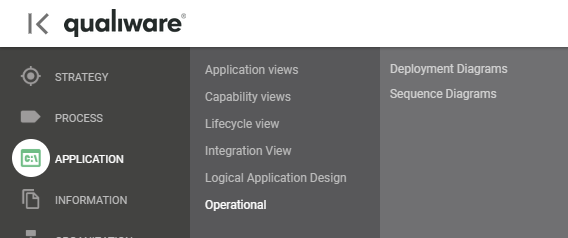
The menu structure for the process area, the application area and the risk area have been changed to support a more methodology-oriented structure.
Process menu
Application menu
Risk menu

New analysis reports
A series of new analysis reports is included in the menus and desktop tiles described above.
Context menu in Repository Explorer
A new context menu with essential features have been introduced in the Repository Explorer.
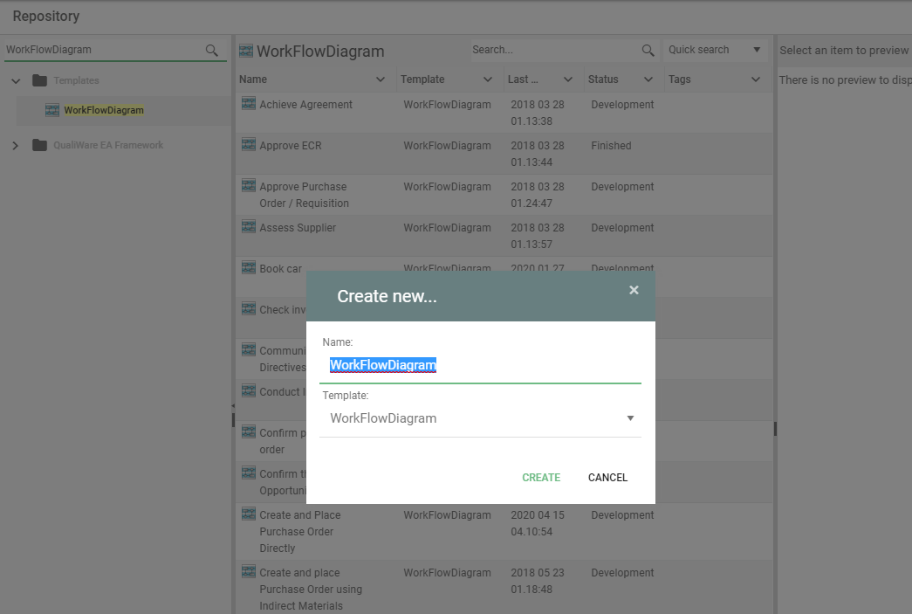
When the user hovers over a template a small ‘Create new’-menu is available from the “three-dot sushi-menu”.
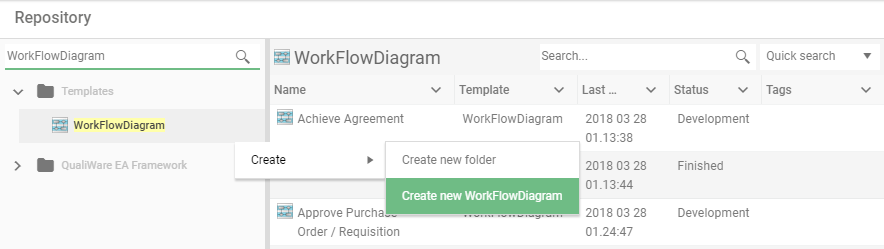
Create a new object directly from the menu and open the web-modeler ready to design your new process.
When a user hovers over and click an object in the list pane in the Repository Explorer, a more advanced context menu appears.
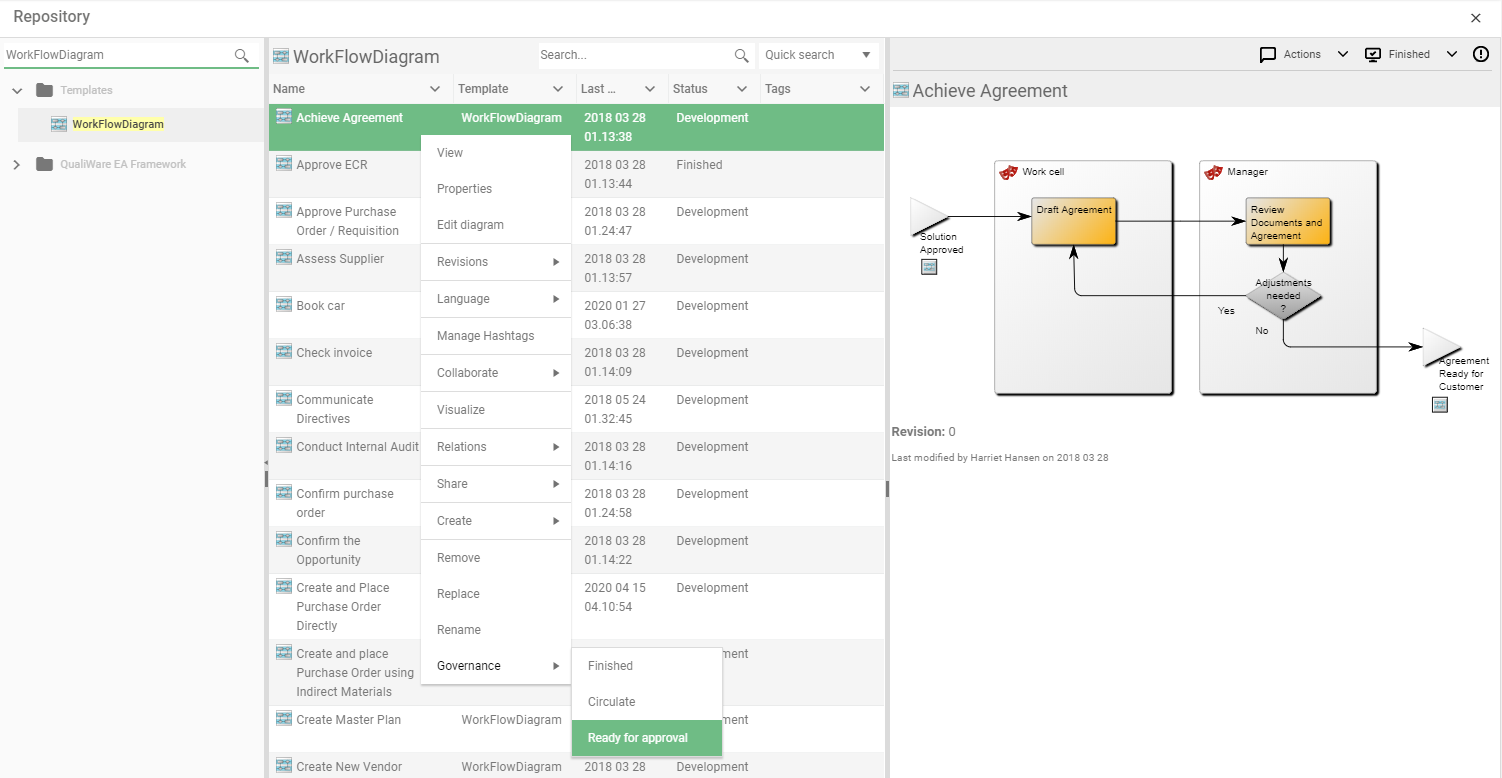
This menu offers all necessary features to maintain and analyse the content of the repository. The menu will also offer the relevant governance actions for the selected object, which enables a faster governance process, as it is not required to open the object to move it forward in the lifecycle.
[su_vimeo url=”https://player.vimeo.com/video/442000463″]
Complete set of default web-forms for all templates
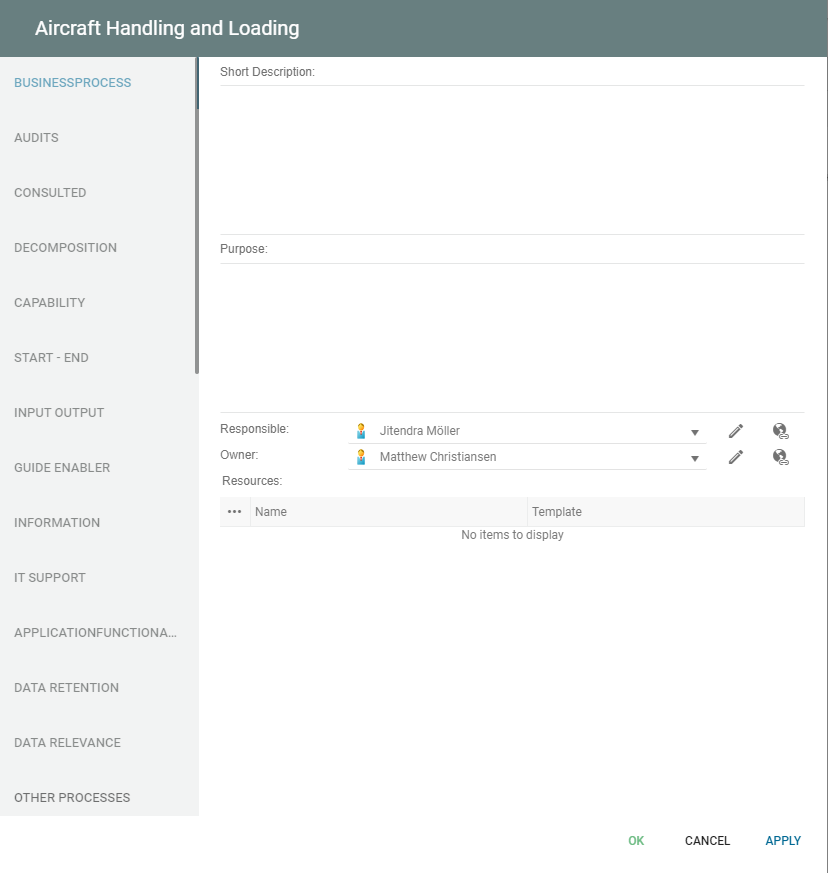
QualiWare 10.3 contains a set of predefined web-forms for all templates.
The form as it appears in the windows version of QualiWare Architect:
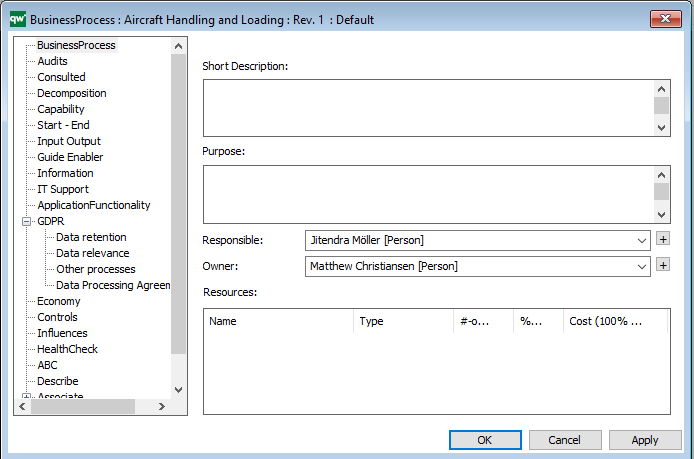
Note that, the compact form with collapse/expand of sub-tabs is currently not supported on the web. Therefore, the expanded set of sub-tabs are included in the root list of sub-tabs.
Also, the forms have been scaled in the web to comply with the flat ‘material’ design scheme used by QualiWare 10.3 on the web.
The form as it appears in the auto-generated web-version of the same object.
Notice the scrollbar that gives access to the remaining sub-tabs.
3D Visualization
A new 3D visualization feature has been introduced. The feature is available for all objects from the Repository Explorer Context Menu.
When “Visualize” is selected, the 3D visualizer is opened with the selected object in the centre. Objects shown on the left will link to the centre object and objects on the right are linked by the centre object.
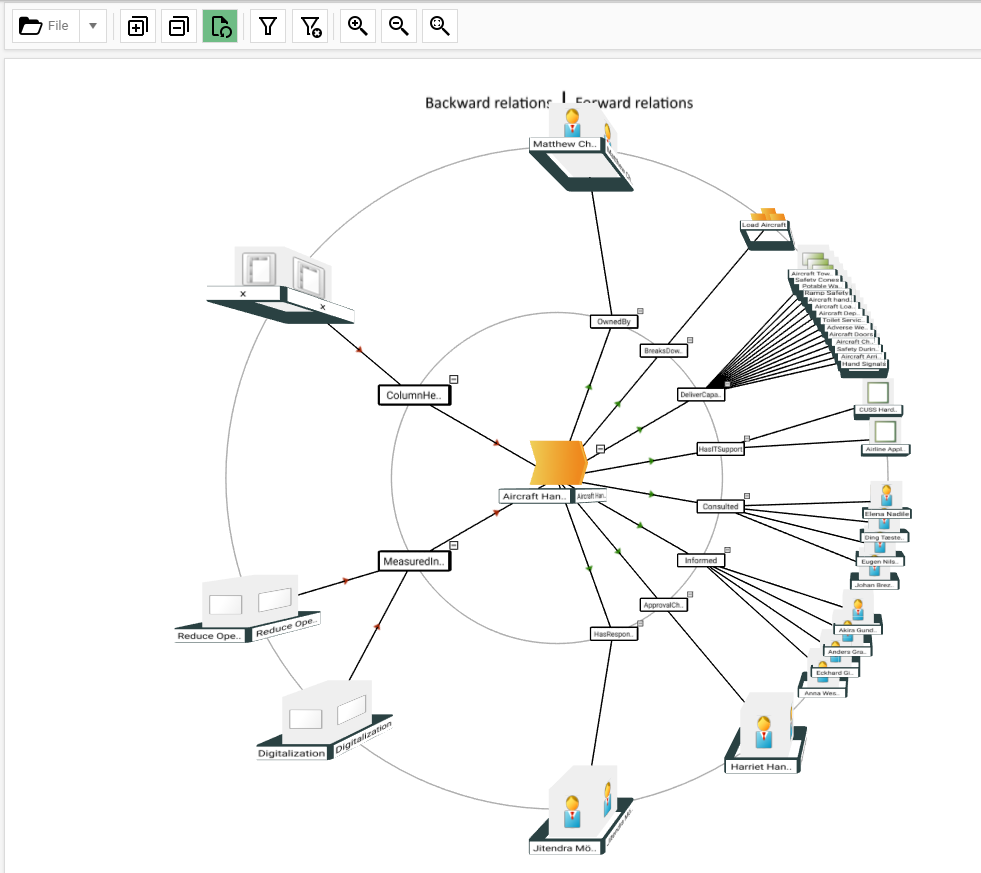
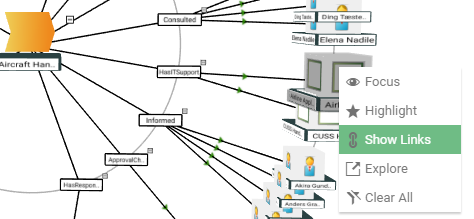
View may be turned, and a right-click menu allows the user to open a third dimension of relationships from the selected periphery object.
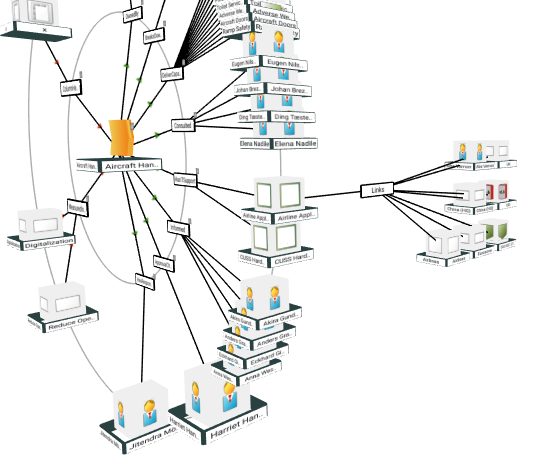
The 3D Visualizer may also be accessed from several list (so-called QueryResultViews or QRV).
This option will result in another “flower-like” view with all first-column objects in the centre ring, and the relationships shown in the QRV as outer rings.
Filtering, highlighting, text search, exploring and other features may be used to analyse and re-render the visualization of this non-graphical data.
Web Modeler
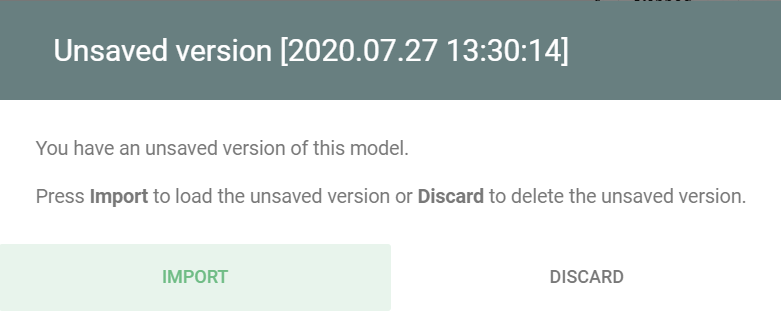
The web modeler has been improved to protect against losing work in unstable network conditions, browser crash and accidental page change. When editing a diagram, the web modeler will now notify the user of an unsaved version of the diagram and ask if the user want to import this unsaved version:
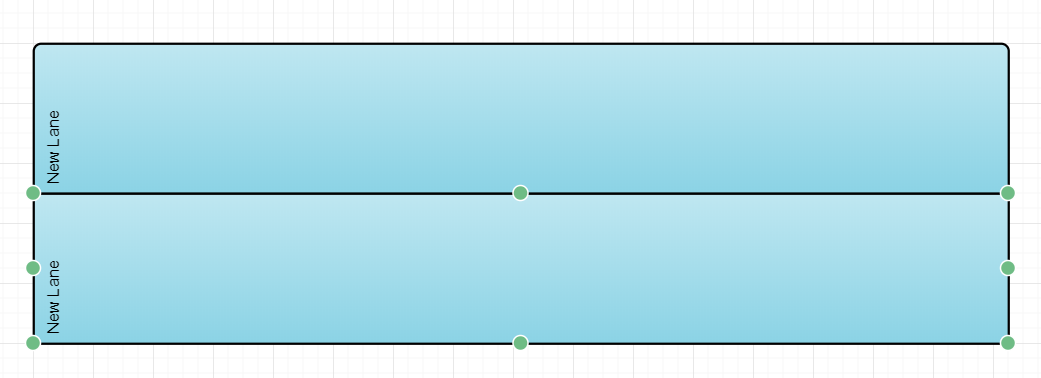
Improved swim lane builder in the web modeler. The auto create arrow will now place framing symbols next with no distance between the symbols. Example: Lanes will not have any distance:
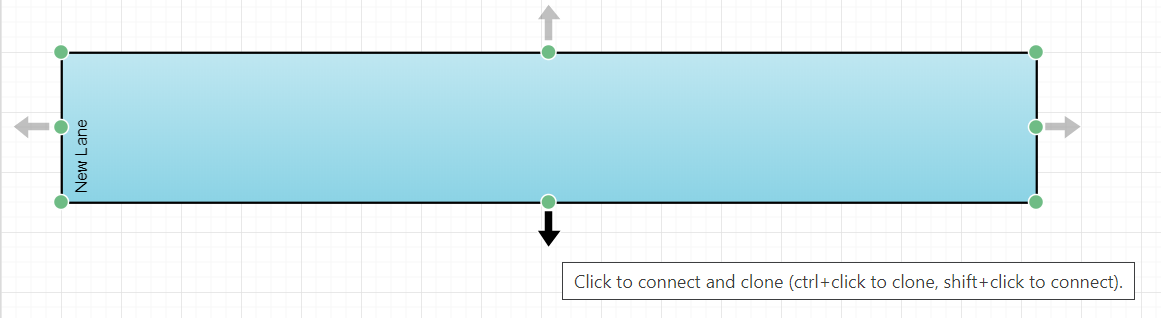
Clicking the down arrow: