Value Flow

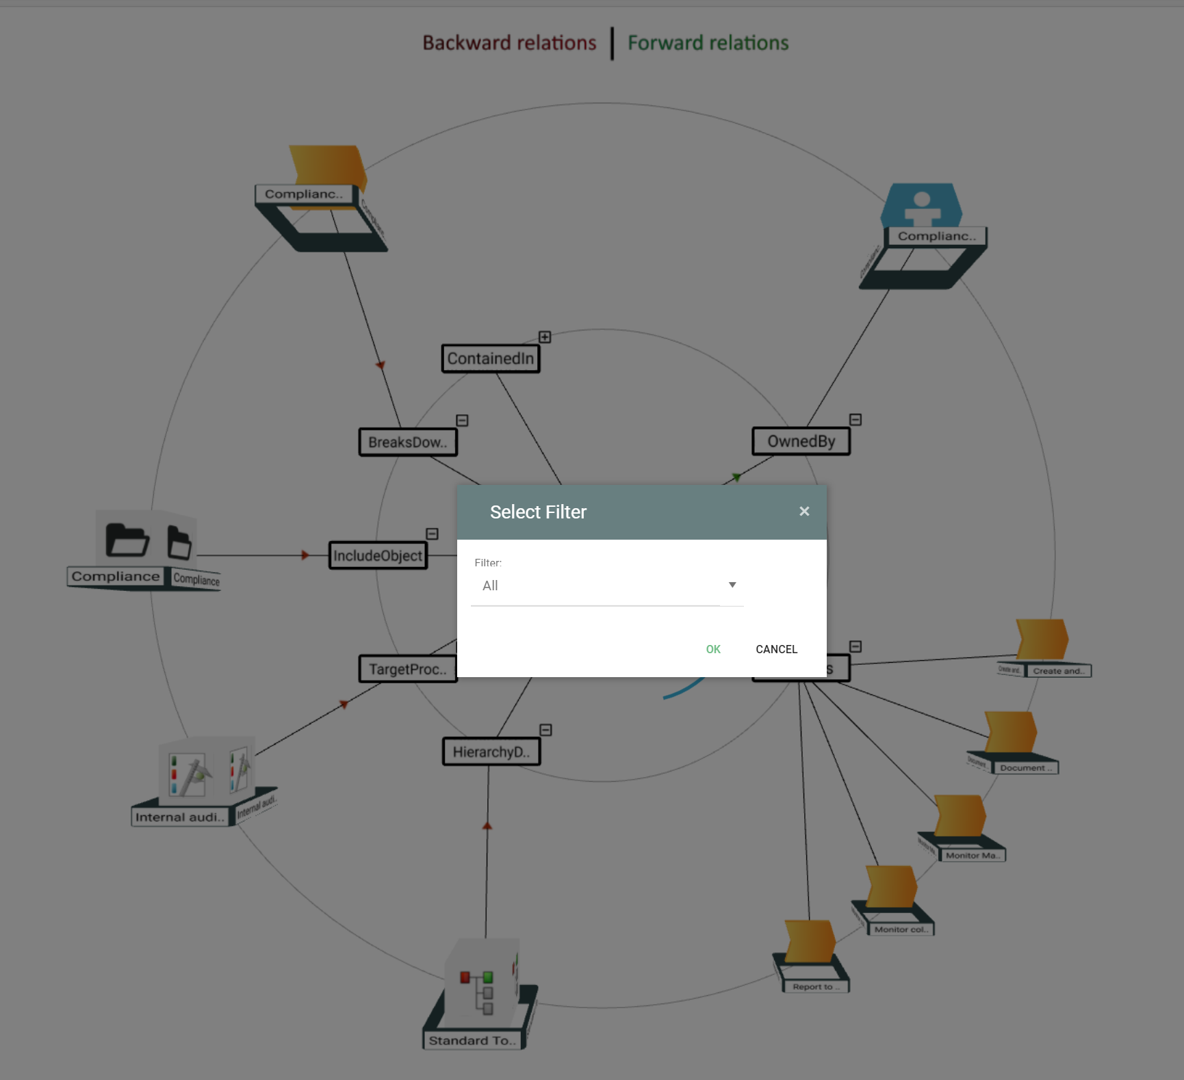
Value flow is a type of connection used in business process modeling to represent the flow of value or information between different elements in a process. It shows how inputs are transformed into outputs, and how value is added or changed as the process progresses.

In a business process network, value flow connections can be used to illustrate how different processes interact with each other, and how value is exchanged between different business units or stakeholders. Value flow connections may also represent the flow of information or data between different systems or departments and can help to identify opportunities for process optimization or improvement.

User Interface

In a workflow diagram, the user interface symbol represents the point at which a user interacts with a system or application. It indicates the point where a user inputs data or makes a selection, and where the system displays information or results back to the user. The user interface symbol is typically represented by a rectangle with rounded corners, and may include labels to indicate the specific type of interface, such as a button or text box. It is an important symbol in workflow diagrams as it helps to identify the different touchpoints where users interact with the system, and can be used to guide the design of the user interface for optimal usability and efficiency.

Usage

Usage is a concept in Class Diagrams that represents a relationship between elements, indicating that one element (the client) uses or depends on another element (the supplier) without specifying the nature of the relationship in detail. The Usage relationship is a type of dependency that implies that the client element requires the presence of the supplier element to perform its function, but does not imply any kind of ownership or control over the supplier.

In a Class Diagram, Usage can be applied to various elements such as classes, interfaces, components, or packages. It helps to model the dependencies and connections between elements in the system, highlighting how different elements are related and rely on each other.

Example: In a Class Diagram for a system that manages a library, you might have a class called “LibrarySystem” that uses another class called “Book”. The Usage relationship between these classes indicates that the “LibrarySystem” class depends on the “Book” class to perform its functions, such as managing book loans and returns. This relationship shows that the “LibrarySystem” requires the presence of the “Book” class, but it does not imply any ownership or control over the “Book” class by the “LibrarySystem”.

Treasure Hunt

Description of this template will be available soon.

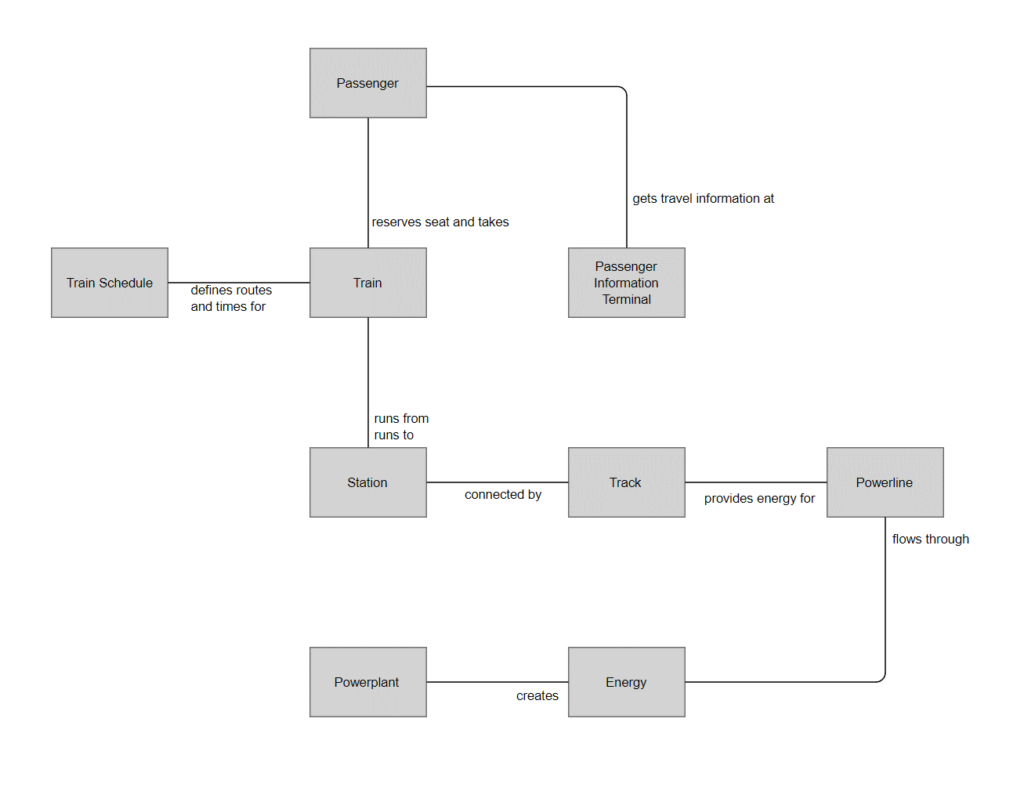
Transport System

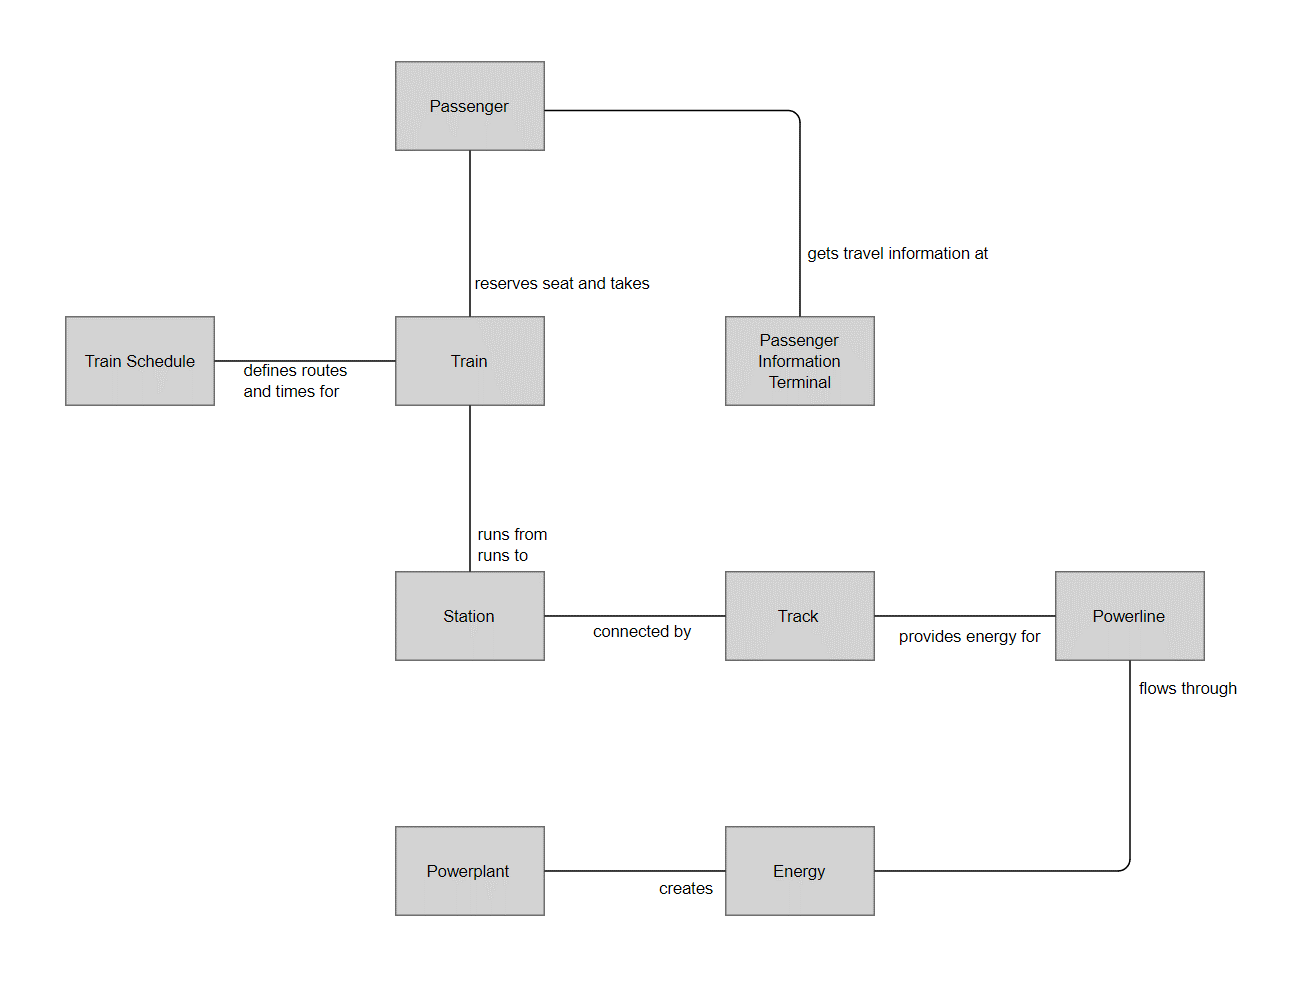
Transport system refers to the physical or virtual systems that are used to transport goods or information from one location to another within a larger system or network. A transport system can include a variety of components, such as vehicles, shipping containers, information technology systems, and other equipment that is used to move goods or information.

Arrows or lines may be used to show the direction and flow of transport within the system, as well as the connections between different components. For example, a line might connect a shipping container to a truck to represent the movement of goods from a warehouse to a shipping port. Similarly, a line might connect a computer network to a satellite to represent the transfer of information between different locations.

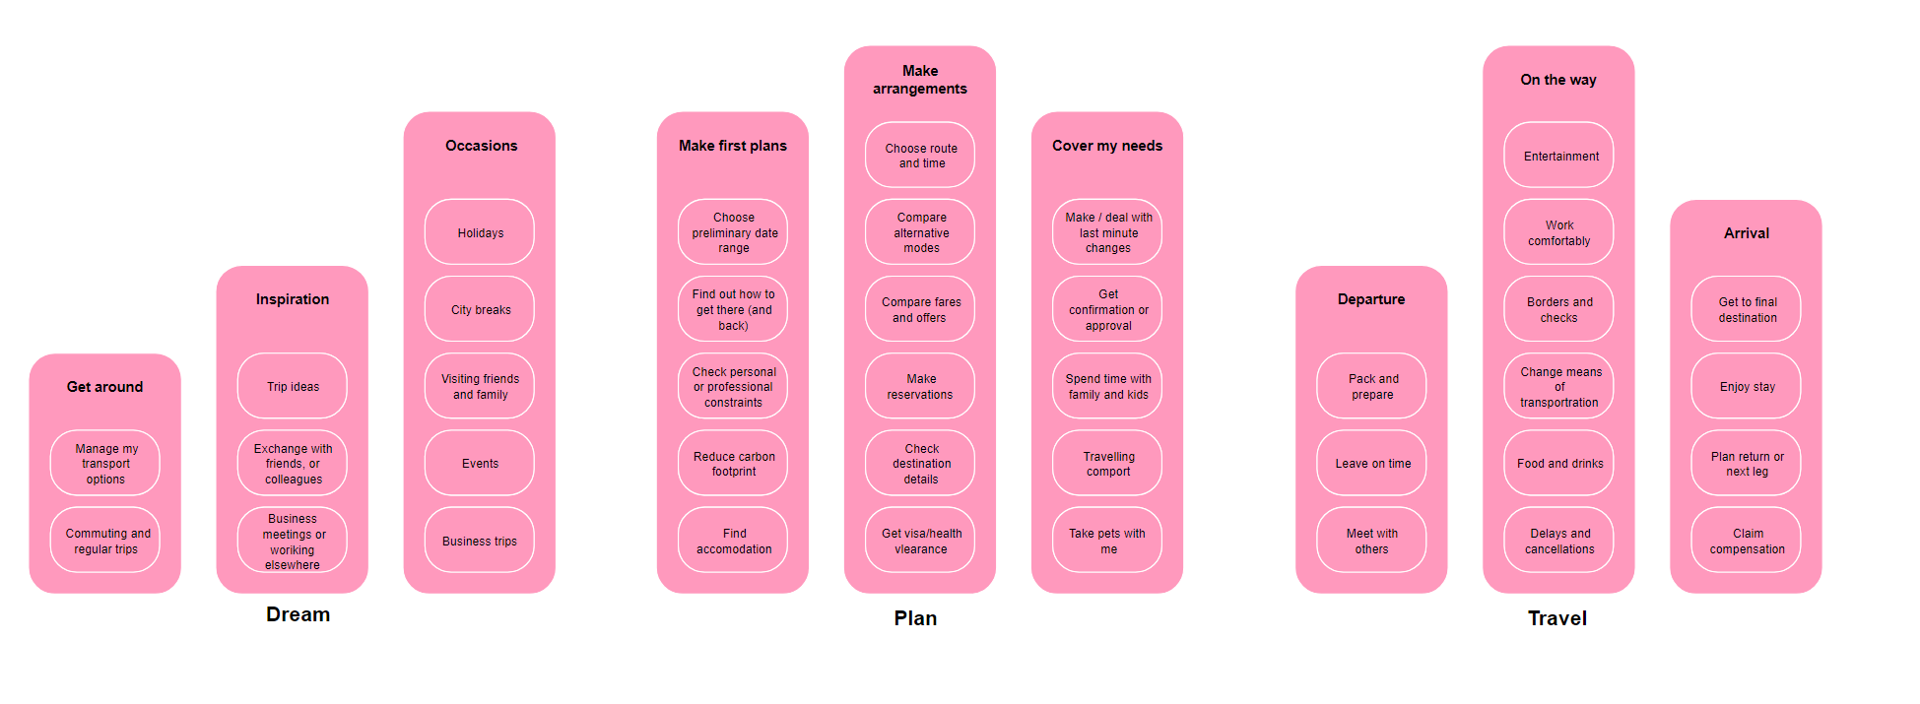
Touch Point

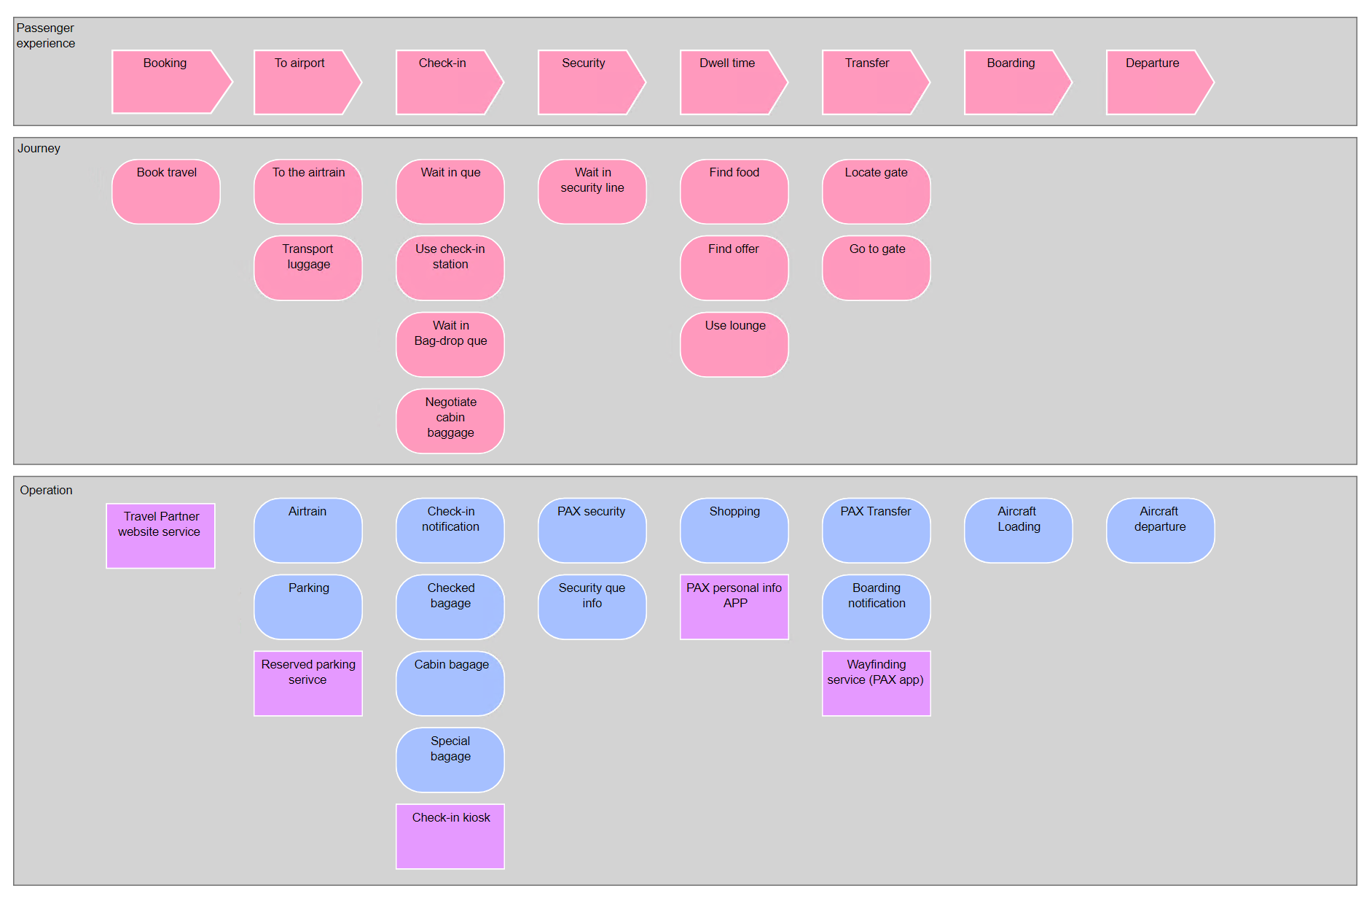
A touchpoint refers to any interaction or point of contact that a customer has with a company during their journey. Touchpoints can occur at various stages of the customer journey, from initial awareness of a company’s products or services, to post-purchase support and beyond.

Touchpoints can be physical (such as visiting a store or interacting with a sales representative) or digital (such as using a company’s website, mobile app, or social media channels). They can also be proactive (such as a sales call or promotional email) or reactive (such as a customer service call or complaint).

Each touchpoint represents an opportunity for a company to engage with its customers and make a positive impact on their experience. Touchpoints can influence a customer’s perceptions of a company, and if handled well, can lead to increased customer satisfaction, loyalty, and advocacy.

When mapping the customer journey, it is important to consider all of the different touchpoints that a customer may encounter, and to design them to be as positive and seamless as possible. This can help to create a more consistent and enjoyable customer experience and increase customer satisfaction and loyalty.

Timeframe

In a Strategic Roadmap, the symbol Timeframe is used to represent a specific period of time or a range of time during which a project, initiative, or objective will be executed. It usually appears as a horizontal bar or a line on the roadmap, and its length or position can indicate the duration or start/end date of the associated activity.

For example, in a Strategic Roadmap for a software development company, the Timeframe symbol might represent a six-month period during which the company plans to release a new product. The length and position of the symbol on the roadmap would indicate the start and end dates of the development, testing, and launch phases of the project. By including the Timeframe symbol on the roadmap, stakeholders can quickly understand the timing and duration of the company’s initiatives and plan their own activities accordingly.