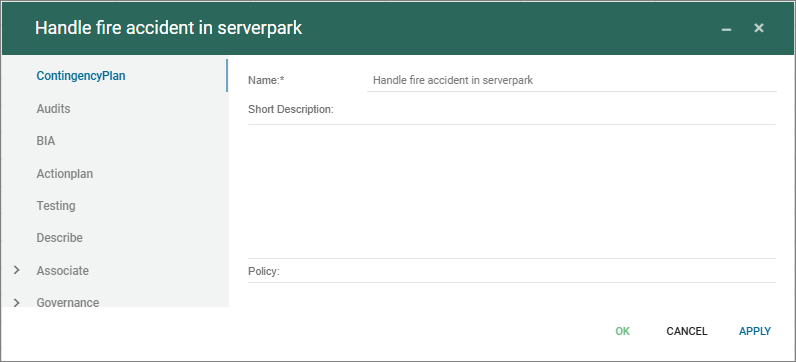
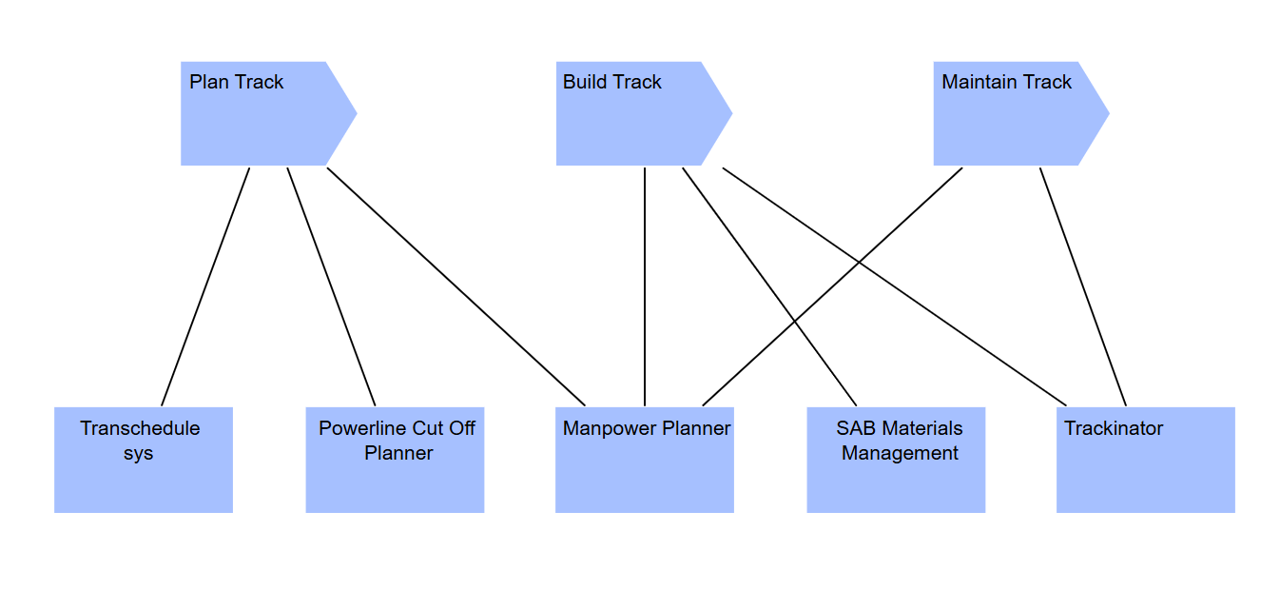
The DataConversionTemplate specifies a Interface and the settings for conversions.
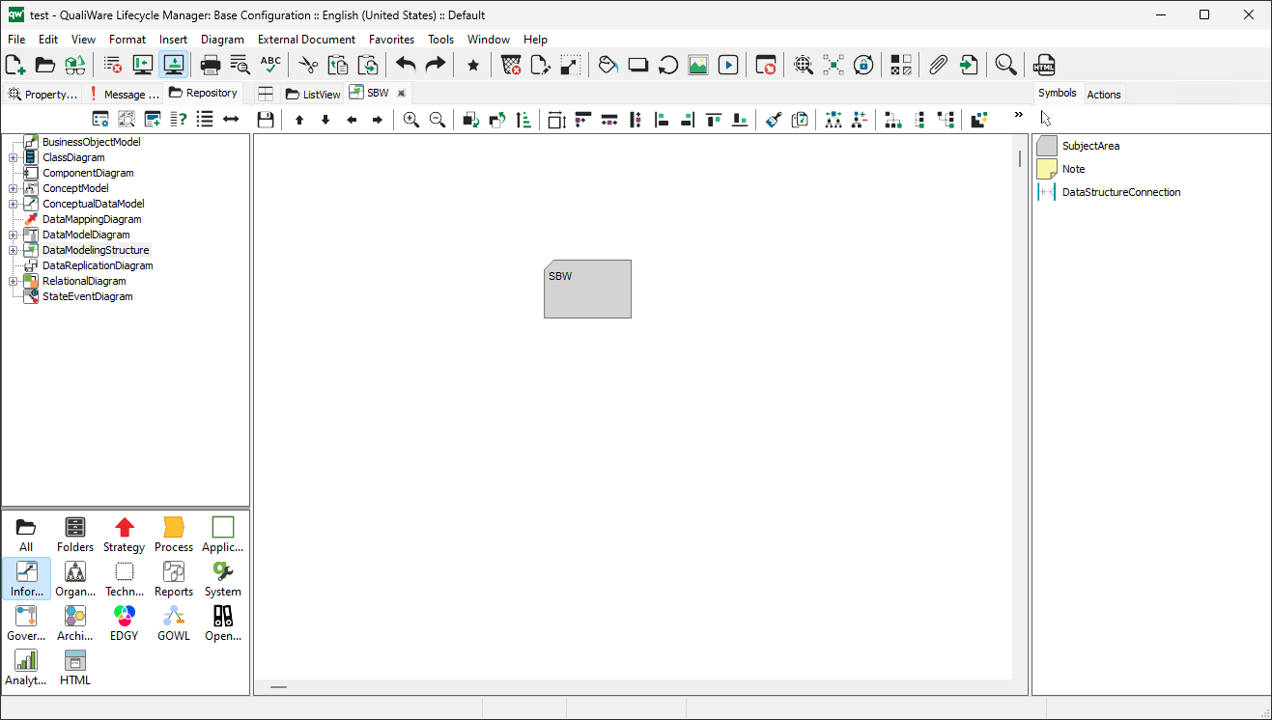
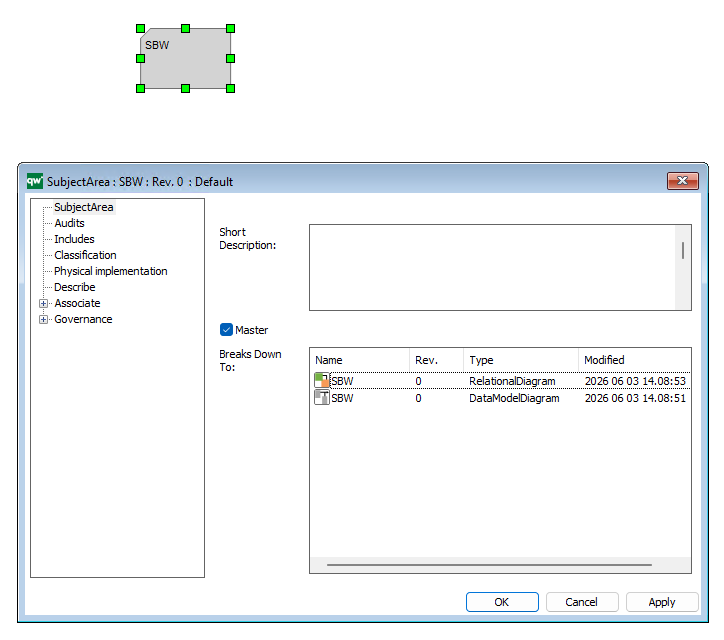
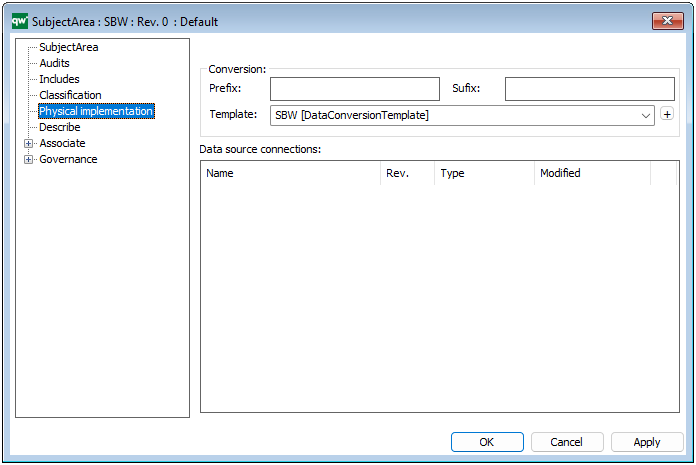
It can be used to do reverse engineering of databases, linked by a SubjectArea (on the Physical Implementation tab) from a DataModellingStructure.
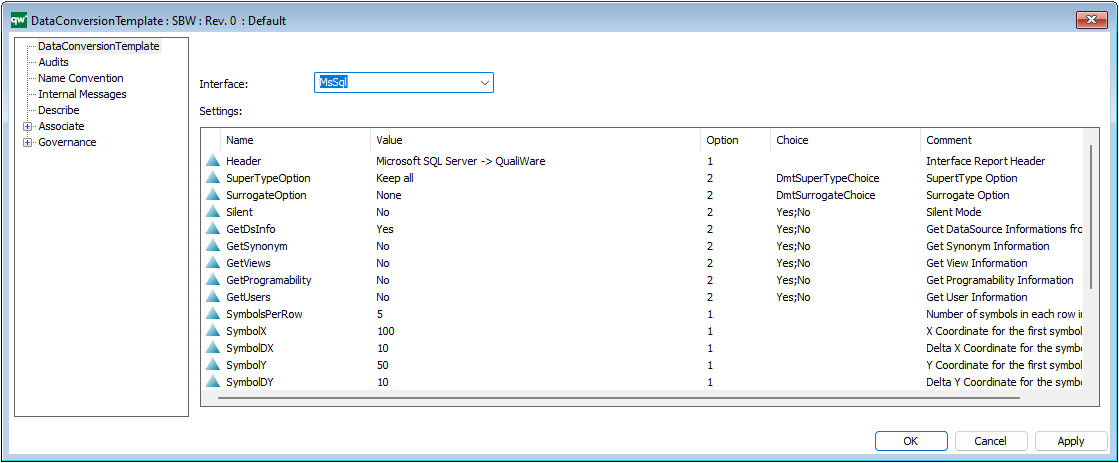
The DataConversionTemplate specifies an Interface and the settings for conversions.
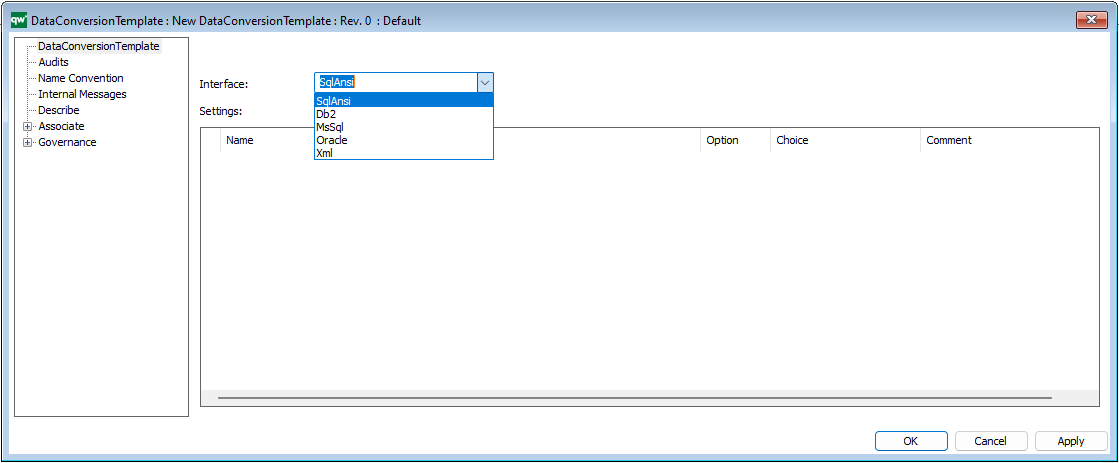
– Select the Interface and create the default values.
Right click the Settings areas a select Default to add the Default Content.
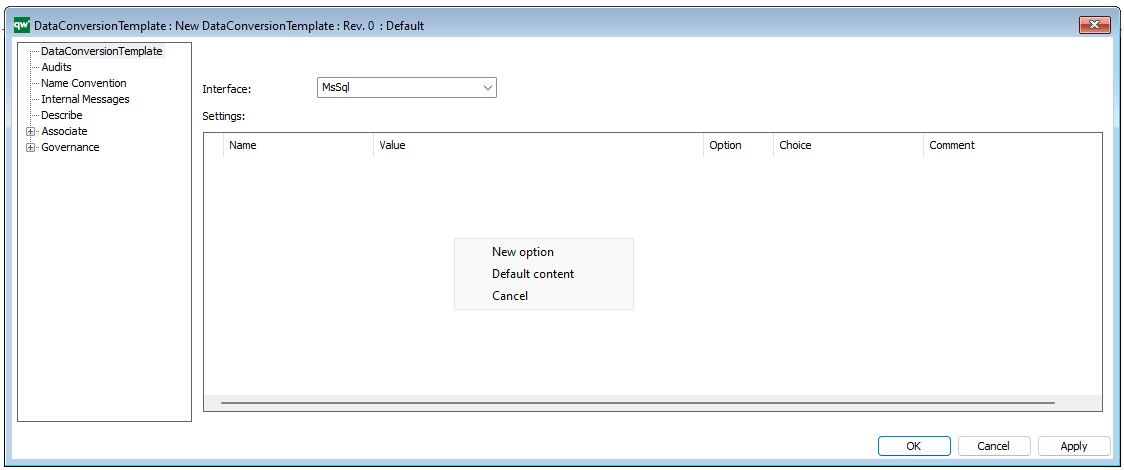
The settings can also be added manually.
Hint: New option fields are read-only by default. Move the horizontal cursor to the left and select the Option will enable 4 options:
- 0 => Read only
- 1 => Editable as string
- 2=> By choice e.g. True or False (Add choices in ‘Choice’ column, before selecting default value in ‘Value’ column )
- 3=> Object selection filtered by template
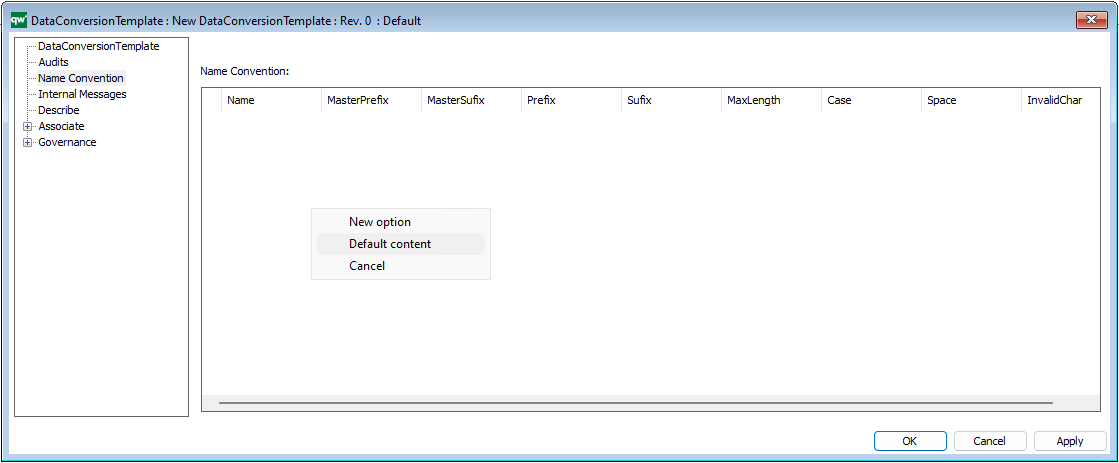
Name Convention
Right click the Settings areas a select Default to add the Default Content.
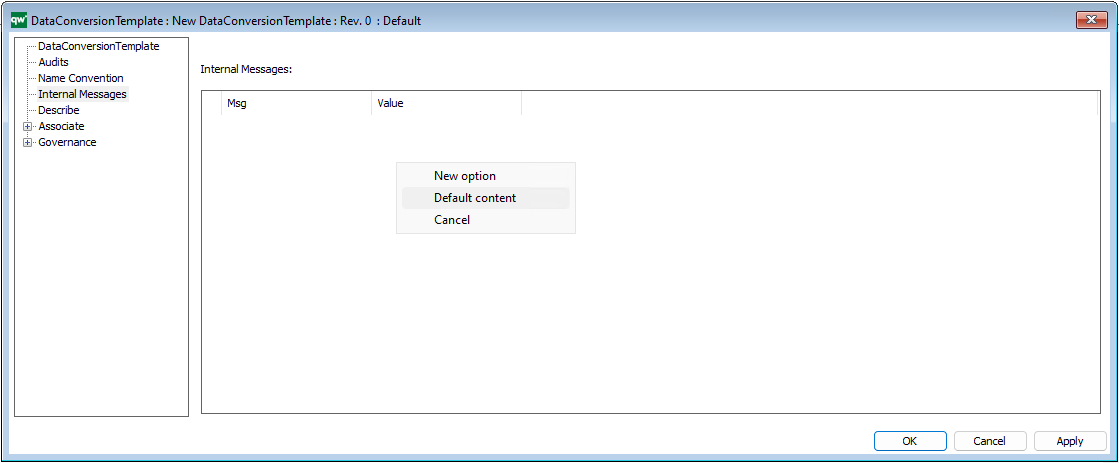
Internal Messages
Right click the Settings areas a select Default to add the Default Content.
Video
The DataConversionTemplate can be used to reverse engineering of databases (together with Data Modelling Structure and a DataSourceConnection)