Summary
Once clusters have been created, users can select a specific cluster or sub-cluster to view the relevant grouping of objects. Users will also be provided with a word-cloud which is generated from various attributes of the objects in the cluster.
These clusters can be given a specific name or theme, and the selected objects can be “tagged” using an existing hashtag or by creating a new hashtag. Once the objects from a cluster have been tagged, users can easily navigate to the repository explorer to further interact with individual objects for further analysis. This provides an entirely new way of creating logical groupings of objects based on their concepts or relationships without needing to create custom folders. Identifying patterns and outliers in the repository is a valuable tool for conducting analysis, rationalization, and transformation activities.
Business Value
- A new method for identifying optimization initiatives
- Analysis of repository data is accelerated by QualiWare actively grouping objects into clusters and providing a word cloud for those clusters
- Clustering graphics can be exported as an image, providing a compelling information asset for stakeholders
- Clustering is not limited to technical users. Business users can also leverage this functionality to generate insights
- The outcome of using the clustering feature is made tangible when clustered objects are tagged using our included hashtag feature
Clustering Guide

To reduce the complexity of the visualization, a filter can be applied to achieve a focused view. In this instance a filter is applied so that only risks with a high likelihood are shown:

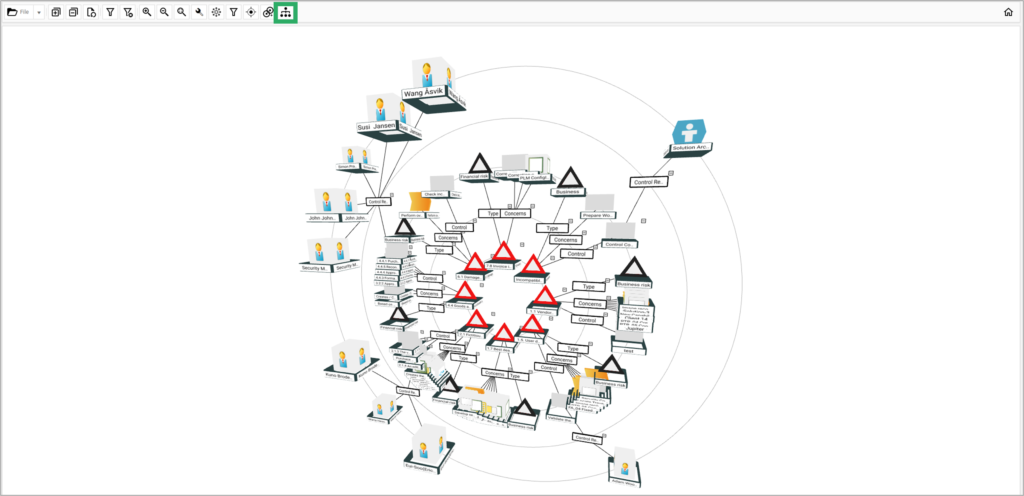
An interactive 3D visualization of the filtered table is then generated. A new clustering icon has been added to the top taskbar. When you select the clustering icon, a window will open asking how many clusters QualiWare should generate.
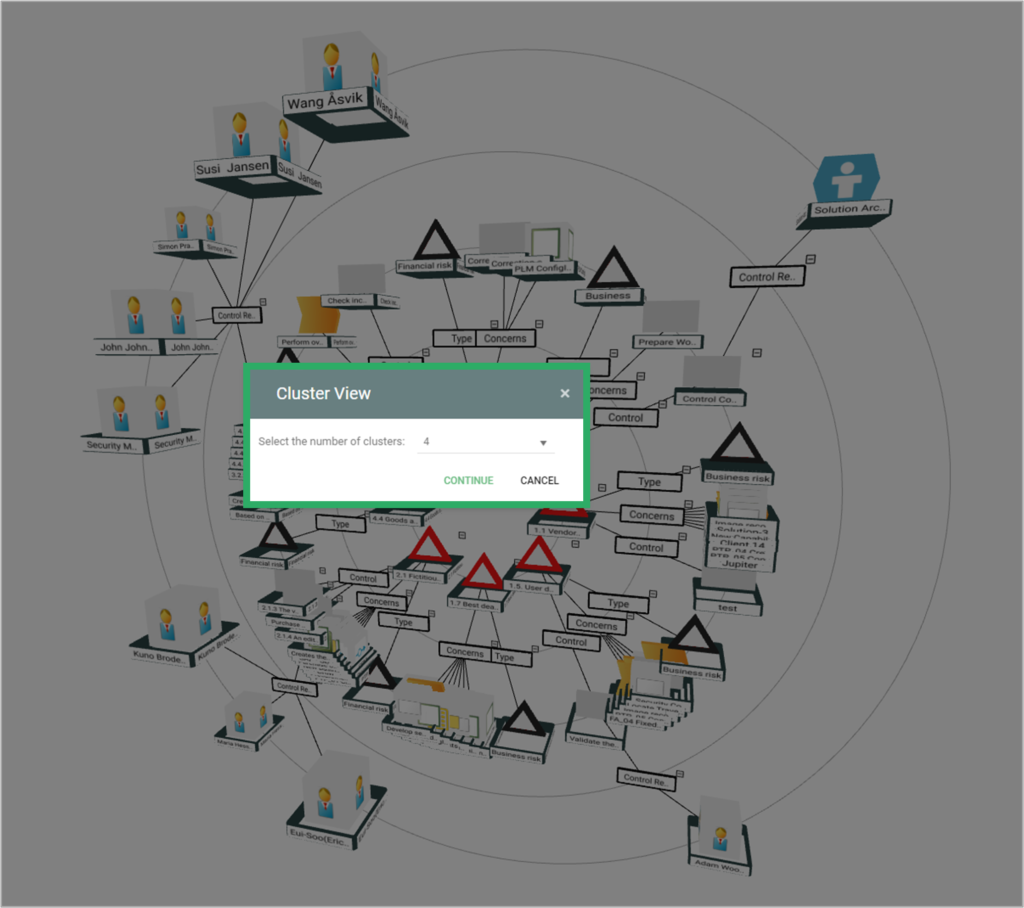
Increasing the number of clusters will generate a more segmented view of the data (the default number of clusters is 4). Once a desired number of clusters has been entered, selecting continue will generate the cluster.
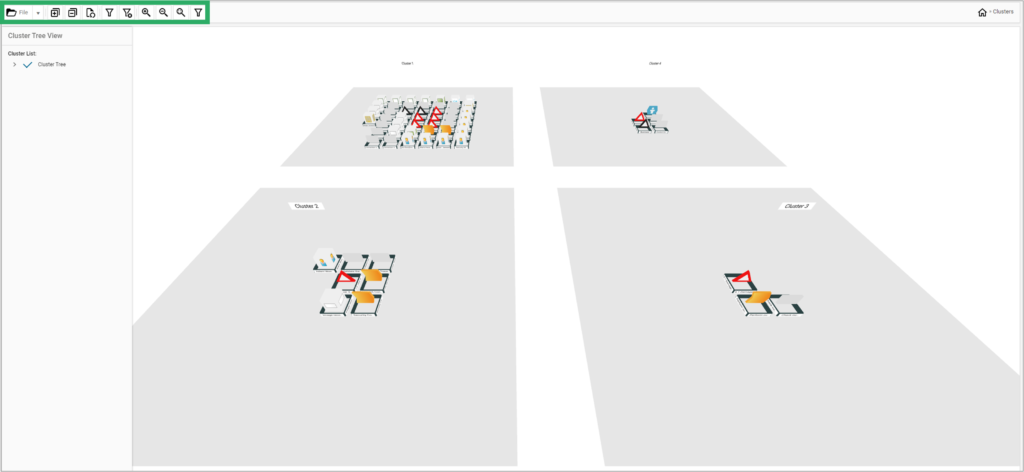
The clusters that are generated follow the same navigation principles and actions as the 3D visualizer. The camera can be panned, zoomed, elevated, and rotated.
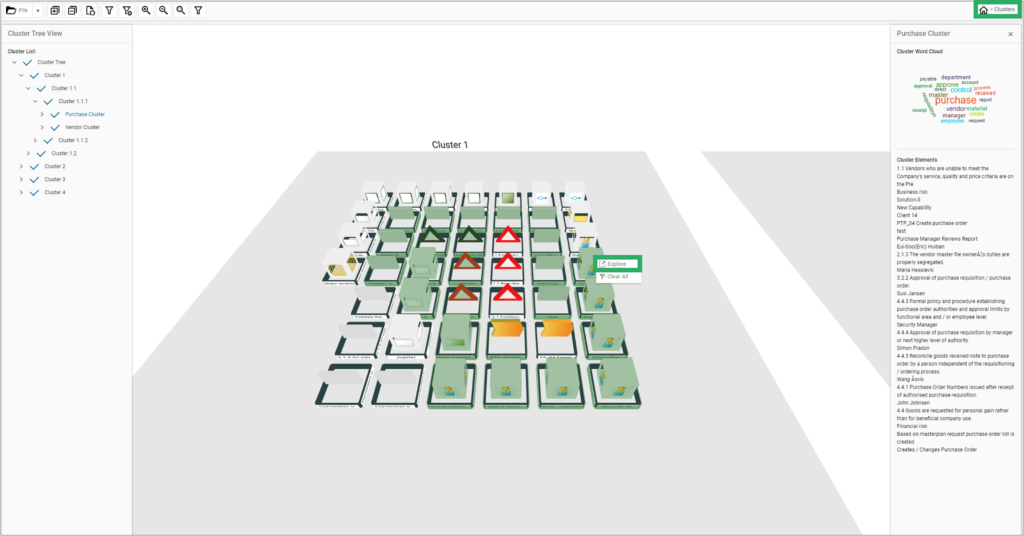
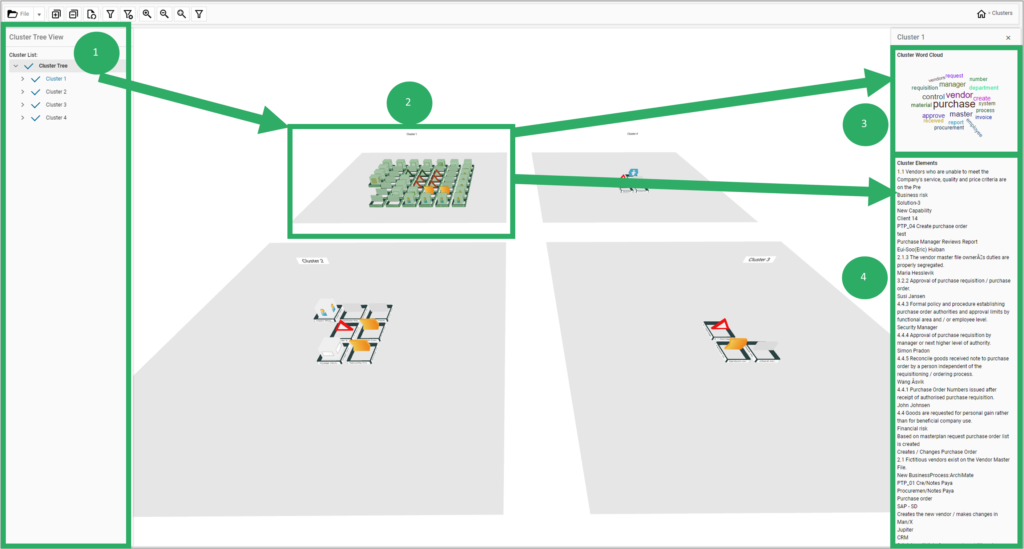
The Cluster Tree View (1) on the left of the screen is a new navigation structure that facilitates interaction with the grouped objects that form their respective clusters. As the cluster list is expanded, the numbered clusters are listed. Selecting a cluster highlights the associated objects (2) and presents a Cluster Word Cloud (3) to the right of the navigation window. The Cluster Word Cloud is a weighted representation of the concepts within the cluster, with the weighting implied by the word’s size and its proximity to the center.
In this example, Cluster 1 is dominated by the concepts of “purchase” and “vendor”, and all the other words in the word cloud are logically related to those concepts. Below the Cluster Word Cloud, a comprehensive list of Cluster Elements (4) is listed. These Cluster Elements list the actual objects evaluated when generating the word cloud
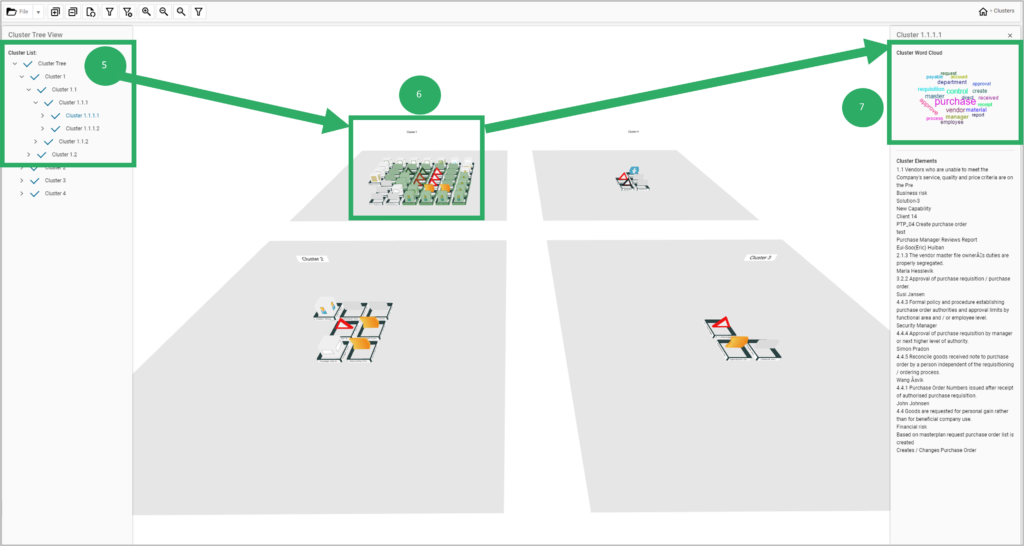
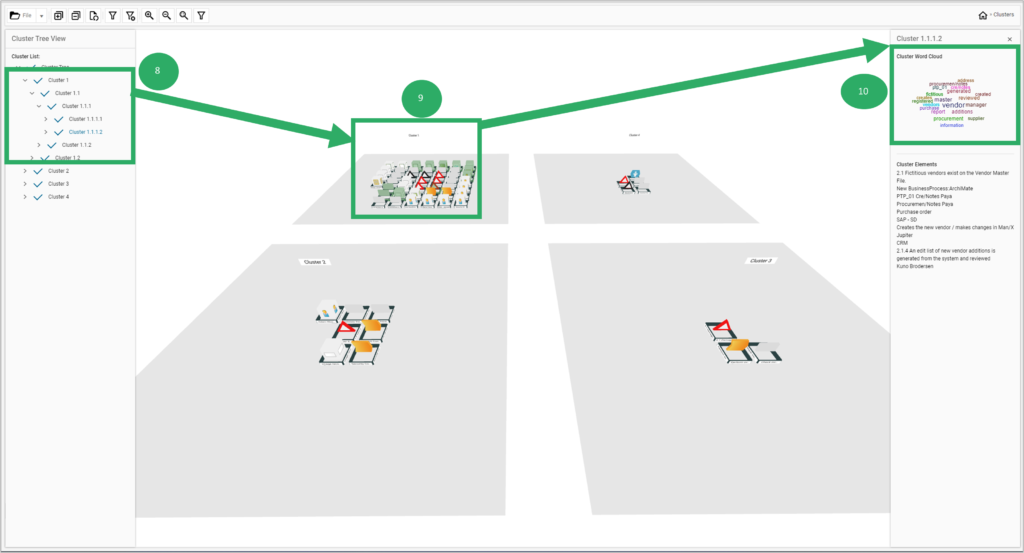
Expanding the Cluster List allows you to decompose a cluster into smaller clusters. As an example, having determined that Cluster 1 is dominated by the concepts of “purchase” and “vendor”, this can be evidenced by expanding cluster 1 into 1.1.1.1 (5) and 1.1.1.2 (8). The highlighted objects in the cluster change depending on which sub-cluster is selected. (6), (9)
The word cloud for each of these sub-clusters indeed clearly shows the focused view of “purchase” (7) and “vendor” (10). This enables the creator of the cluster to focus analysis efforts on those two concepts without manually considering the relationships between objects & concepts.
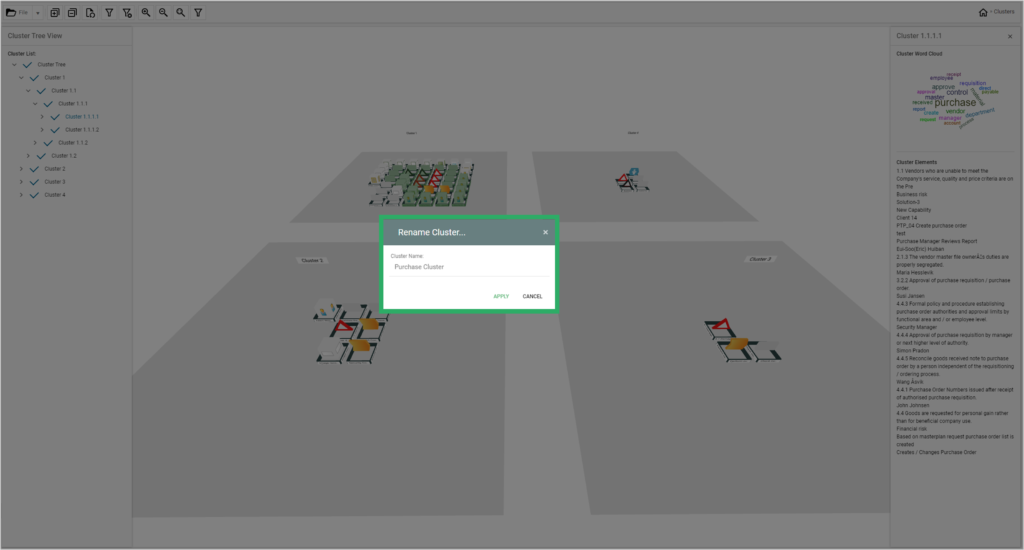
Having identified suitable candidates for further consideration, each cluster can be renamed by right-clicking the cluster in the cluster list and selecting “rename”. For this example, Cluster 1.1.1.1 will now be the Purchase Cluster (11), and 1.1.1.2 will be the Vendor Cluster (12).
Right-clicking a cluster and selecting “open” will open the cluster item list (13). From the cluster item list, the cluster can be associated with other objects or object groupings by using the hashtag feature.
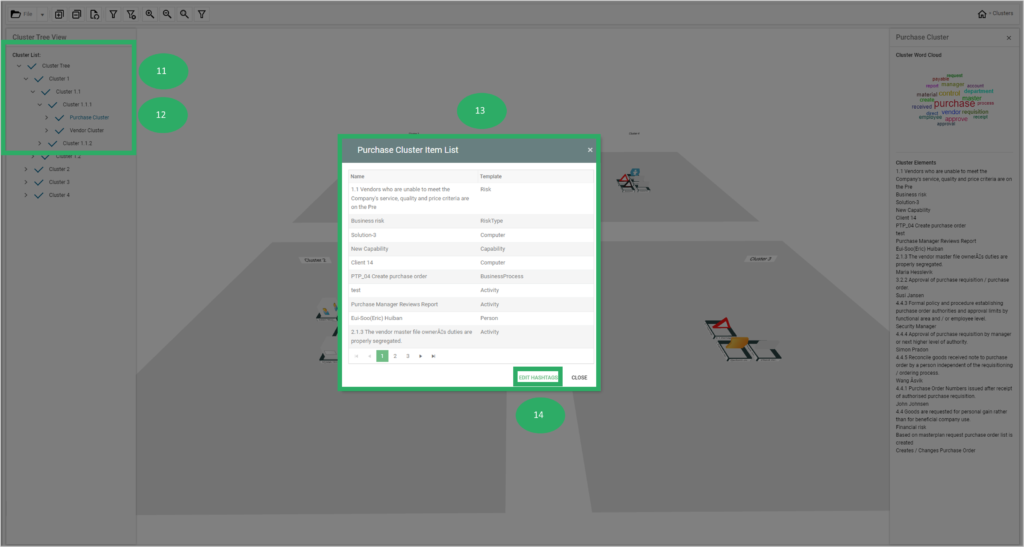
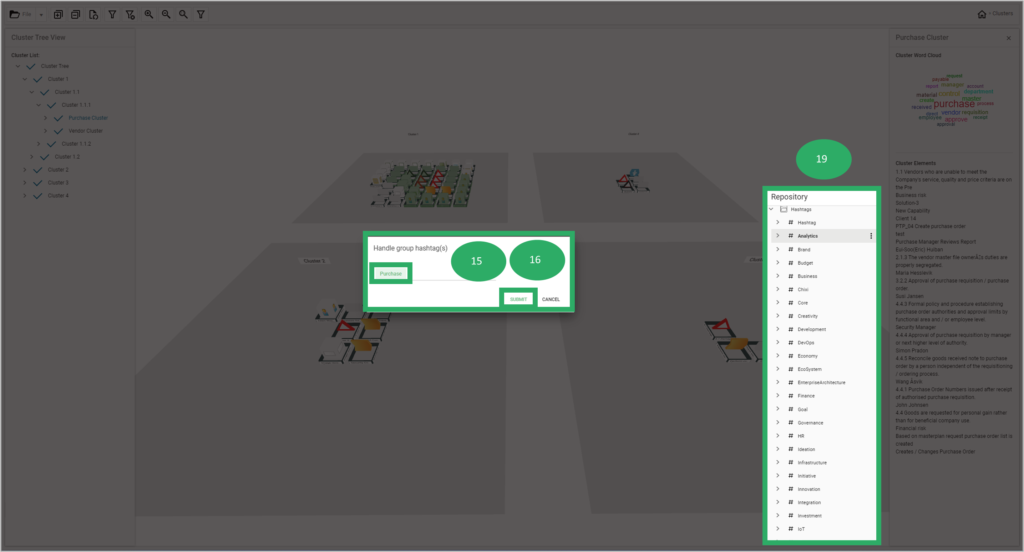
By selecting the “Edit Hashtag” button (14), a dialogue is shown that will display existing hashtags based on what is entered (15). If no existing hashtag exists, then a new hashtag can be created by selecting “create” (16). A cluster can be assigned to more than one hashtag if necessary. Once the hashtag has been created, clicking submit will assign the hashtag to all the objects. A folder will be created in the repository explorer (19) for further consideration or analysis.
Finally, as previously mentioned, objects can also be explored the same way as in the 3D visualizer by right-clicking an object and selecting explore (17). This will change the view to display the information flows and forward and backward relations of the selected object. From this view, the “Clusters” (18) button at the top right corner of the screen can be selected to return to the original cluster view. These steps enable users to analyze the clusters and leverage new possibilities by grouping clustered objects through hash tagging.
