Video Highlight
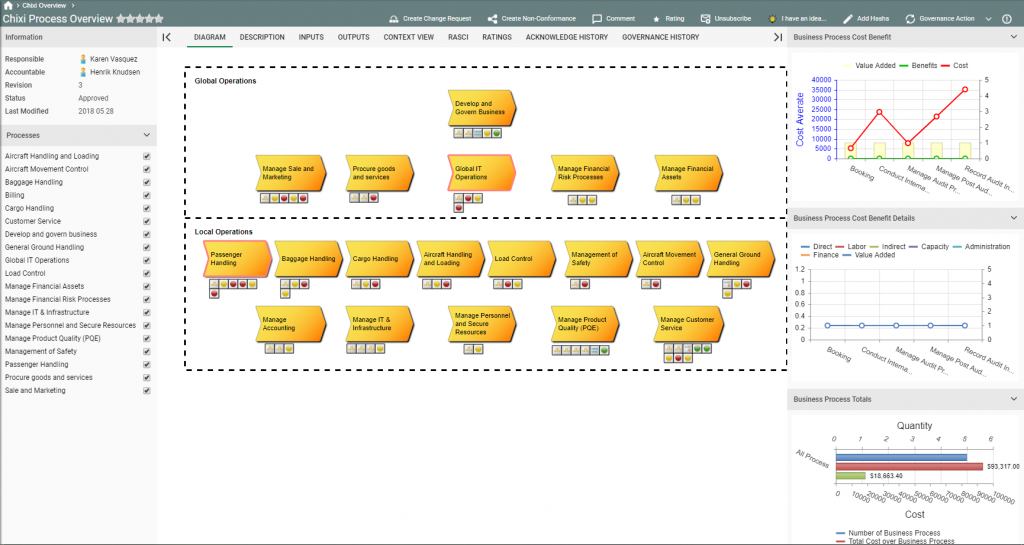
QualiWare X enables the use of dynamic charts. Dynamic charts retain the functionality previously present in charts with the added benefit of up to 4x faster loading speeds and interactivity such as for example the ability to toggle data series by clicking on them directly from the chart on the web.

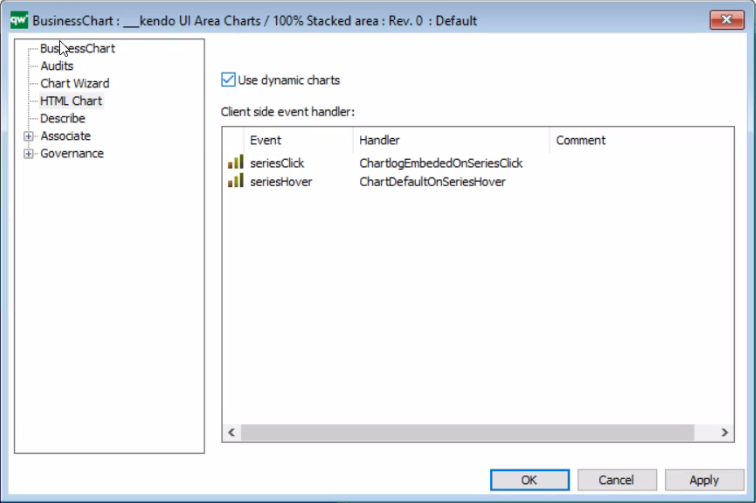
Dynamic Charts are enabled by default for all new BusinessCharts created in QualiWare X. To convert existing charts to Dynamic Charts set a check-mark in “Use dynamic charts” for a BusinessChart on the new tab called HTML Chart.

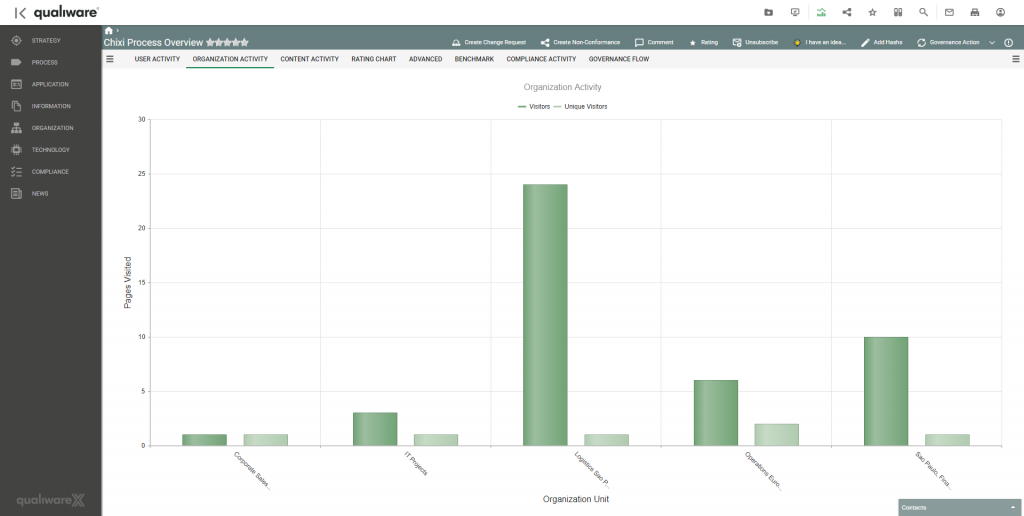
Besides BusinessCharts, the dynamic charts also apply to the graphs that are shown when Analytics / SocialBehaviorWarehouse is accessed via the “Analytics” icon in the upper right menu toolbar.

QualiWare X also introduces gauges in the form of the object BusinessGauge that can be inserted into the Center section of a TemplateDefinition. Gauges can for example show the performance or economics of a process in the form of several pre-determined graphical elements.

