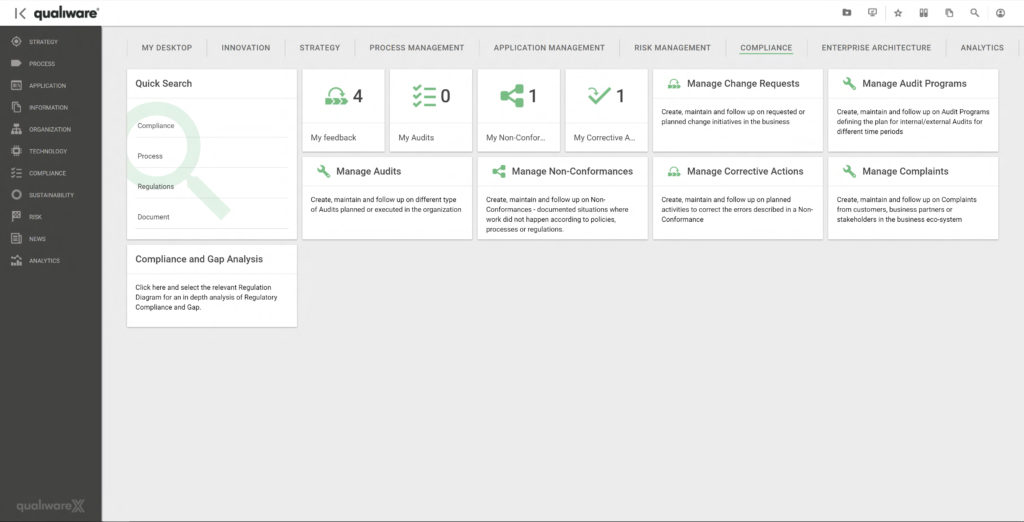
New Compliance Desktop
The tile “Compliance and Gap Analysis” provides access to the list of Regulation Diagrams in the repository. The Regulation Diagram allows the user to create a diagram containing the relevant regulation for a specific purpose. This may be the entire set of clauses in an ISO standard, or it may be a selected set of regulations that the business needs to document compliance towards.
When a Regulation Diagram is selected in the list, the tool does not show a diagram. Instead, two analysis tabs with compliance analysis and gap analysis are available. The Compliance Analysis looks like this:
The left part of the compliance analysis lists the objects complying with a regulation. If compliance is missing, the Complying object part of a row will be empty. The right part of the analysis details the audits that have been executed with focus on the complying objects. This way, the auditor can easily find the validation of a compliance.
The gap analysis includes the same left part as the compliance analysis, but the right part shows a list of Change Requests defined for the complying objects:
With this analysis, it is easy to see which changes are required to reach the desired level of compliance.
The Compliance Desktop includes tiles for managing Change Requests, Audit Programs, Quality Audits, Non-conformances, Corrective Actions, and Complaints.
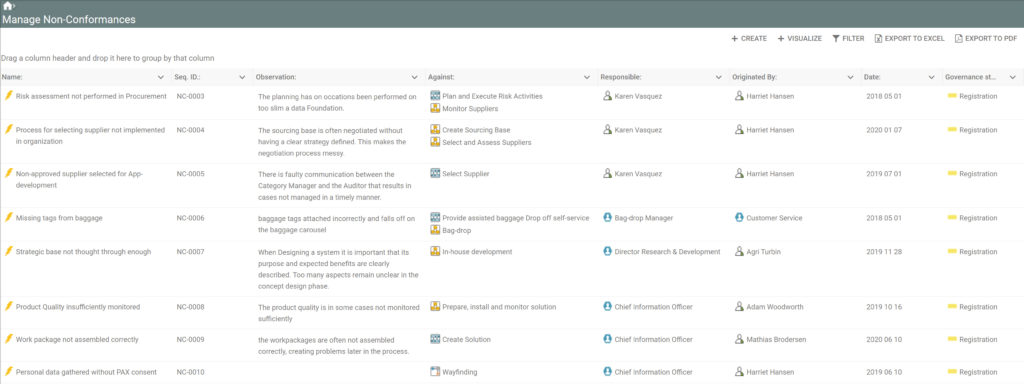
All tiles provide a list of objects of the selected type similar to the list of Non-conformances shown below:
From the list it is possible to click the Non-conformance link in order to describe the Non-conformance further or to move it forward in the governance process.
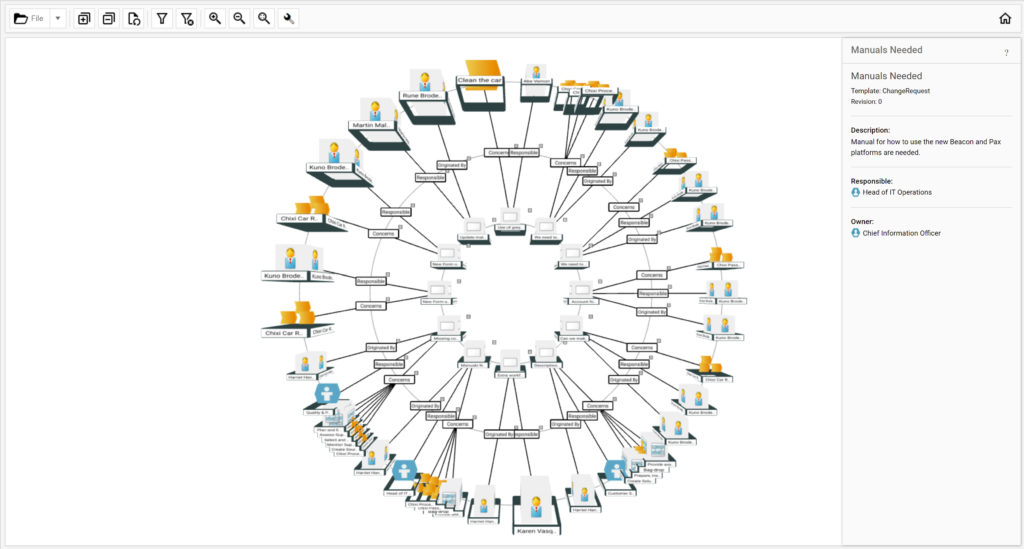
It is also possible to create a new Non-conformance or to get a 3D visualization of the context of the Non-conformances.
The list for Audit Programs also shows the audits planned as part of the program:
If the Audit Program is opened, an extra tab showing a Gantt view of the Audit Program appears.
If the audit is planned for a specific date, a milestone diamond will be shown. If the audit is scheduled within a range of dates, a line will appear.
New Visualizer Functionality
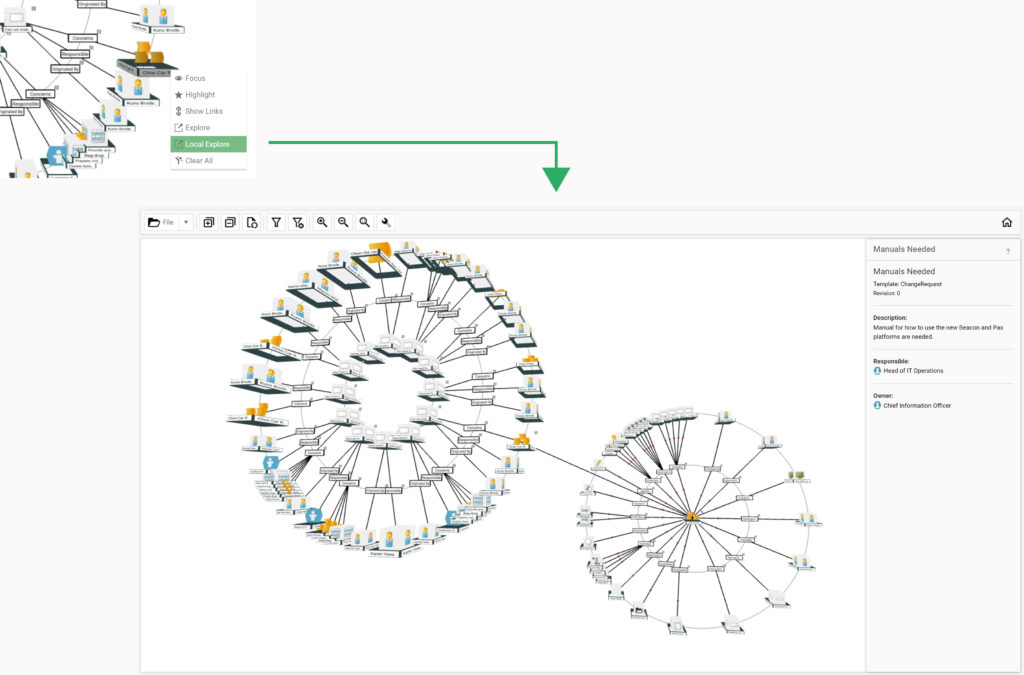
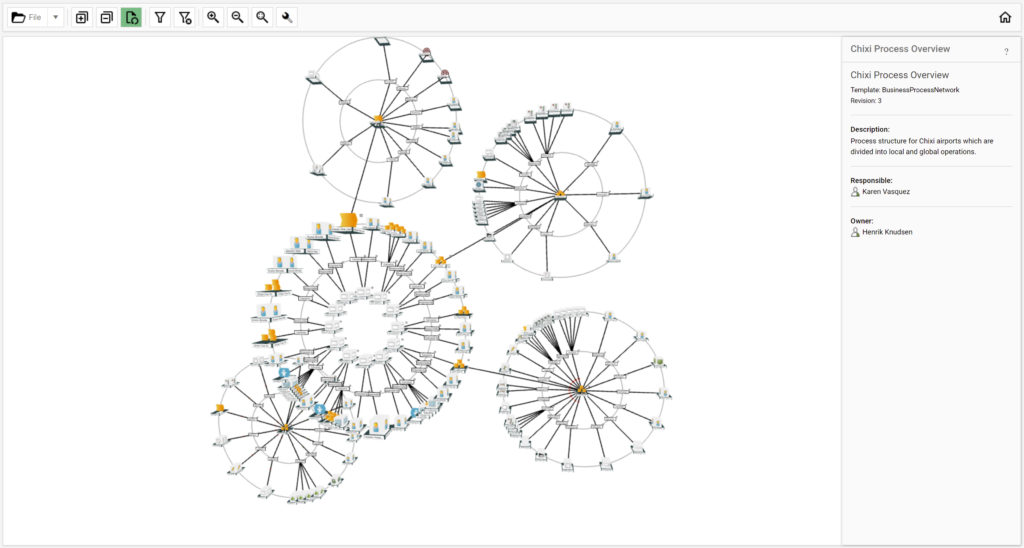
It is now possible to right-click a symbol and select “Local Explore” to open up a new context in the same view:
In other words, if you have a Change Request that concerns a specific process or application, it is now possible to see the consequence of the change as well as the components that can become part of the change.
It is also possible to open multiple “Local Explore” in the same view.
You can toggle a local explore by double-clicking the exploded symbol.
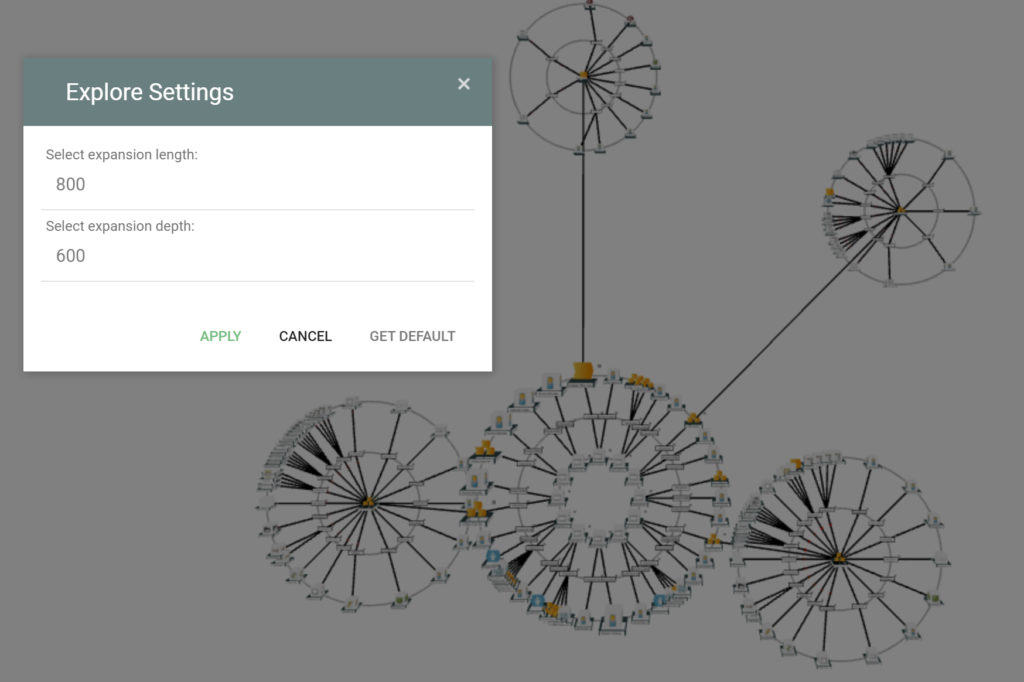
By setting the Expansion length and depth, the placement of the local explore context can be adjusted:
Composite Query Design
Composite Query Design takes report generation to a new level. Further to retrieving and presenting your data, the Composite Query Designer allows you to use data from internal or external databases to calculate and make statistics, aggregate values or apply functions of various kinds to the data and present it in various contexts for different stakeholders.
Composite queries are based on the results from a QSQL-query (fetching date from the QualiWare repository) or an SQL-query (fetching data from an external SQL datasource).
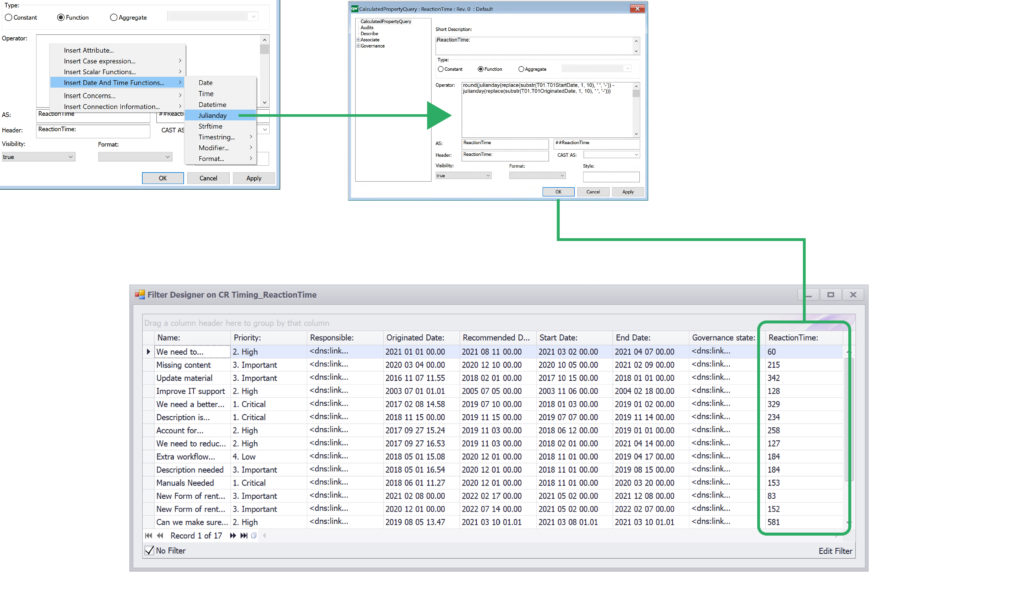
A QSQL-query can fetch data from the QualiWare repository but cannot perform calculations and aggregations on that data. A composite query can be created directly from the QSQL-query design and include a mix of base repository data and calculated attributes.
The calculated attribute can be either a constant, a function (working on data in a result-row), or an aggregated function (working on data in a result-column).
A right-click menu assists you in creating the correct function.
The results may be used in Query Result Views, Spreadsheets, Reports, Business Charts, etc. With these features, it has become even easier to create advanced calculations and statistics and present these to the relevant user.
Examples are included in the standard publisher export file. The is also a video available with more details.
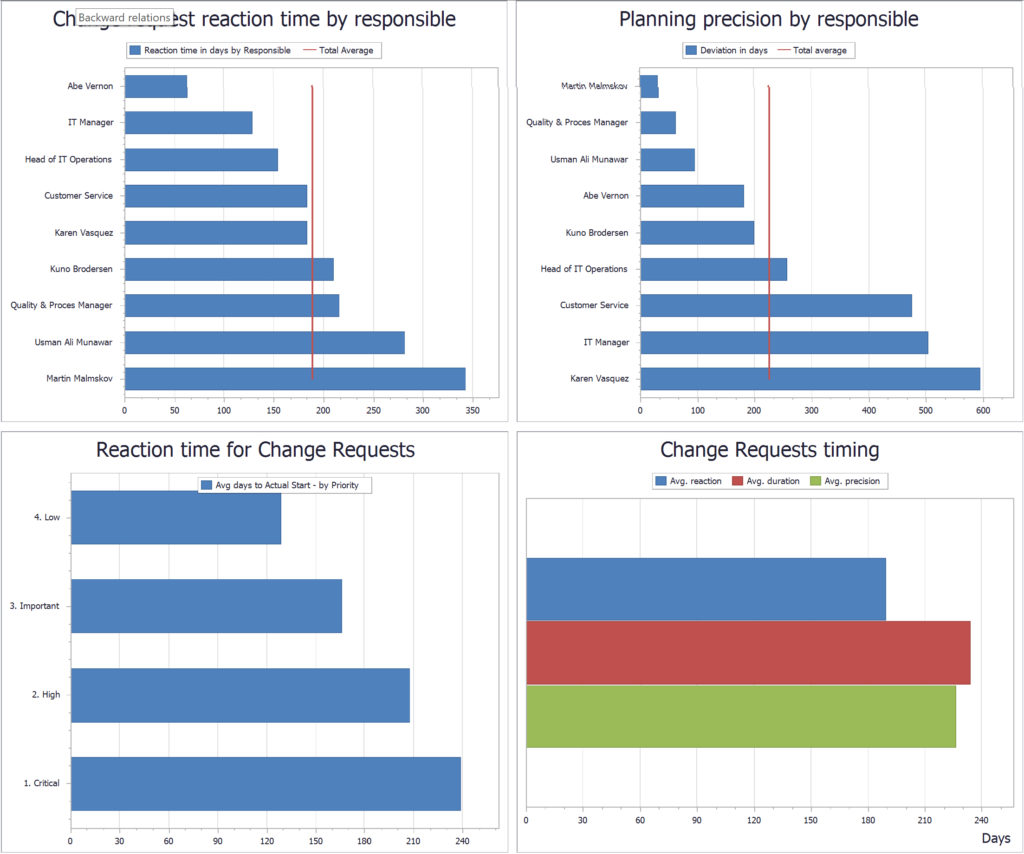
Below is a set of business charts based on data from a set of Change Requests followed by calculations and aggregations using composite queries.
The new Query Design for Composite queries supports the following major features: CASE, JOIN, UNION, GROUP BY and many scalar and aggregate functions.
Changes to the web-modeler
Changes to label placement has been implemented. There may still be minor differences between the positon of a label in the web-modeler and the windows based diagram editor.
Handling of multiple labels.
Changes to colors and label fonts are now saved and recognized in the windows diagram editor.
Synchronization of connection types between QLM and web-modeler.
Support for button panels.
General Changes
2. Several performance improvements have been implemented.
3. QEF and QIS Repository Administrator logging has been extended to support logging of changes to users, groups, permissions, etc.
4. It is now possible to move a web-form. Click and drag the form to another location and release to place the form.
5. The previous tree-view component used by the publisher has been changed to the Kendo-UI Tree-view component for consistency reasons.
6. Minor security fixes have been included in this release.
7. Query Result Views that are based on a Generic Query can now have the 3D visualization option enabled.
8. A new analysis, “BIA – Resilience responsibilities,” has been added to the Business continuity features. This list extracts and presents all responsibilities related to the Business Continuity Resilience.
9. Score button panels for Capabilities and Information Systems now only show up in Business Capability Models and Application Architecture Diagrams, respectively
10. Using the automatic upgrade will convert the use of “sys-Id” to using “HyperName” instead. This will only change the QueryDesigns. However, the queries will be re-generated, so any previous changes made to the generated QSQL will be lost. Please remember to take a backup and always test your solution in a test environment before moving it to production.
