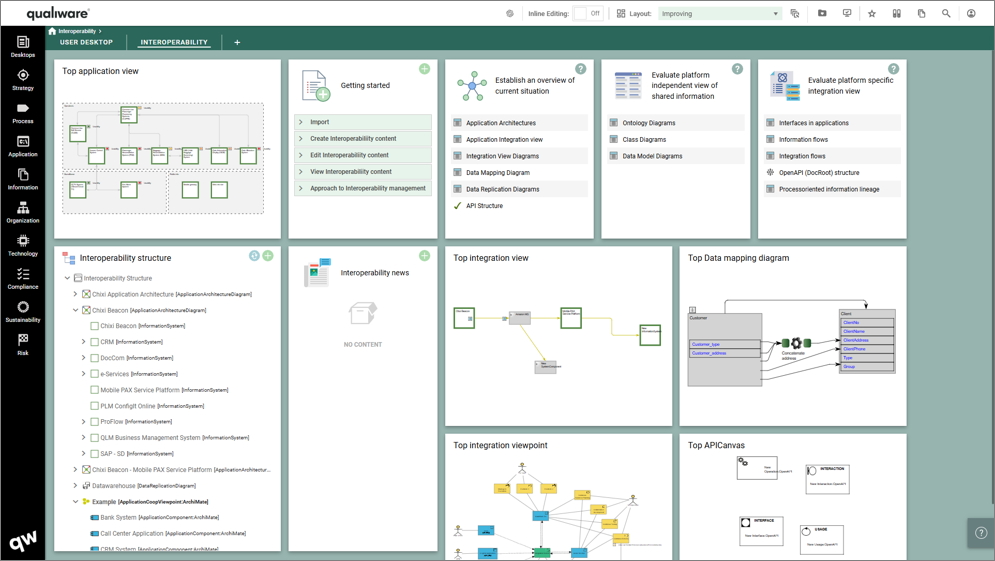
Being on the Interoperability Desktop – Architects and Business Users of the organization can define the application integration including the Integration Vies, the data mapping and the API structures. Build a platform independent view of the knowledge shared across application. Maintain a process-oriented information lineage across the integrations.
With rapid development in the digital and physical world orgarnizations needs to stary flexible. By having an overview and understand how different applications integrate the Interoperability Desktops enables the organizations to make quick changes in its it-landscape.
QualiWare provides features to enable a cohesive understanding of the digital landscape the organization exist in from data mapping to how applications integrate with each other.
Desktop Journey
With QualiWare’s purpose driven desktops, users are enabled to have centralized workspaces for each area within the QualiWare Enterprise Architecture and GRC platform. Doing so allows users to use preconfigured reports and dashboards as they populate their repositories and start on their respective journeys. The journeys all carry a methodology of Plan, Do, Check, Act which encapsules:
- Getting Started for content creation, and import of data
- Overview for establishing overview and maintaining relationships
- Evaluate for analyzing the content from different perspectives
- Planning, communication and review for creating change initiatives, tracking and implementing change
Getting started
Each Desktop has a “Getting Started” tile that provides easy access to the most relevant features in relation to the focus on the desktop.


Establish an overview of current situation
- Define, analyze and review the business applications. Get an overview of applications at all levels of details and how they share information.
- Establish a view of how information is transported and manipulated through the business and the different applications.
- Allow stakeholder and employees to provide feedback such as Change Requests and good ideas, and allow for registration of problems of any kind (incidents, accidents, non-conformances etc.
Evaluate platform independent view of shared information
- Ontology Diagrams define the relationships and hierarchies between different concepts within a domain. Use this to ensure that the data is understood consistently across different platforms and systems.
- Class Diagrams and Data Model Diagrams are used to ensure that the data is organized in a way that supports integration and interoperability across different systems.
By combining these three types of diagrams, you can create a comprehensive and platform-independent layer of information integration. Together, they ensure that the data is consistently understood, structured, and integrated across different platforms and systems.


Evaluate platform specific integration view
- By combining application interfaces, information flows and OpenAPI definitions, you can create a comprehensive and platform-dependent layer of information integration.
- Application interfaces provide the communication channels, information flows map out the data movement, and OpenAPI definitions standardize the API documentation.
Together, they ensure that the data is consistently and accurately integrated across different platforms and systems.
Read more about the Desktops
Explore the general introduction to desktops using the links: