Create a Query Design
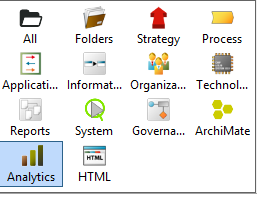
Click on Analytics in Repository View
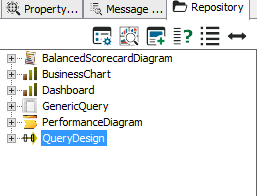
Click on QueryDesign
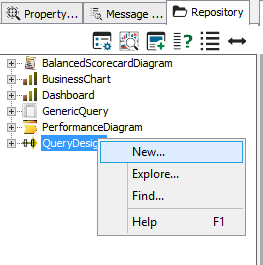
Right Click on QueryDesign and Select New and Name it as Maria vs Oracle
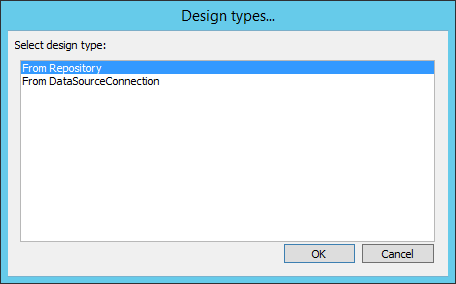
Double Click Maria vs Oracle Query Design and below window will appear. Select From Repository and Click OK
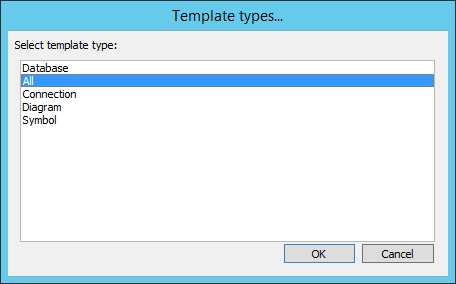
Select All and Click OK
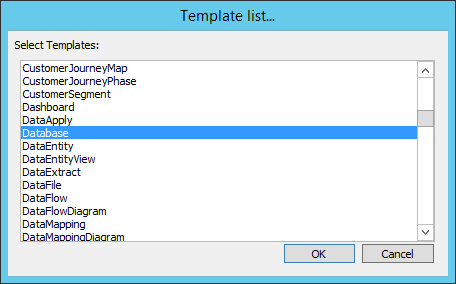
Select Database and click OK
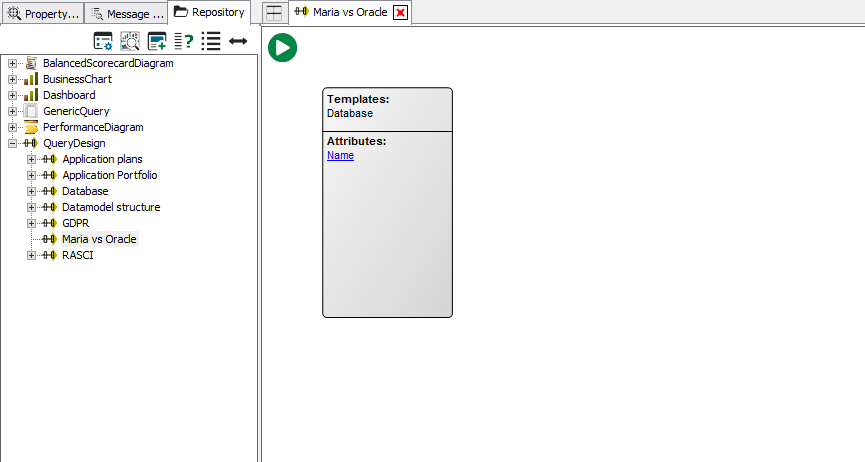
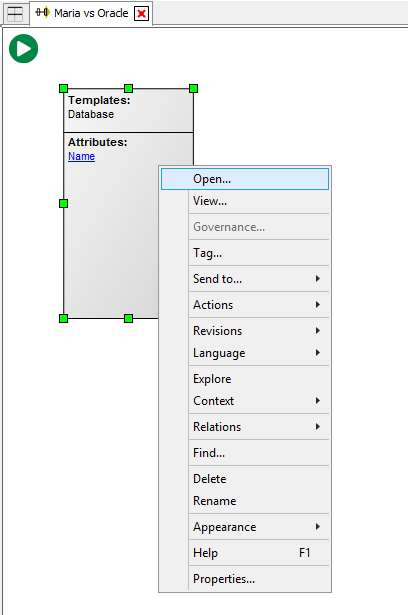
It will appear like below
Right Click and Open Object
Go to Property Attribute
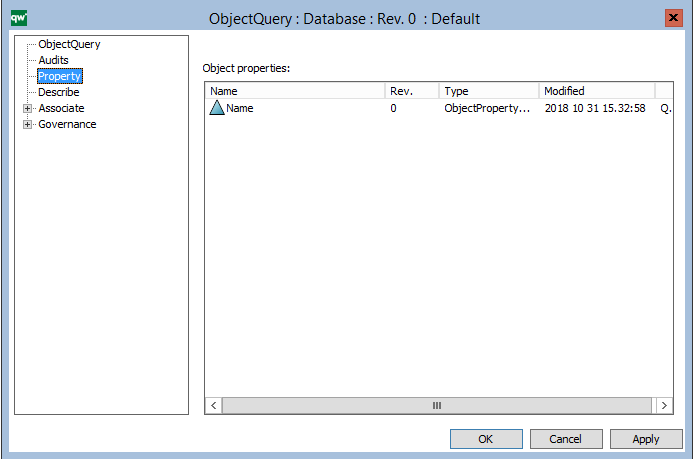
Right Click inside Object Properties and Click Insert
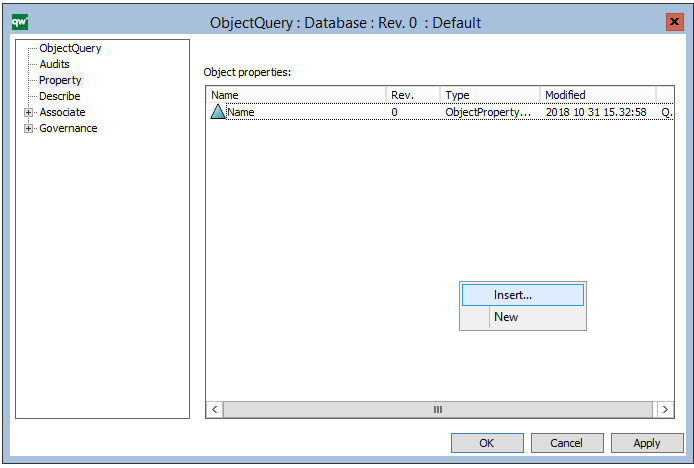
Select all the custom Attributes added such as Subscription, License and Maintenance. Hold CTRL button and select the attributes from List and Click OK.
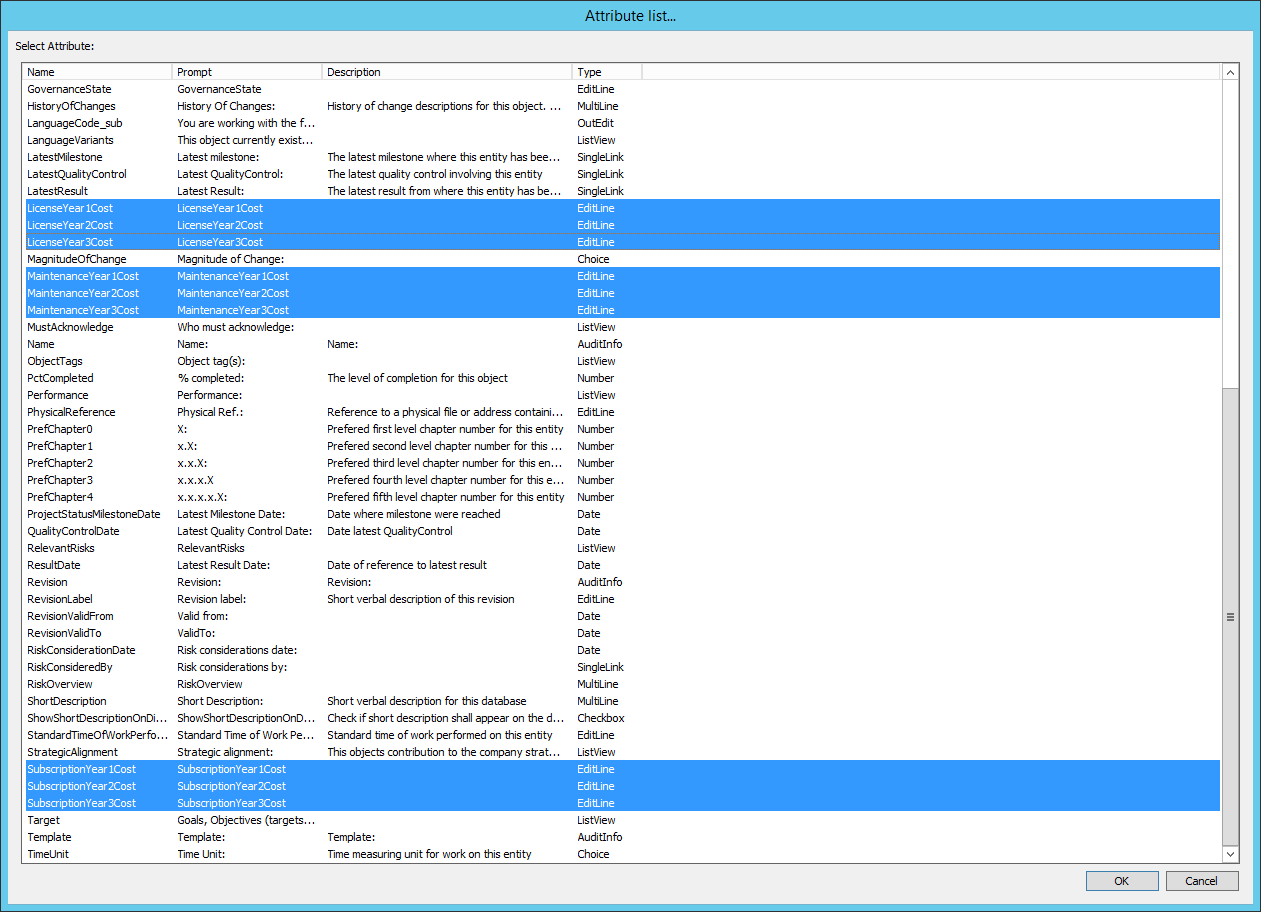
Click OK
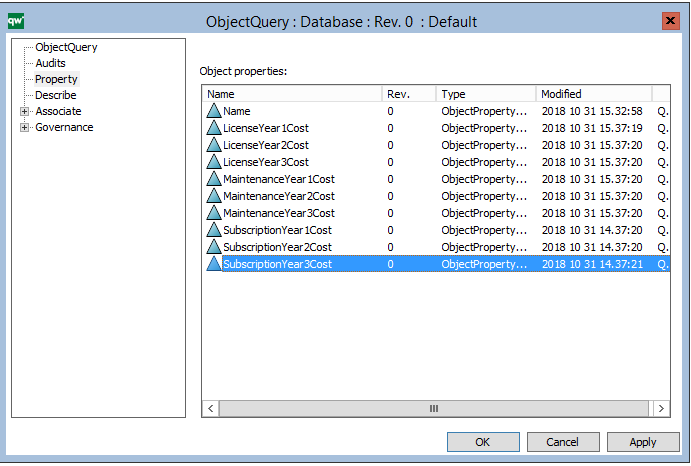
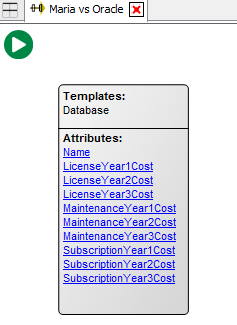
It will look like this.
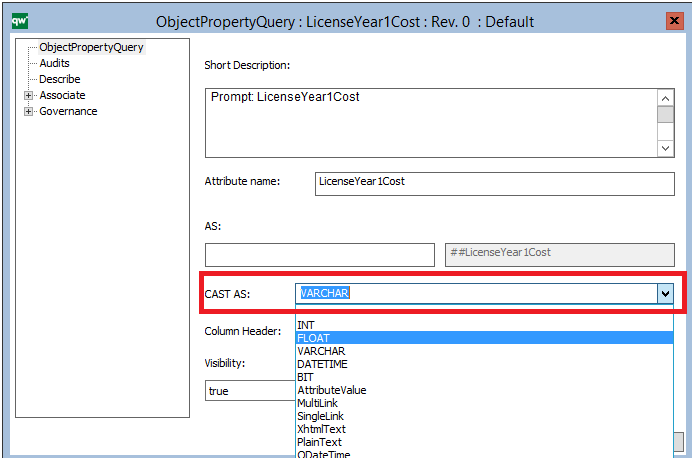
Click on each individual Attributes such as LicensesYear1Cost and change following CAST AS: from VARCHAR to FLOAT. Please apply these to all Attributes except Name.
Once changed Double Click Green Run button
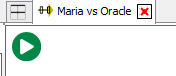
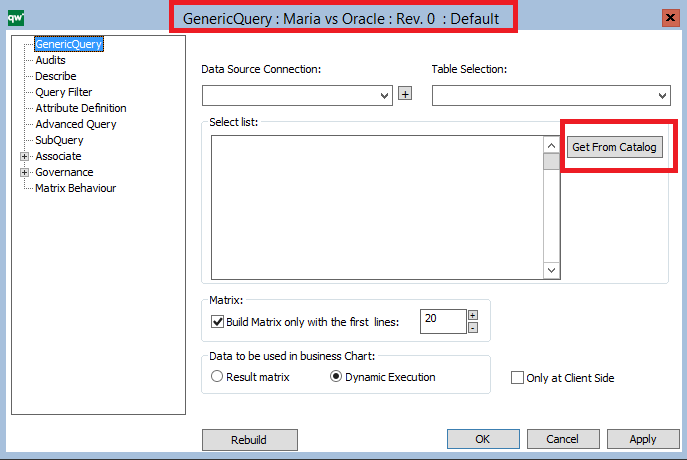
It will create a GenericQuery with same name as below
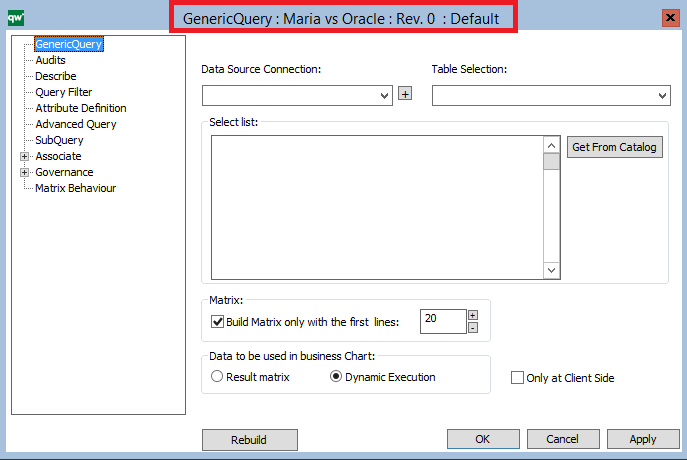
Click on Get From Catalog Button in GenericQuery Attribute
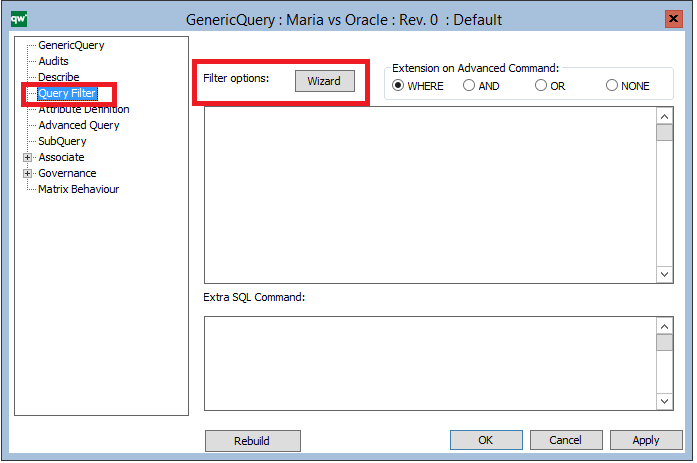
Then go to QueryFilter Attribute and Select Filter options: Wizard button
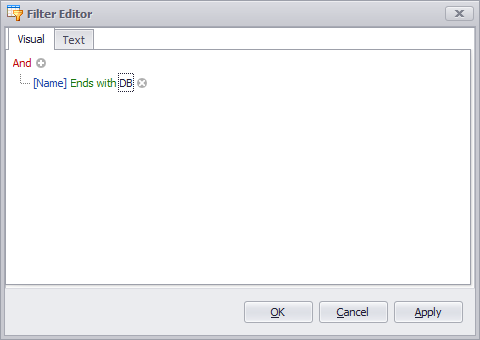
A Filter window will appear. Click on Plus Icon
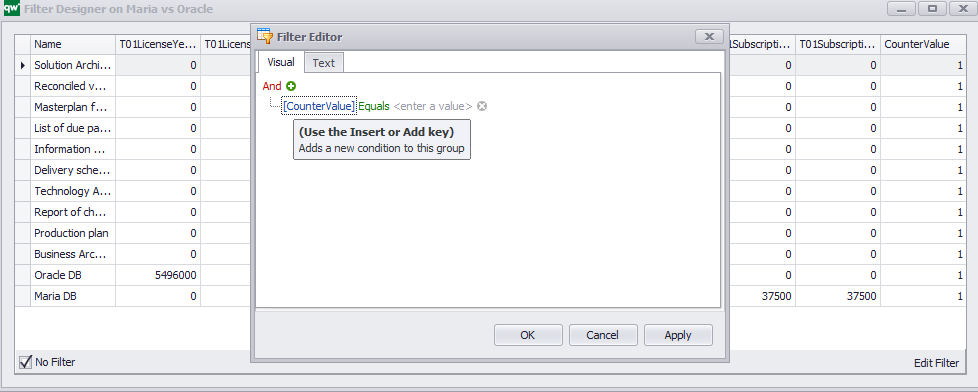
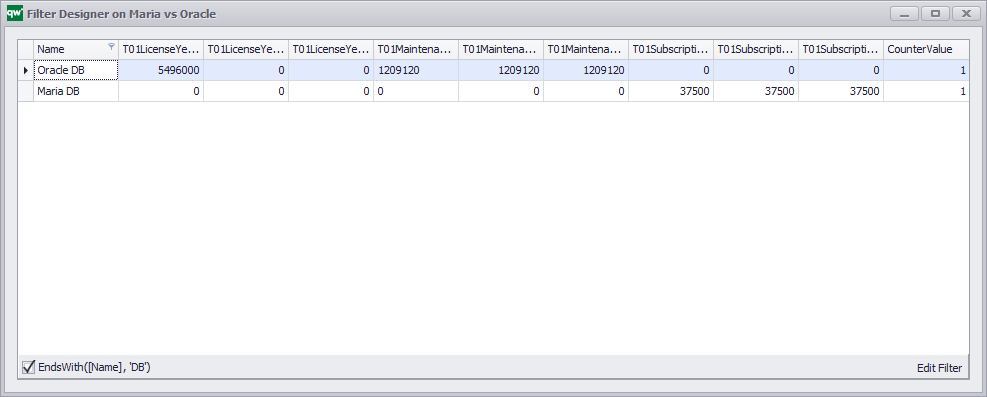
Click on CounterValue and Select Name and perform below actions. Click OK and you will see your filter applied.
Close this Window
Click on Rebuild and Click OK
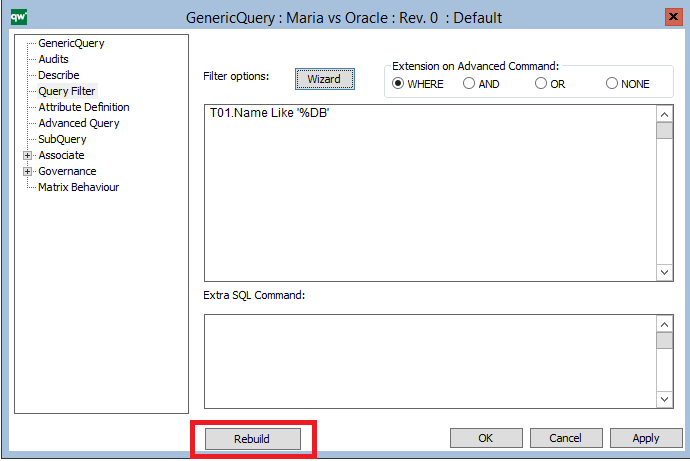
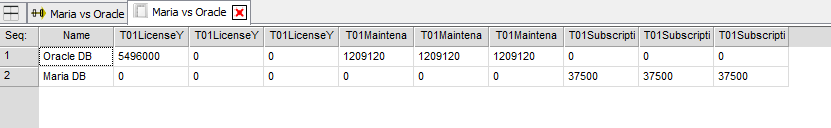
It will Build and Populate the Query
Create a Bar Chart
Select BusinessChart in Repository Explorer
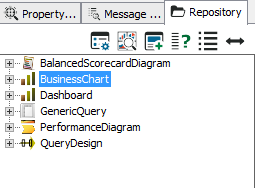
Right click on BusinessChart and Create a New BusinessChart. Name it Maria vs Oracle. Double click the new business chart it will open a blank canvas
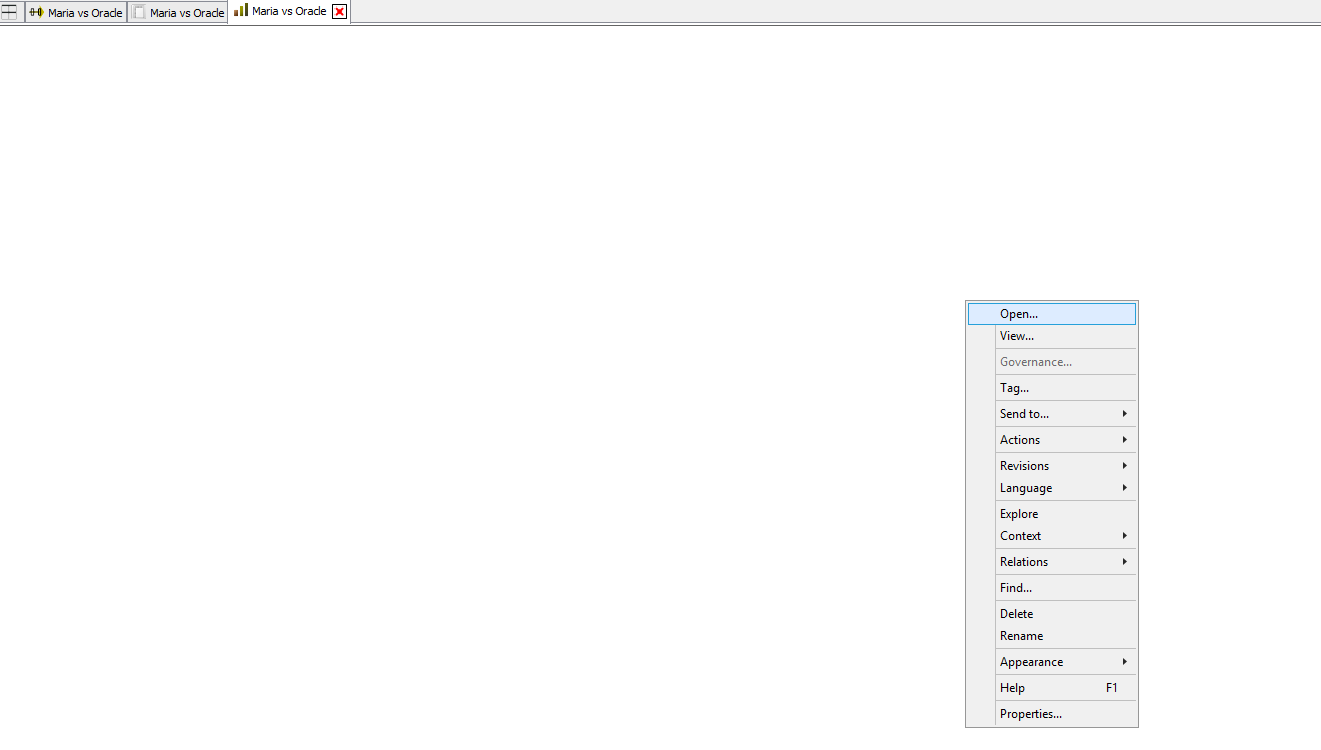
Right Click inside Blank Canvas and Select Open
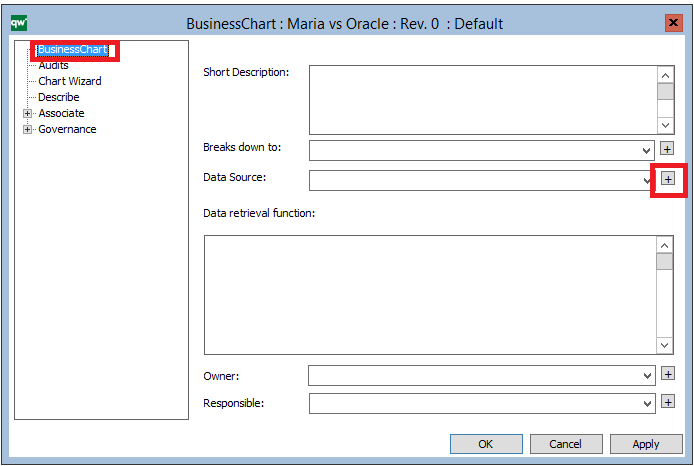
Select a Datasource. Click on + sign
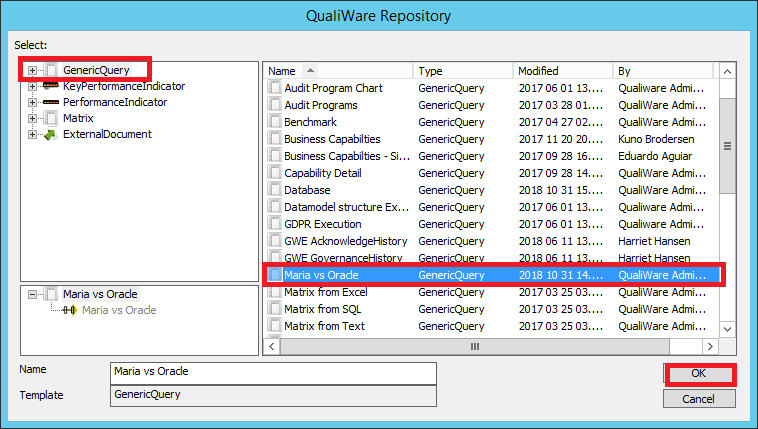
Select GenericQuery and Select Maria vs Oracle. Click OK
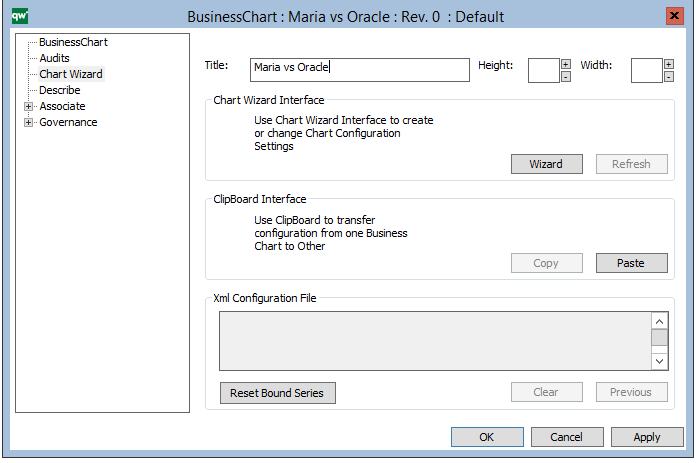
Go to Chart Wizard and Enter Title – Maria vs Oracle
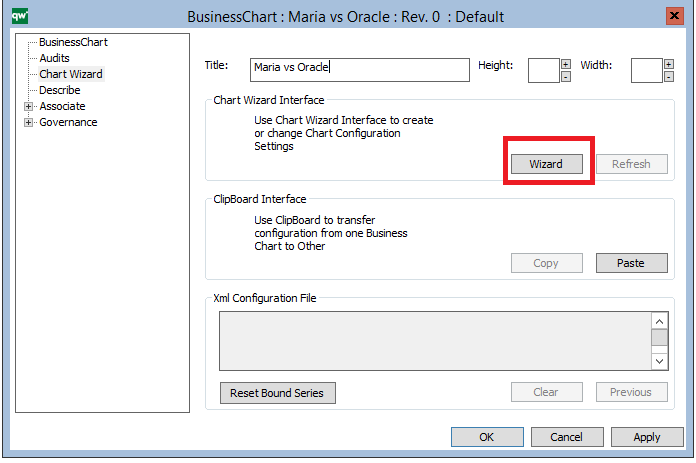
Click on Wizard button
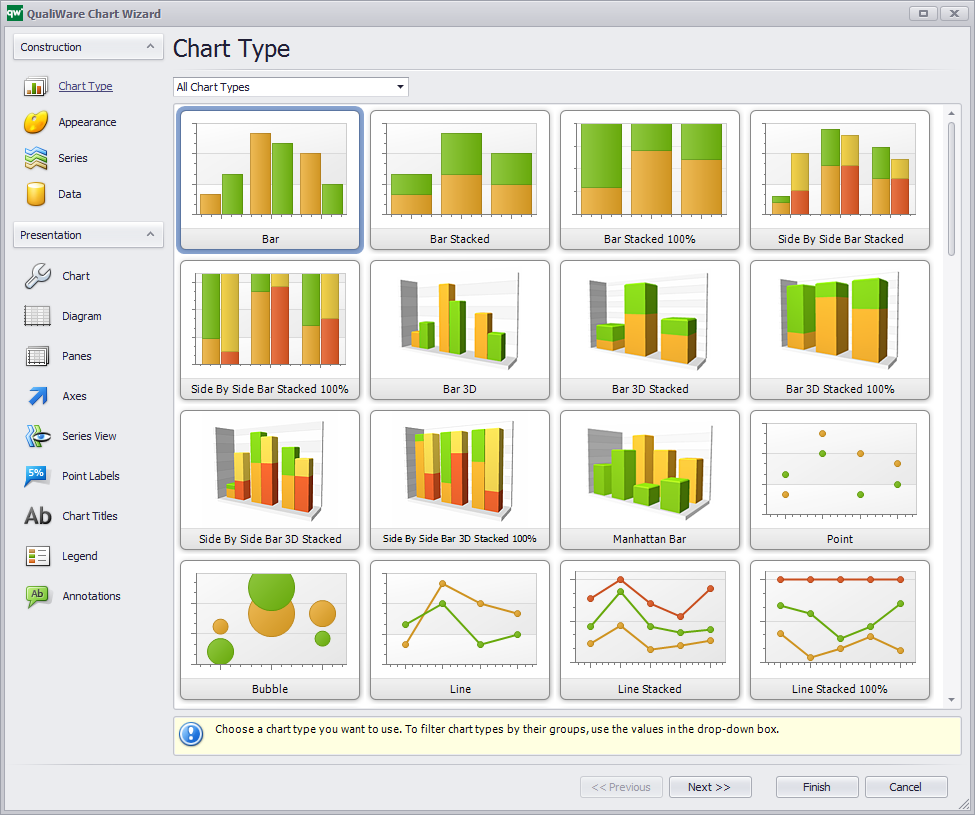
Select Chart Type and Click Next
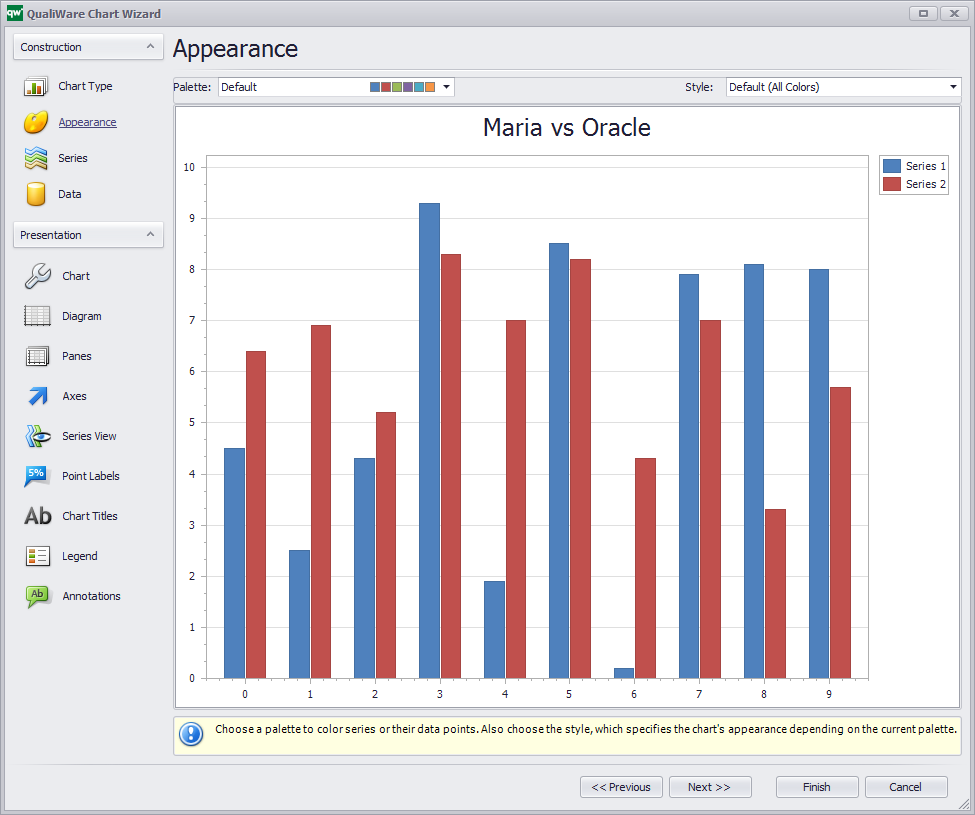
Select Appearance and Click Next
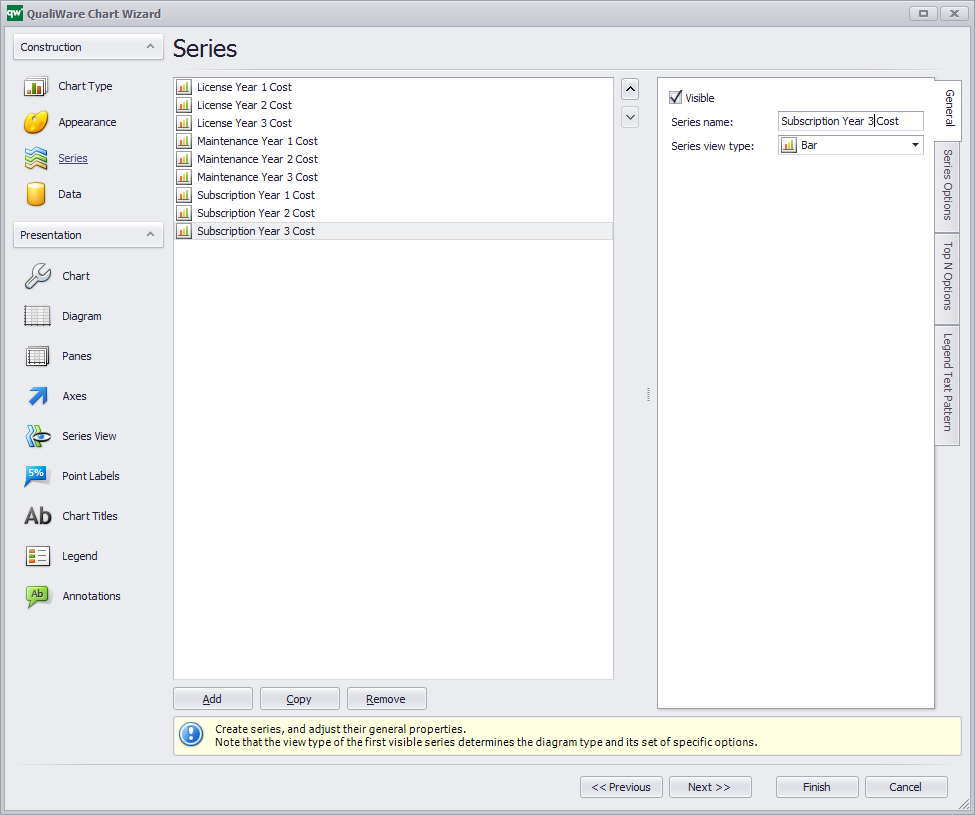
Add and Rename Series
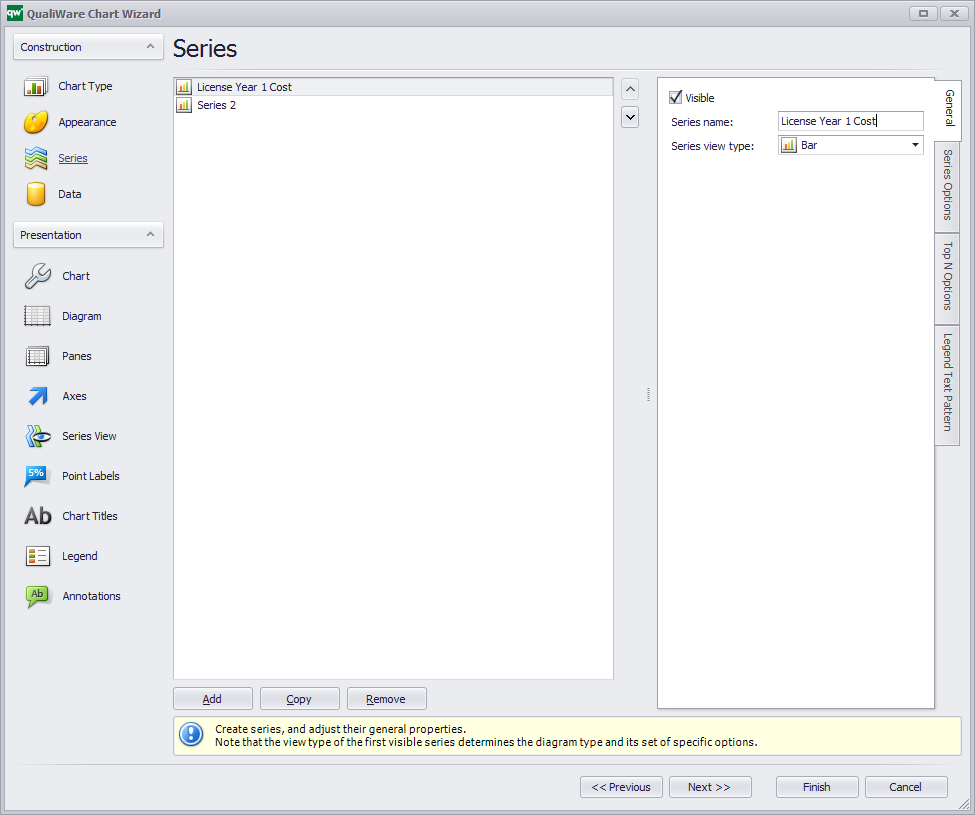
Repeat above steps for all other columns to be added. Click Next
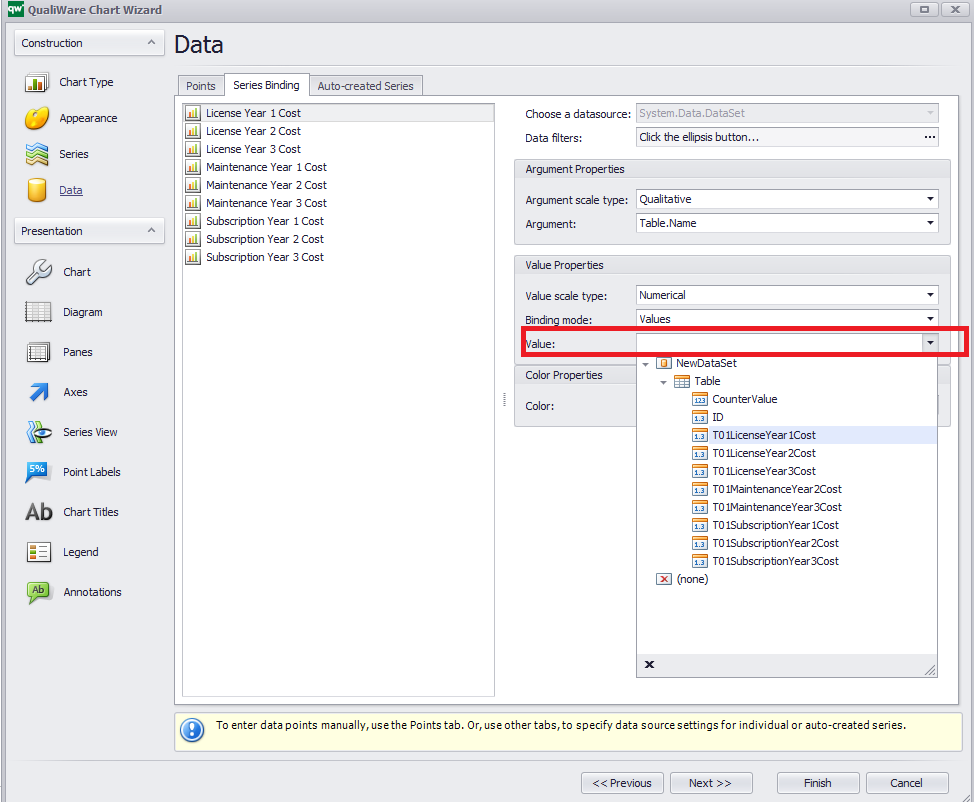
In Data Select Series Binding
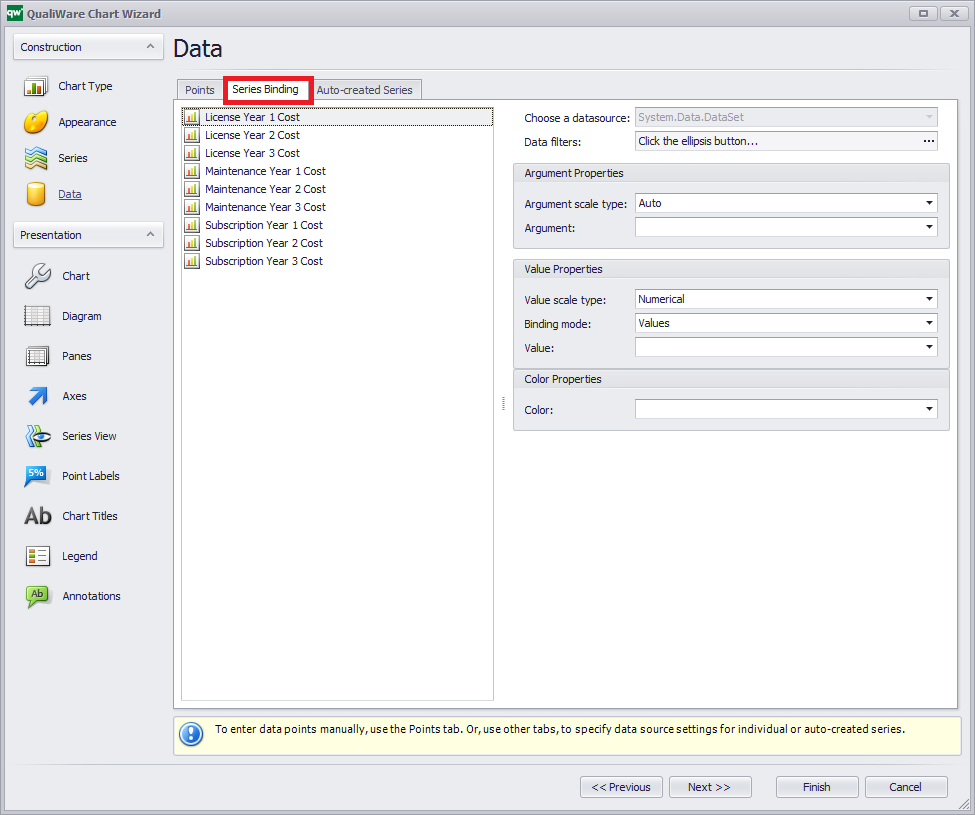
Select License Year 1 Cost and in Argument Select Table.Name
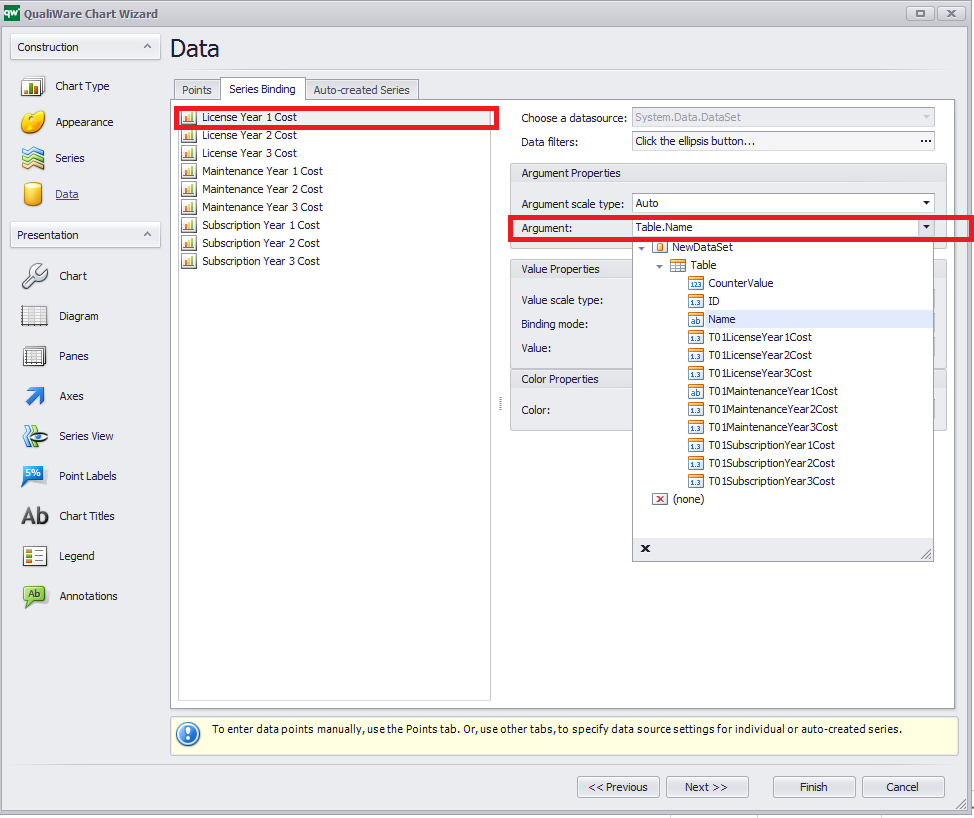
In Value select T01LicenseYear1Cost.
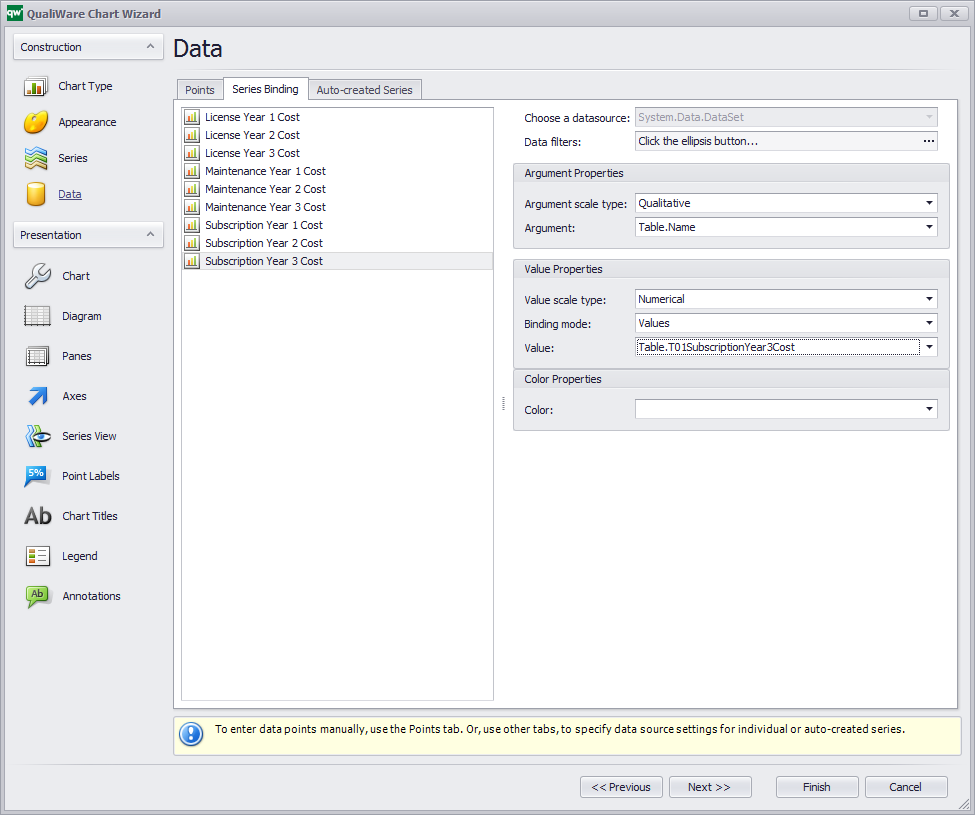
Repeat same steps for all Series. Note: Argument for other Series is same as Name. So please select Name in Argument for all. Once done Click Finish
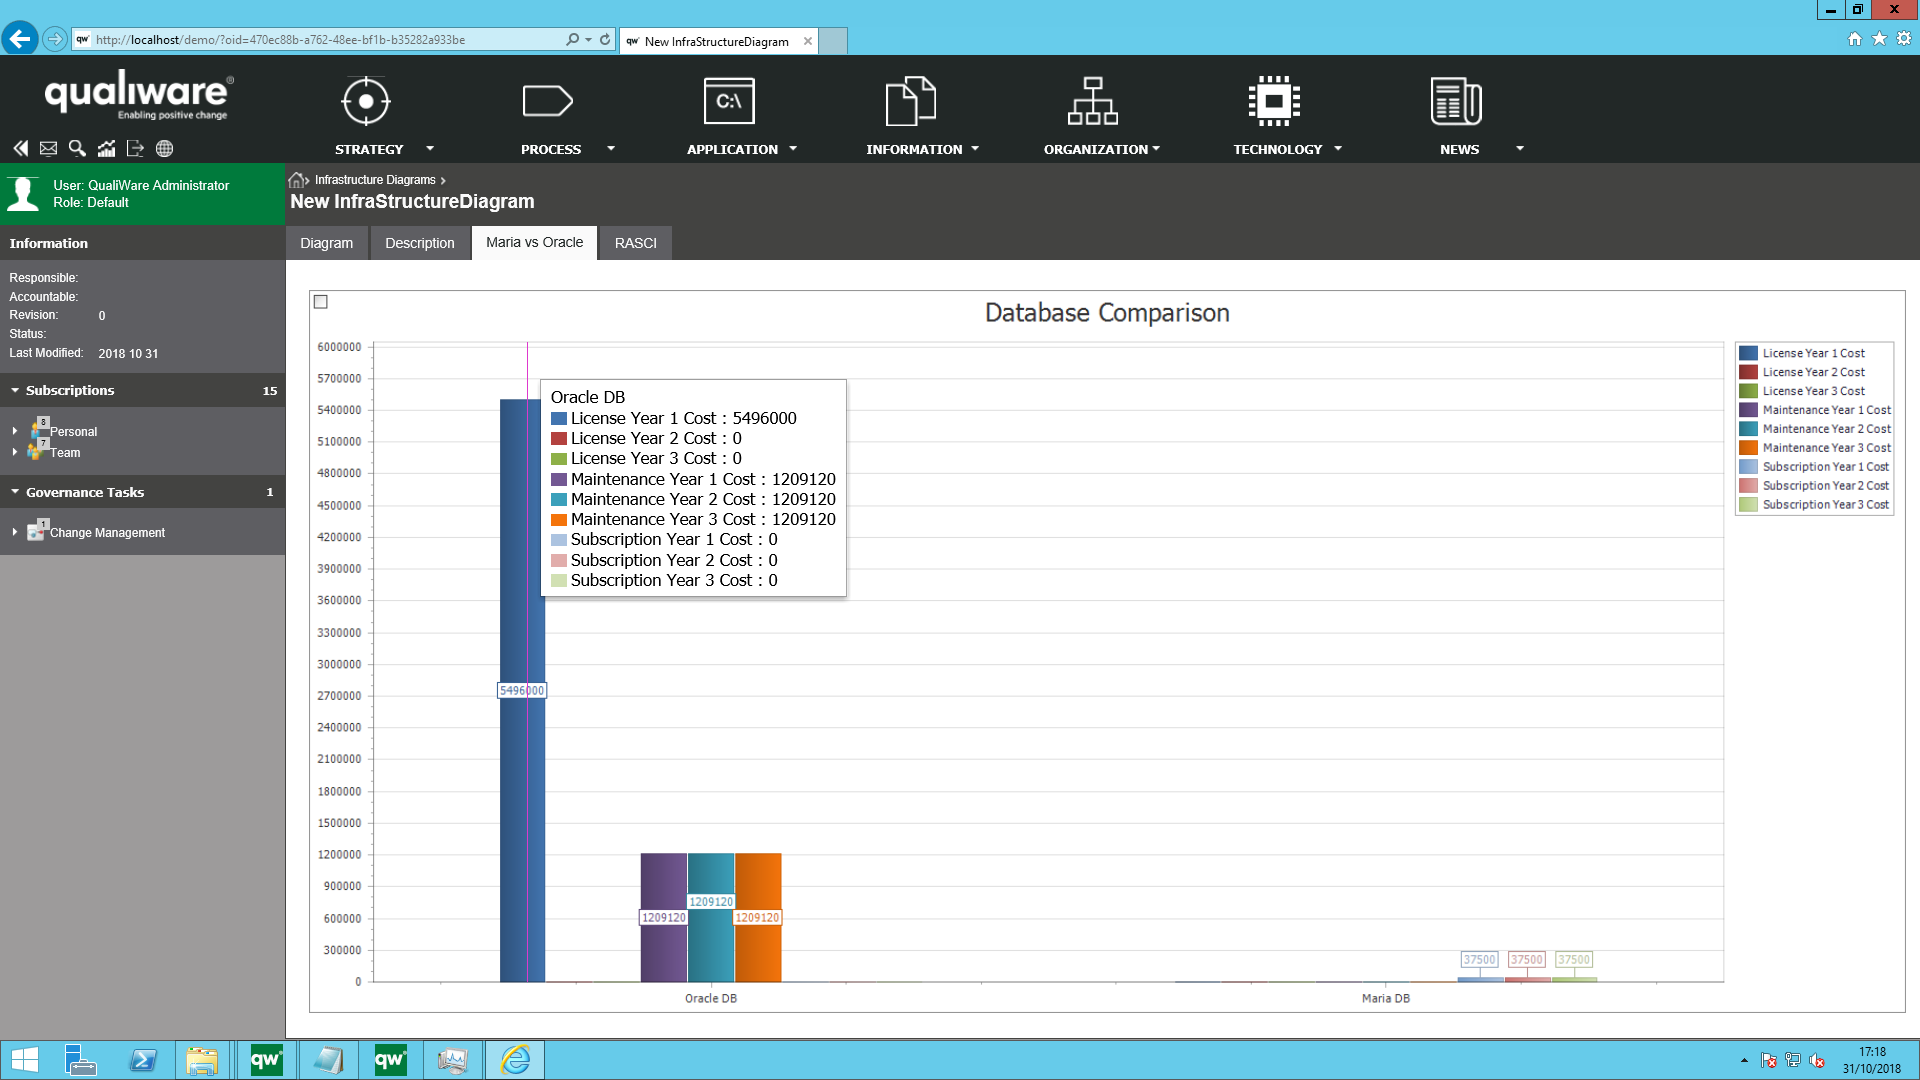
It will build a Bar chart as below

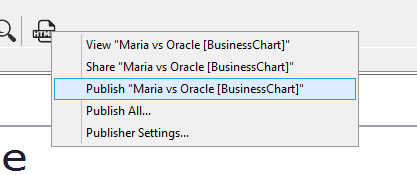
Publish Business Chart
Add Business Chart to Diagram’s Tab-Menu on Web
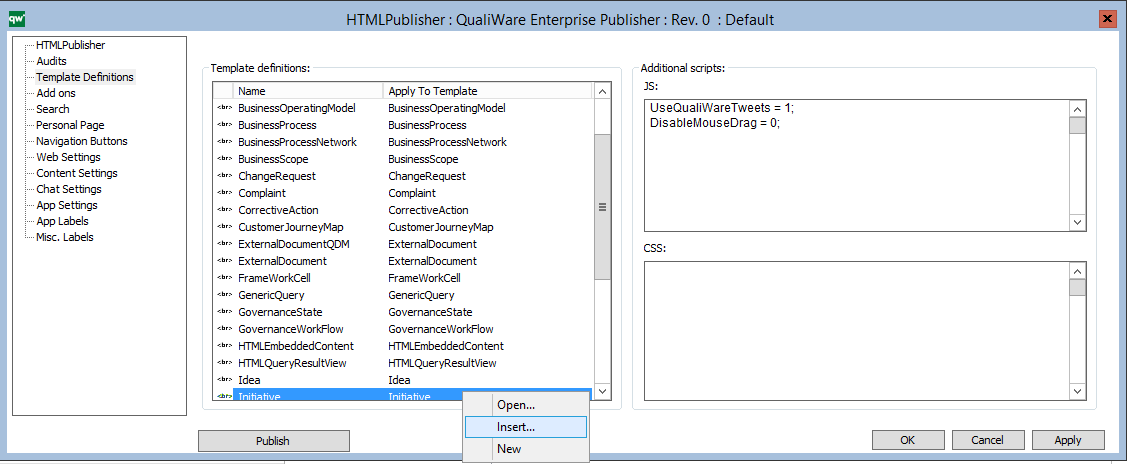
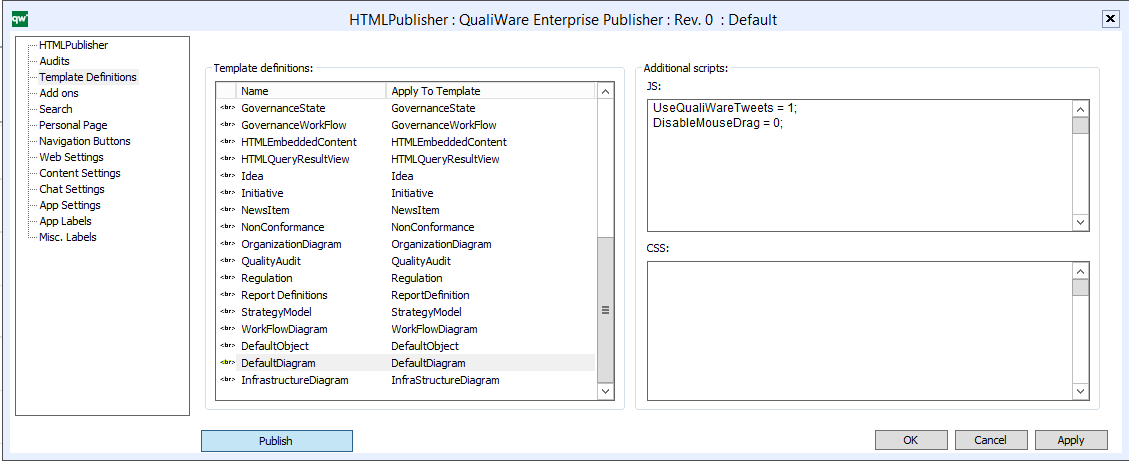
Press CTRL + H and it opens HTMLPublisher
Right Click Inside Template Definitions, Select Insert
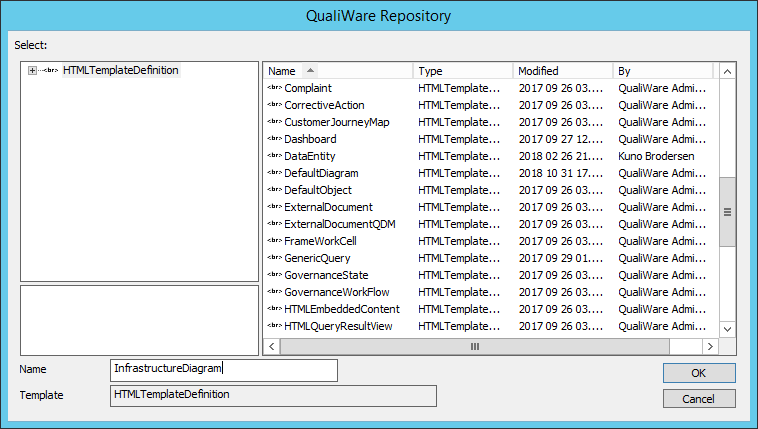
Select HTMLTemplateDefinition and Give it a name InfrastructureDiagram and Click OK
Double Click InfrastructureDiagram definition and Apply to InfrastructureDiagram

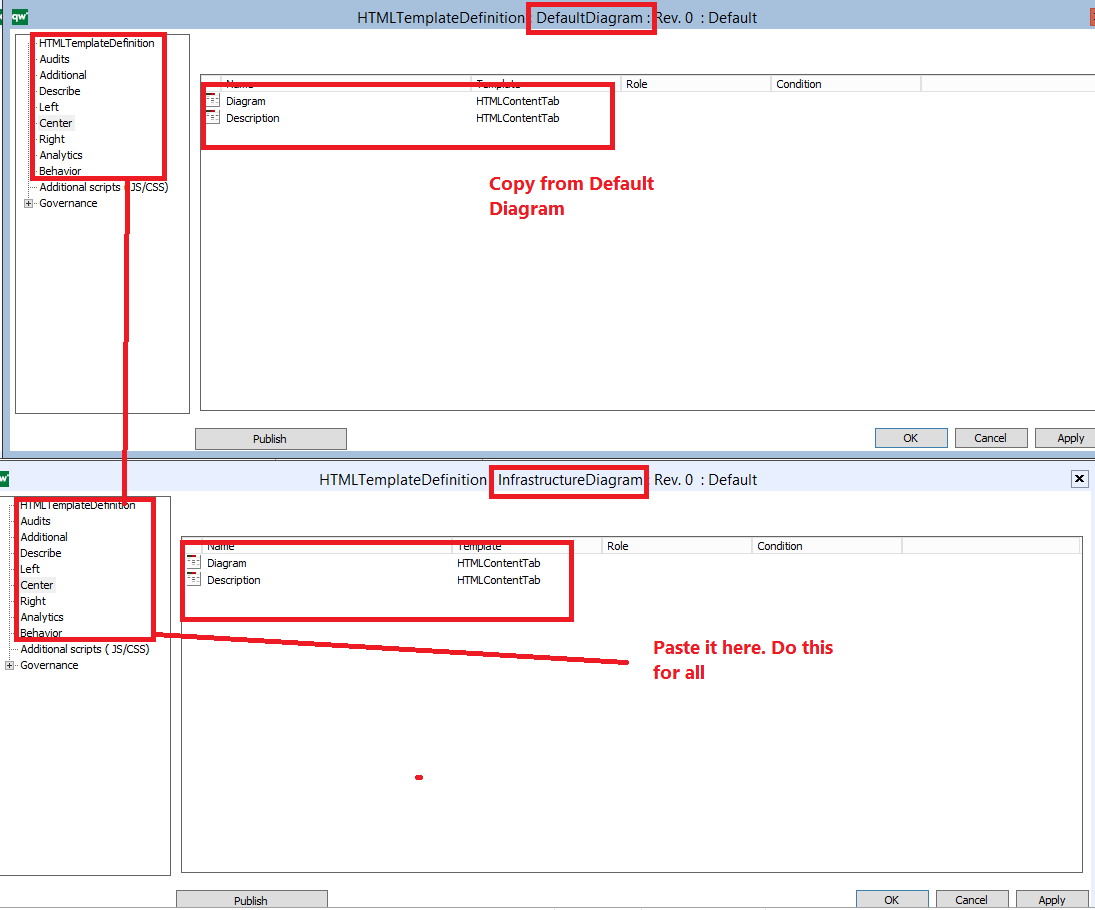
Copy everything from DefaultDiagram Definition and Paste it inside InfrastructureDiagram Definition
Close DefaultDiagram Definition.
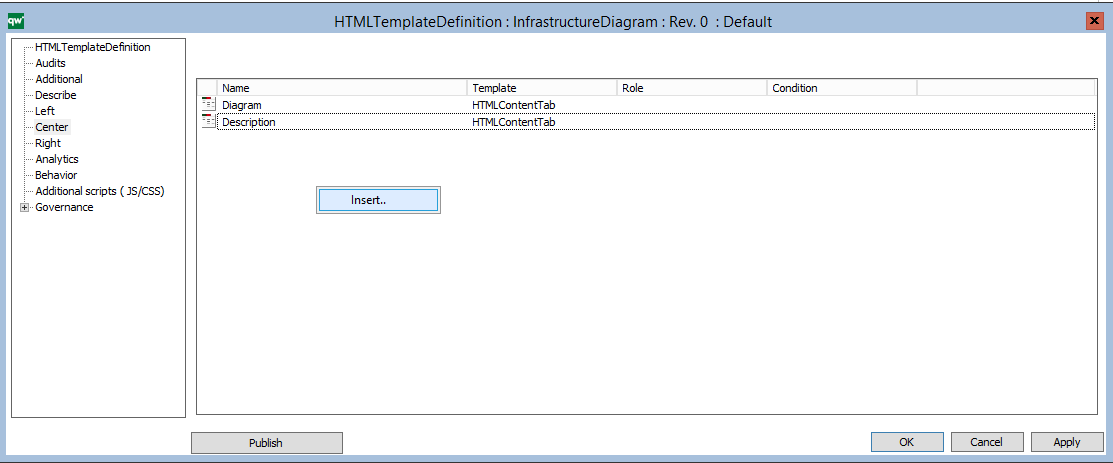
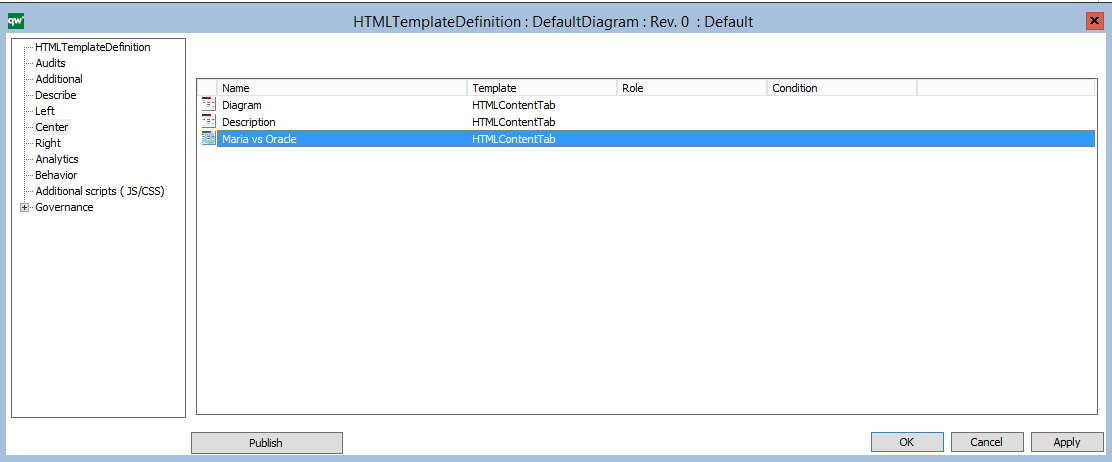
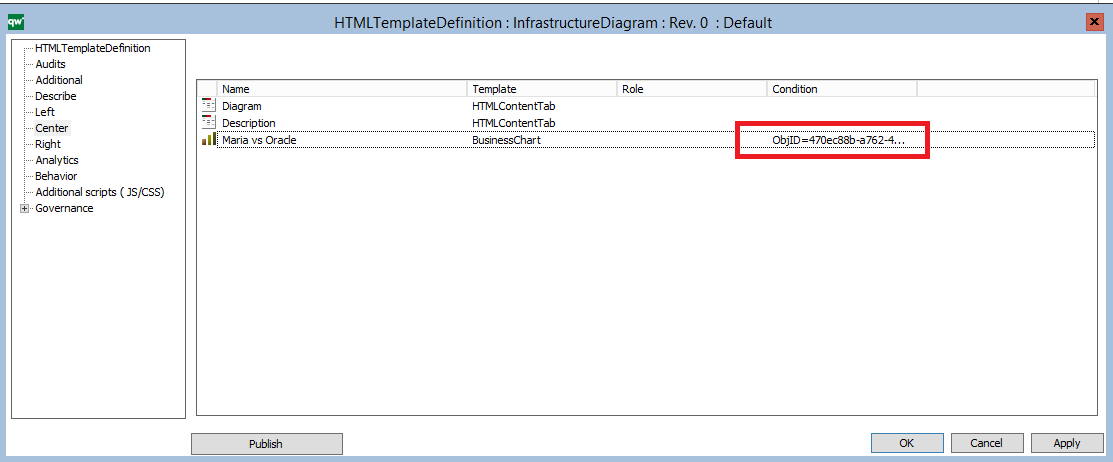
Go to Center and Select Insert for InfrastructureDiagram Definition
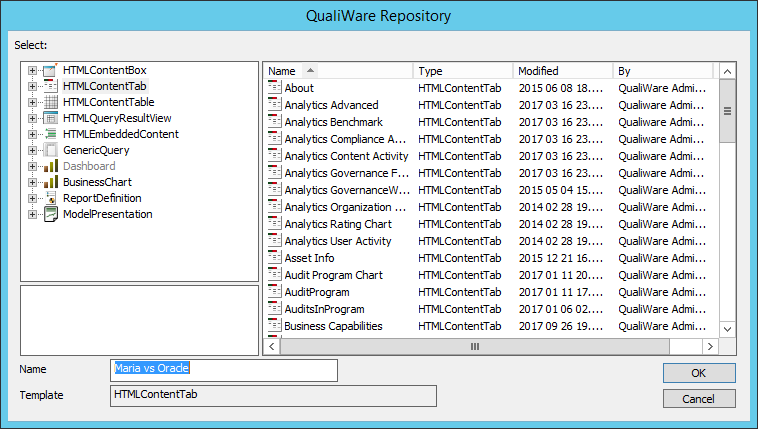
Create a HTMLContentTab and Name it Maria vs Oracle and Click OK
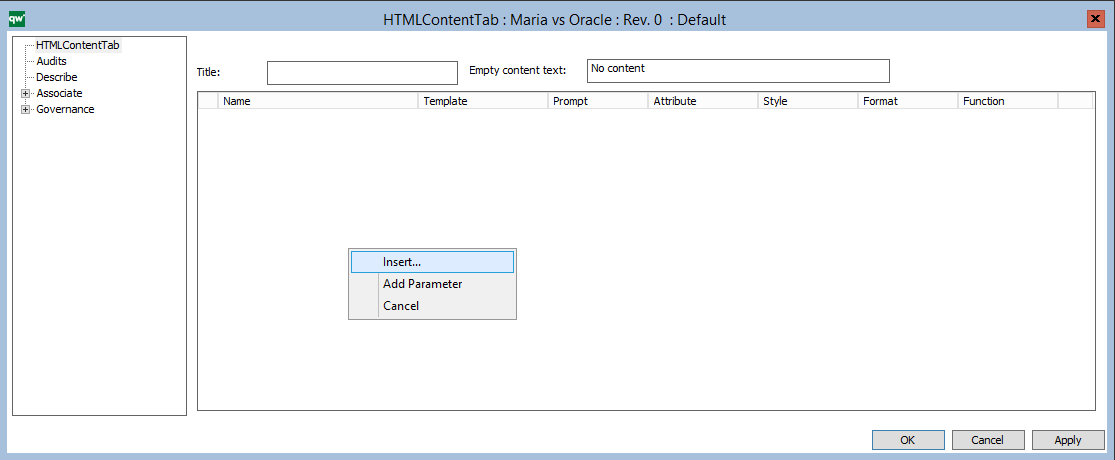
Double Click the new Content Tab and it will open below Window. Right click and Insert
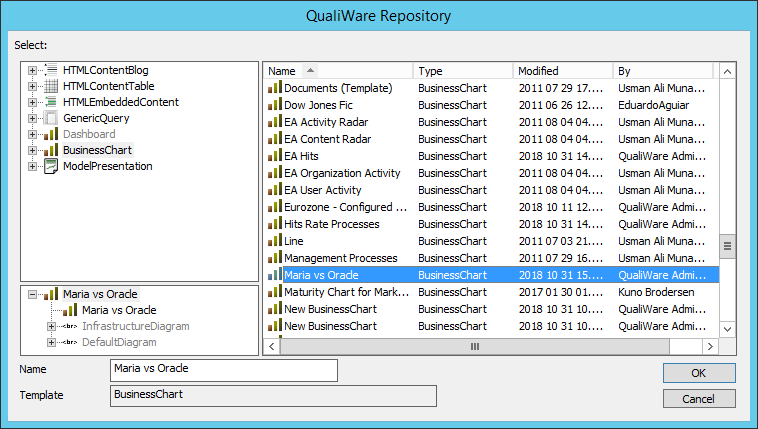
Select BusinessChart and Select your Chart and Click OK
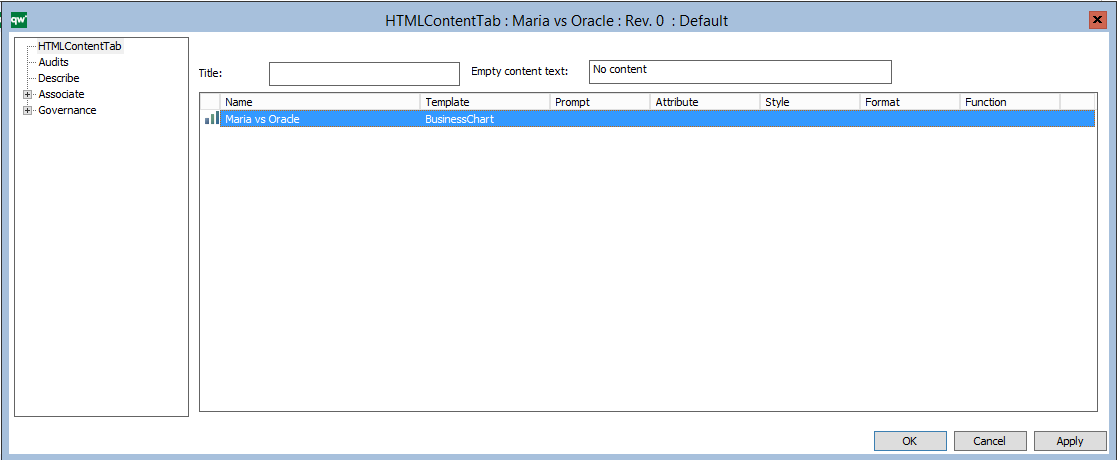
Click OK
Click Publish and OK
Go to Technology Diagram and Open the Right Diagram. Right Click on Canvas and Click Open. Click on Audits. Copy Object ID.

Go back to HTMLTemplateDefinition and In Condition add ObjID=470ec88b-a762-48ee-bf1b-b35282a933be Note this is not your ObjID. It will be different to mine.
Click Publish and OK
It will go to below window. Click Publish and OK here as well
Go to Web and Browse to right diagram. If not updated, then Press CTRL+F5 to clear cache and Refresh