Use Case Diagram

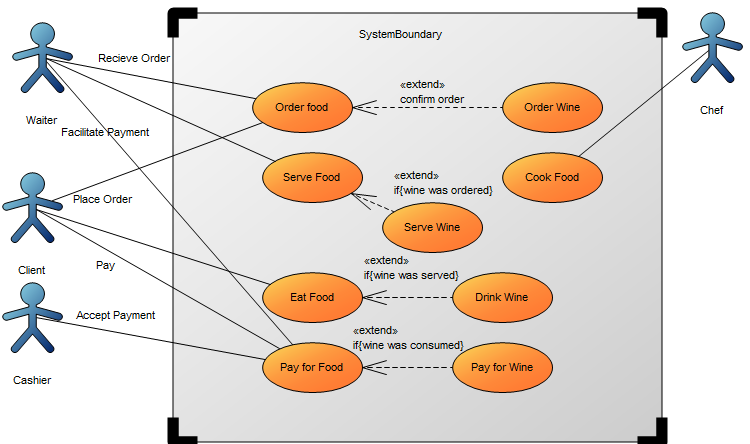
Purpose: The purpose of the Use Case Diagram template is to document user interactions in a system context, as well as the context between different cases of user interactions. Below, you can see an example of a Use Case Diagram for the service at a restaurant:
UseCaseDiagram_2

Core concerns: The available objects you have to model use cases include: System Boundary, Actors, Use Cases, and connectors such as Association, Generalization, Include and Extend. Below, you can see an example of a Use Case Diagram for a booking system at a car rental service:
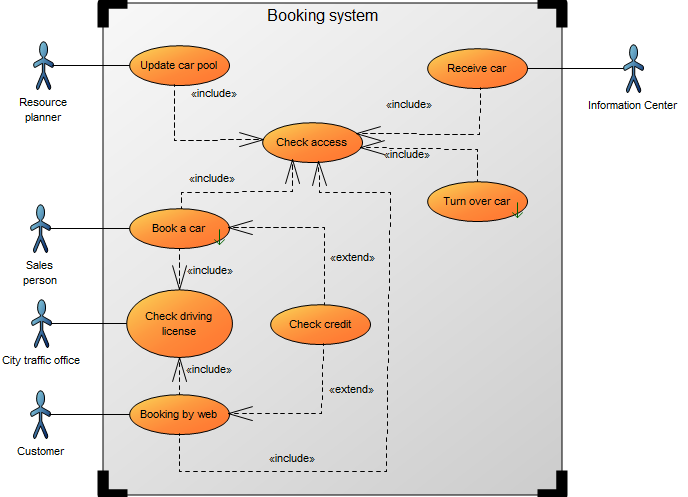
UseCaseDiagram_1

Relation to other diagrams: It is important to break down use cases into other diagrams such as Sequence Diagrams, Communication Diagrams, and Activity Diagrams templates for elaboration.

Properties and metadata: The Use Case Diagram can for example retain the following information:

  • A description of the diagram
  • Link to the owner of the diagram
  • Link to the one responsible for the accuracy of the diagram
  • Audits (auto generated information regarding its current state and access rights)
  • Associated documents, diagrams and other objects
  • Inherent Risk detailing risk considerations
  • Governance information detailing information about the published diagram and who has been involved in the approval of the diagram
  • Project status: information about budgeted and actual man-hours spent, percentage completed and the latest milestone, result and quality control of a change process.

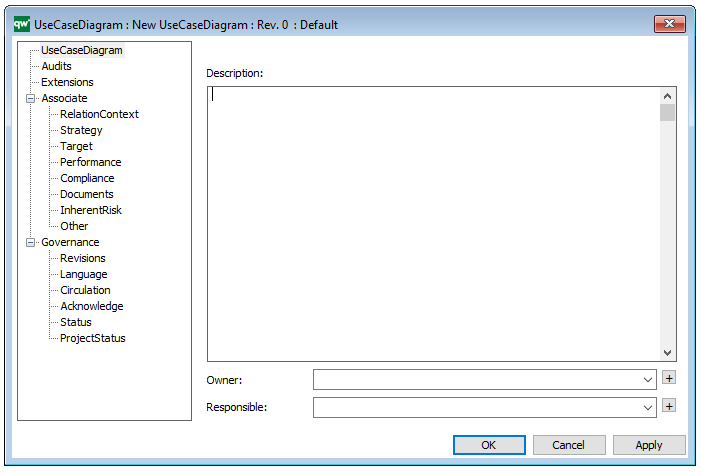
In the picture below you can see the Use Case Diagram’s properties dialogue window, where the properties can be viewed and edited:
Data Flow Diagram

Purpose: The purpose of the Data Flow Diagram is to document a system’s or part of a system’s data flows; the data input the system (or a process within the system) consumes and the data output the system produces.

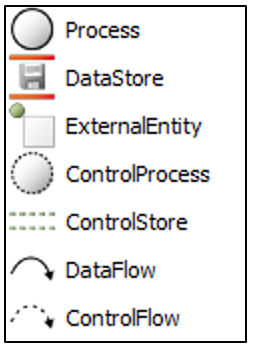
Core concerns: The Data Flow Diagram enables you to model Processes, Data Stores, External Entities, Control Processes and Control Stores. These elements can then be connected by either Data Flows or Control Flows.

Graphical representation of the elements:

The Data Flow Diagram can show different levels of processes within a system that exchange data, and illustrate how those exchanges occur. As such, the model can document a system’s functional hierarchies.

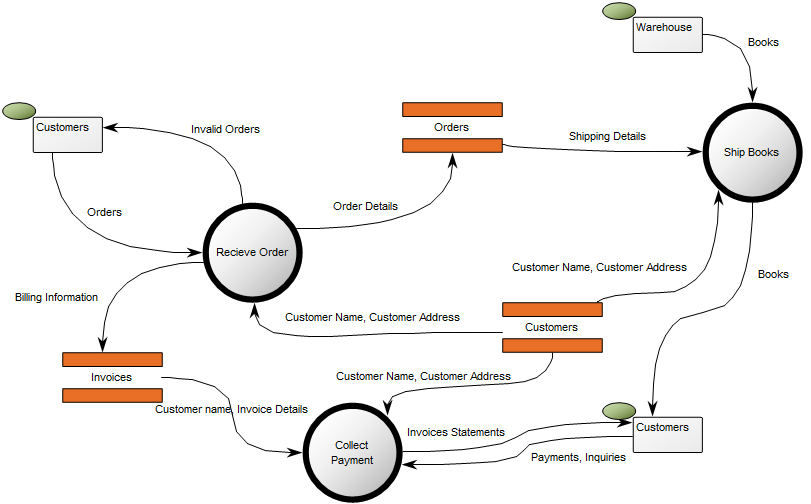
Below, you can see an example of a Data Flow Diagram showing the Data Flows between several Data Stores, Processes and External Entities in a Bookshop:

DataFlowDiagram_2

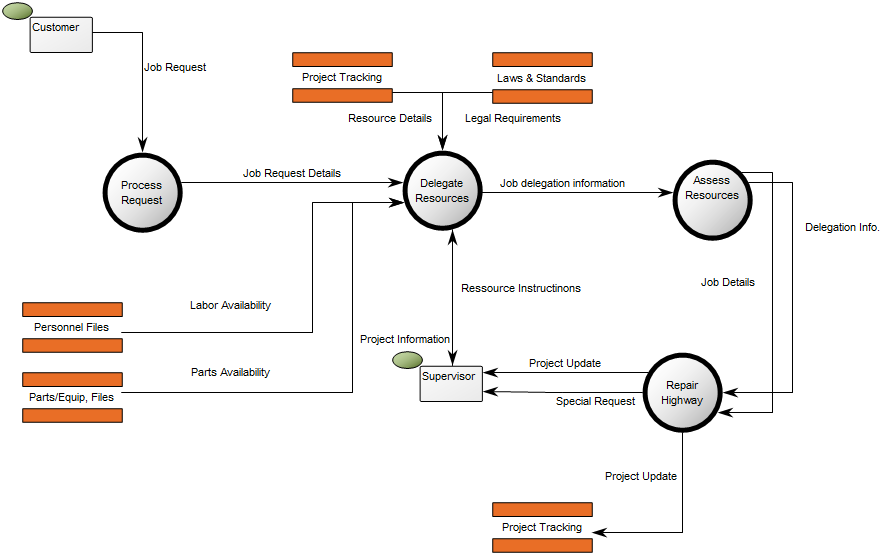
The next example shows the Data Flow between process, Data Stores and External Entities for a Highway Repair Service:

DataFlowDiagram_1

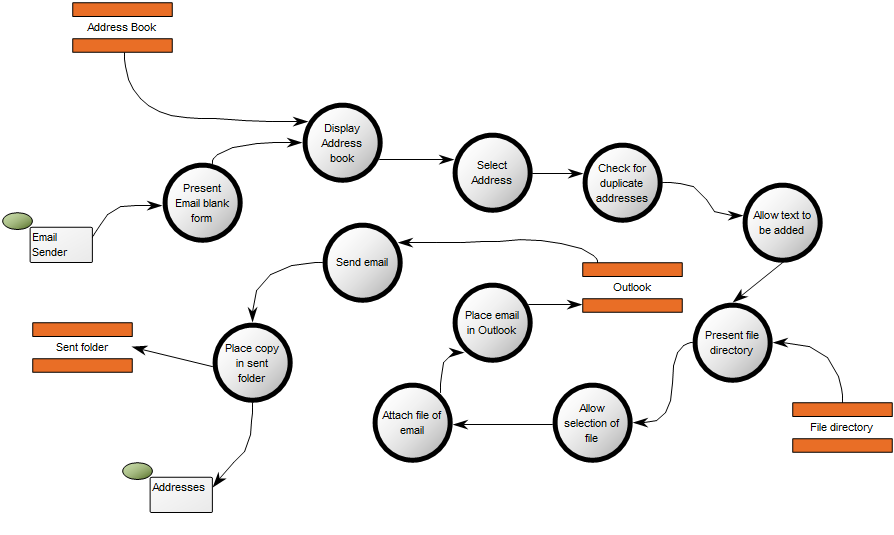
The final example shows the Data Flows between Processes, Datastores and External Entities in an Outlook Mailbox:

dfd

Relation to other templates: The Processes in the Data Flow Diagram can be decomposed into more detailed Data Flow Diagrams to comprise the total functional model. The top level of a Data Flow Diagram is sometimes called a Context Diagram. However, in QLM we use the Data Flow Diagram template for the higher levels as well as the more detailed ones.

The Data Flow Diagram can be a decomposition of an Information System. It can offer a more detailed view of Data Flows than, for example, the Application Architecture Diagram.

An Information System could likewise be decomposed into a Business Process Diagram which offers a complimentary view less concerned with Data Stores and Data Flow, and more concerned with Activity Flow.

Properties and metadata: The Data Flow Diagram template ­­­­can for example retain the following information:

  • A description of the diagram
  • Link to the owner of the diagram
  • Link to the one responsible for diagram
  • Audits (auto generated information regarding its current state and access rights)
  • Associated documents, diagrams and other objects
  • Inherent Risk detailing risk considerations
  • Governance information detailing information about the published diagram and who has been involved in the approval of the diagram

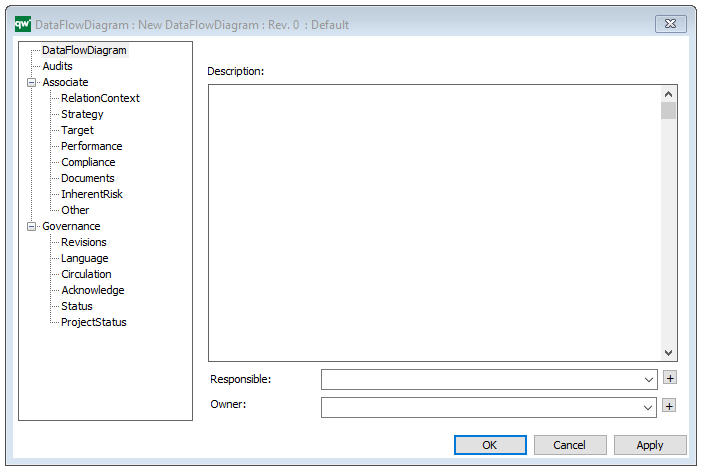
The above picture shows the properties dialogue window for the Data Flow Diagram template, where you can view and edit the diagram’s properties in QualiWare Lifecycle Manager.

Component Diagram

Purpose: The purpose of the Component Diagram is to specify the structure of and dependencies among the different components that make up a system.

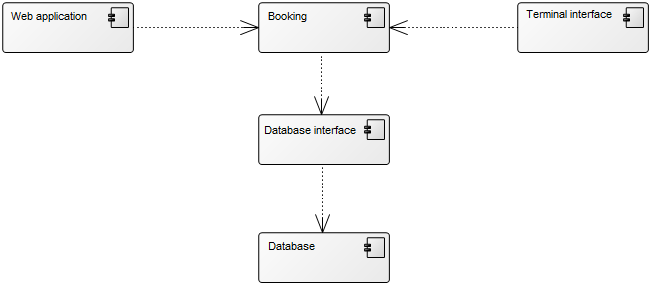
Core concerns: The Component Diagram template enables you to model a system’s Components, Classes, Interfaces, Packages, Artifacts and Ports. They can be connected by Dependency, Interface Realization, Component Realization, Usage, Generalization or a generic Connector. Below, you can see an example of a simple Component Diagram consisting of Components connected by Dependencies.

ComponentDiagram

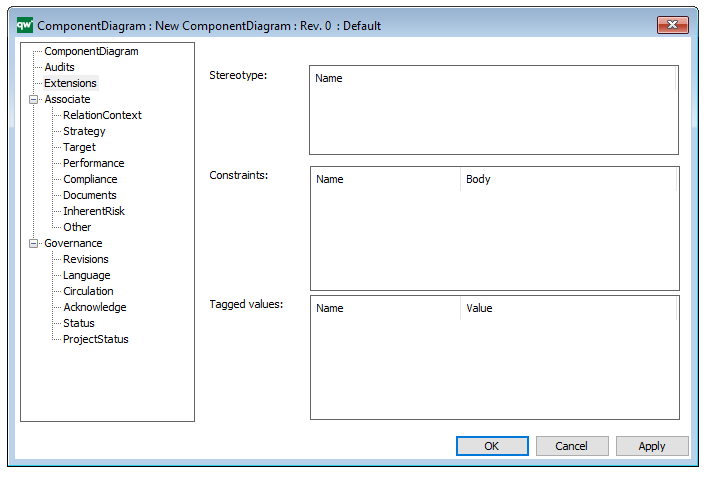
Using the properties dialogue, you can identify extensions such as Stereotype, Constraints and Tagged values:

Relation to other templates: The Component Diagram is part of the Application domain and shows how a system is structured. To model how users interact with a system you should use a Use Case Diagram, to model how interactions with the system through processes you should use the Sequence Diagram template. To model the structure of an application landscape you should use the Application Architecture Diagram.

Properties and metadata: The Component Diagram can for example retain the following information:

  • A description of the diagram
  • Link to the owner of the diagram
  • Link to the one responsible for the diagram
  • Audits (auto generated information regarding its current state and access rights)
  • Associated documents, diagrams and other objects
  • Inherent Risk detailing risk considerations
  • Governance information detailing information about the published diagram and who has been involved in the approval of the diagram

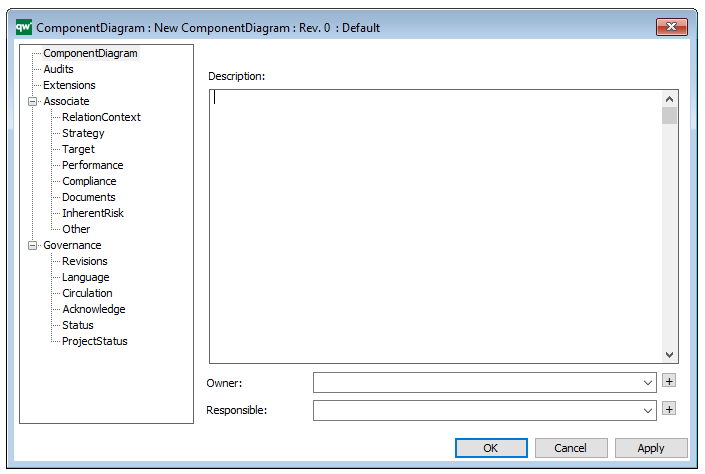
The above picture shows the properties dialogue window for the Component Diagram where you can view and edit the diagram’s properties in QualiWare Lifecycle Manager.

Activity Diagram

Purpose: The purpose of the Activity Diagram is to show the overall flow of control through workflows for computational and organizational processes using the UML standard.

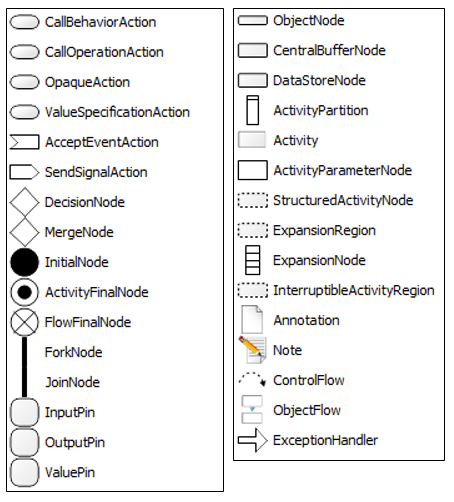
Core concerns: The Activity Diagram enables you to document stepwise activities and actions with support for choice, iteration and concurrency. The template allows you to connect the following objects using either Control Flows, Object Flows or Exception Handlers:

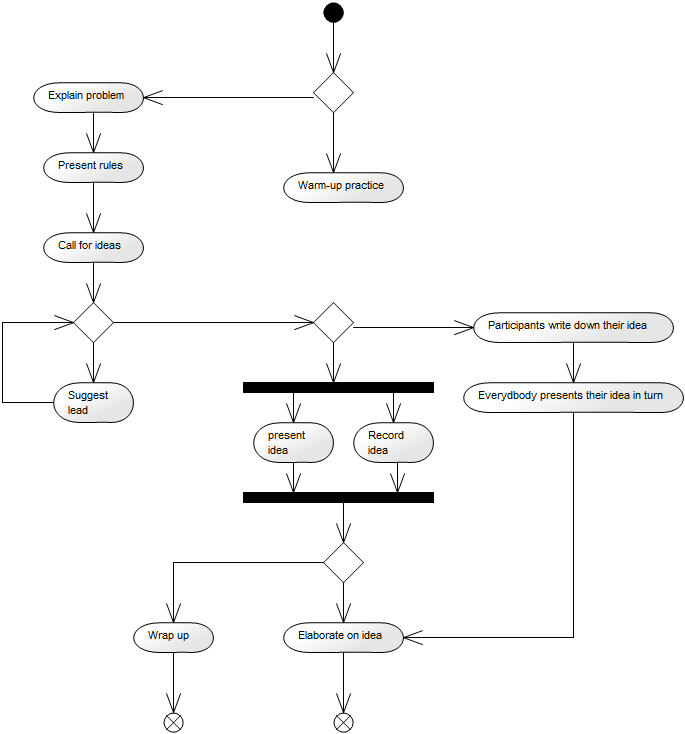
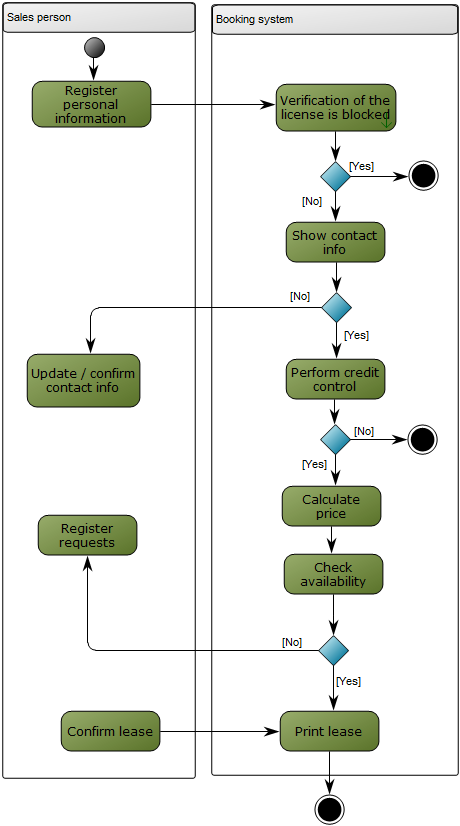
Below, you can see two different examples of an Activity Diagram. The first illustrates a structure for an ideation process, the second shows the process for Booking an order – divided into two different Activity Partitions:

ActivityDiagram_2

ActivityDiagram_1

Relation to other templates: The Activity Diagram can be used instead of a Workflow Diagram or a Business Process Diagram, though the different languages have their own pros and cons. The Activity Diagram is part of the UML templates QualiWare supports along with the Communication Diagram, Deployment Diagram, Class Diagram, Composite Structure Diagram, State Diagram, Package Diagram, Component Diagram, Sequence Diagram, Use case diagram and Timing Diagram.

Properties and metadata: The Activity Diagram ­­­­can for example retain the following information:

  • A description of the diagram
  • Link to the owner of the diagram
  • Link to the one responsible for the diagram
  • Audits (auto generated information regarding its current state and access rights)
  • Extensions: Stereotypes, constraints and tagged values
  • Associated documents, diagrams and other objects
  • Inherent Risk detailing risk considerations
  • Governance information detailing information about the published diagram and who has been involved in the approval of the diagram

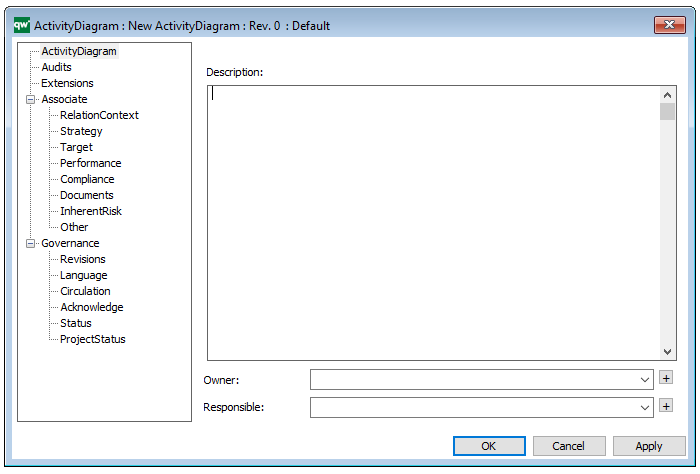
The above picture shows the properties dialogue window for the Activity Diagram where you can view and edit the diagram’s properties in QualiWare Lifecycle Manager.

For more information: about the UML and Activity Diagram, please visit the Object Management Group’s Website, where you can find the complete specification.