HTML Visualizer Filter

The HTMLVisualizerFilter template is used to create customized filter(s) to use in the 3D Visualizer on the web.

Click “Add Templates” to select the templates to be included in the filter.

Click “Add Relation” to insert the relation to be included in the filter.

Once a HTMLVisualizerFilter is created it becomes available in the Explore and Local Explore menu.

HTML Explorer Layout

Purpose: The purpose of the HTML Explorer Layout is to contain information of the HTML explorer and its behavior. A new template for this purpose has been created. Please see HTML Mega Menu for information on how to change the setup of your web platform menu layout. To change the setup of the tiles in the menu, you should use the HTML Publisher.

HTML Slide Menu

Purpose: The purpose of A HTML Slide Menu is to contain information of the menu in the web platform and the behavior of the menu. A new template for this purpose has been created. Please see HTML Mega Menu for information on how to change the setup of your web platform menu layout.

HTML Popup Menu Layout

Purpose: A HTML Popup Menu Layout contains information of the popup menu and the behavior of the menu on the web. A new template for this purpose has been created. Please see HTML Mega Menu for information on how to change the setup of your web portals menu layout.

HTML Menu Layout

Purpose: The purpose of the HTML Menu Layout is to contain information of the menu and the behavior of the menu on the web. A new template for this purpose has been created. Please see HTML Mega Menu for information on how to change the setup of your web platform menu layout.

User Role Configurator

Purpose: The purpose of the User Role Configurator template is for the QLM user to create his or her personalized workspace featuring only chosen repository views.

Core concerns: The User Role Configurator template is a system template in QLM. It enables you to create and attach Repository View Definitions, Property View Definitions and Sub Tab View Definitions to the User Role Configurator. Where the information in the User Role Configurator decides which filters will be shown in QLM, the different view definitions define what the filters should contain. Below, you can see a screenshot of the QLM workspace. The repository view, which this template can configure, is marked with a red arrow and framed by a red square:

‘Relation to other templates: To run, the User Role Configurator template must have a corresponding QualiWare Setup template to execute its code. Where the HTML templates pertain to the setup of the collaboration platform, the User Role Configurator template is solely concerned with the workspace in QLM.

Properties and metadata: The User Role Configurator template can for example retain the following information:

  • A description of the User Role
  • Audits (auto generated information regarding its current state and access rights)
  • Repository View Definition, detailing the standard views the User Role should make available
  • Property View Definition, detailing which relations should be visible

The above picture shows the properties dialogue window for the User Role Configurator template, where you can view and edit the diagram’s properties in QualiWare Lifecycle Manager. Below you can see the tabs for Repository View Definition and Property View Definition:

Repository Desktop

Purpose: The primary purpose of The Repository Desktop template is to design toolbars in QLM.

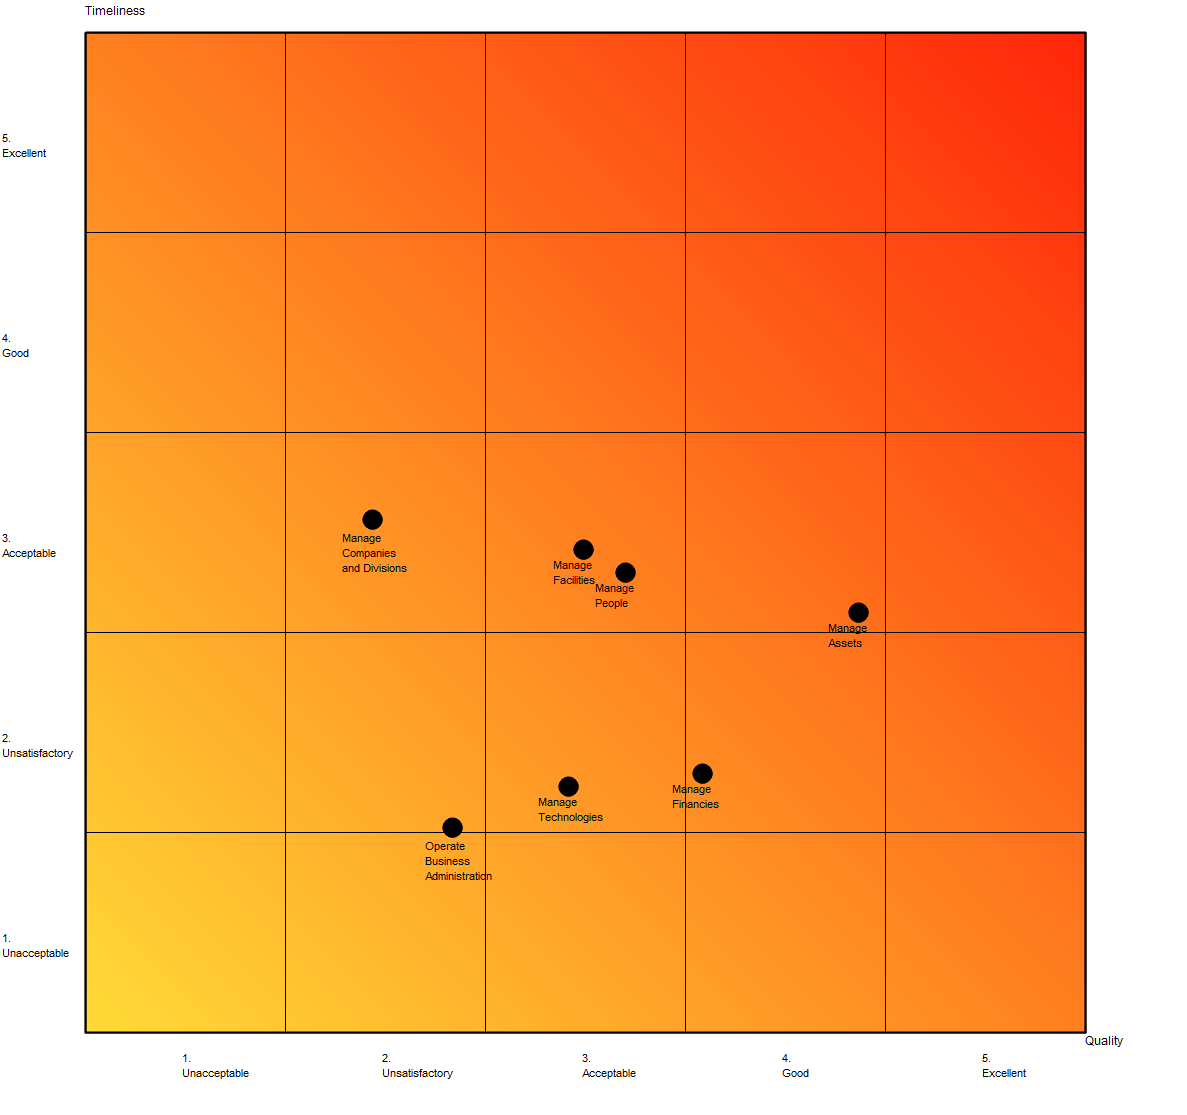
Core concerns: The Repository Desktop enables you to use Button Panels and Icons to design additional toolbars that can be added to the desired diagram template types in the actions tab in QLM. The toolbars can, when assigned to a template type, be used to analyze the data shown in diagrams.

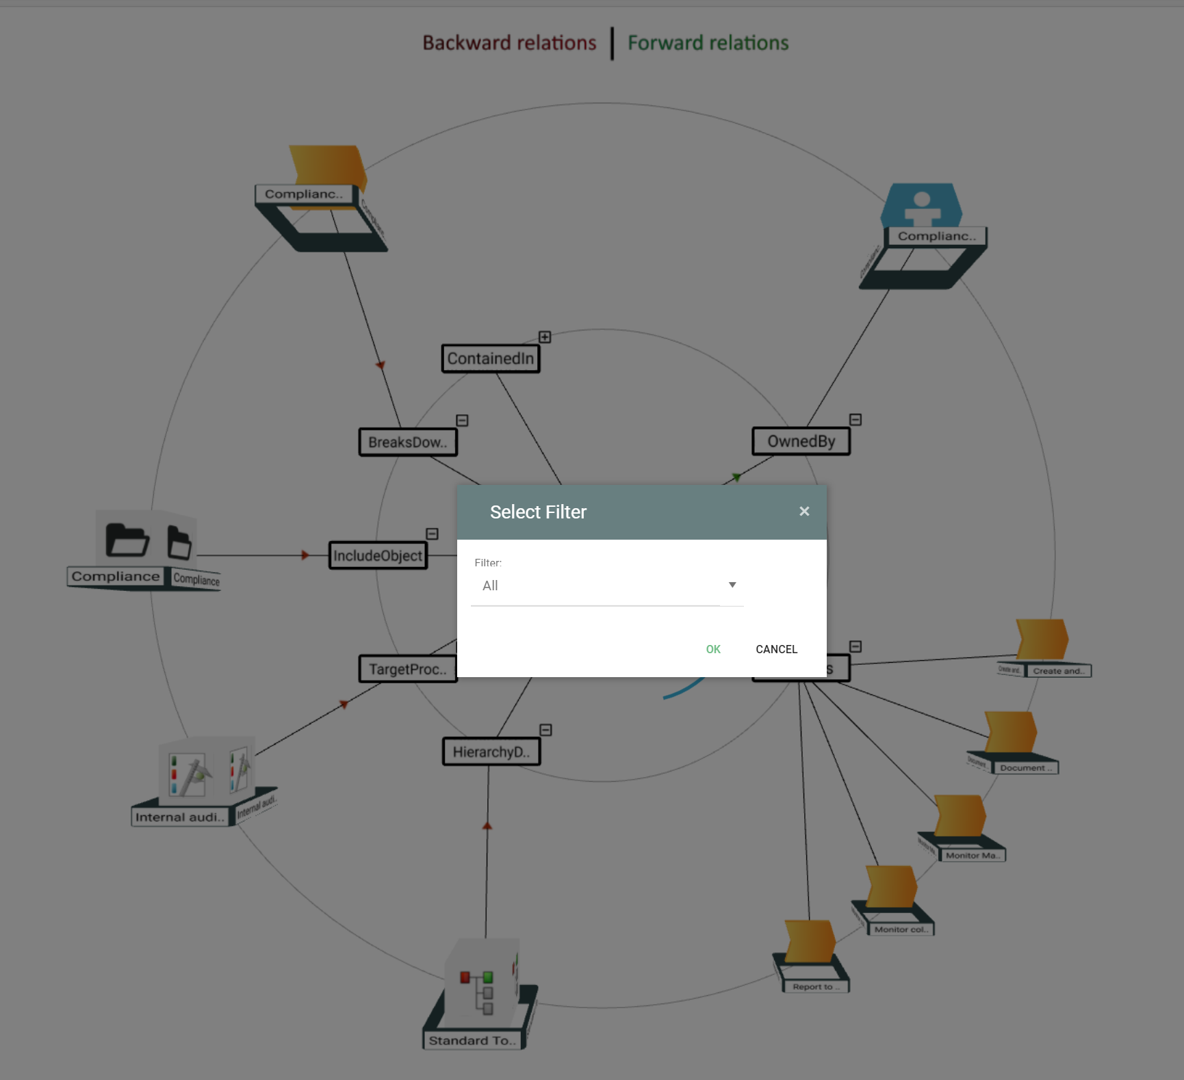
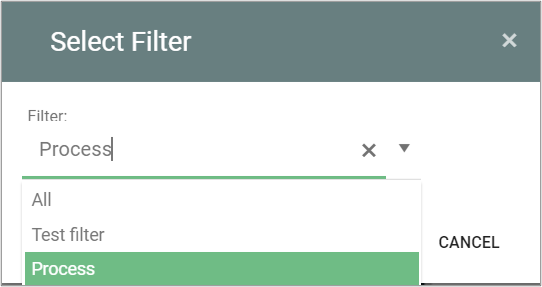
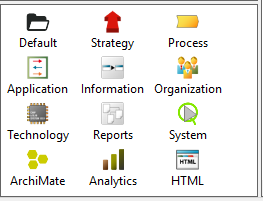
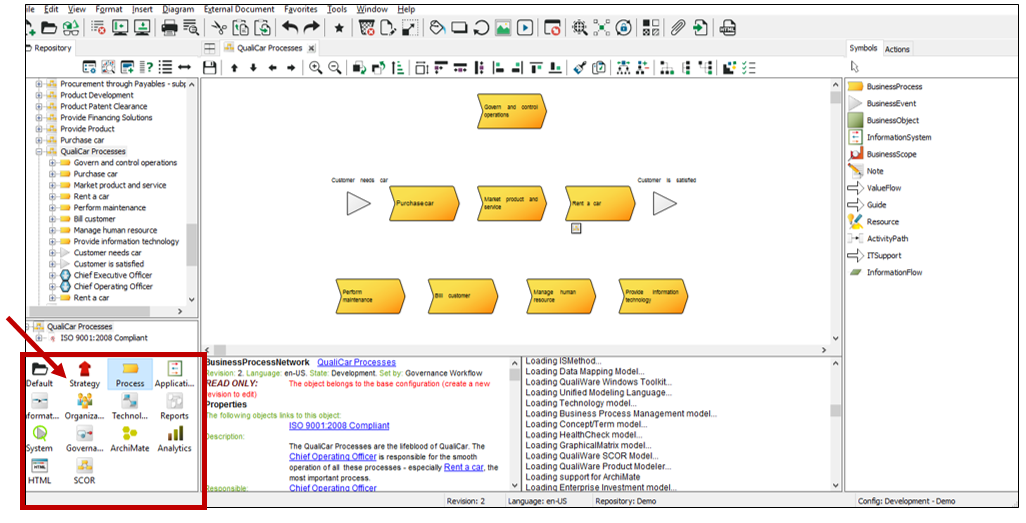
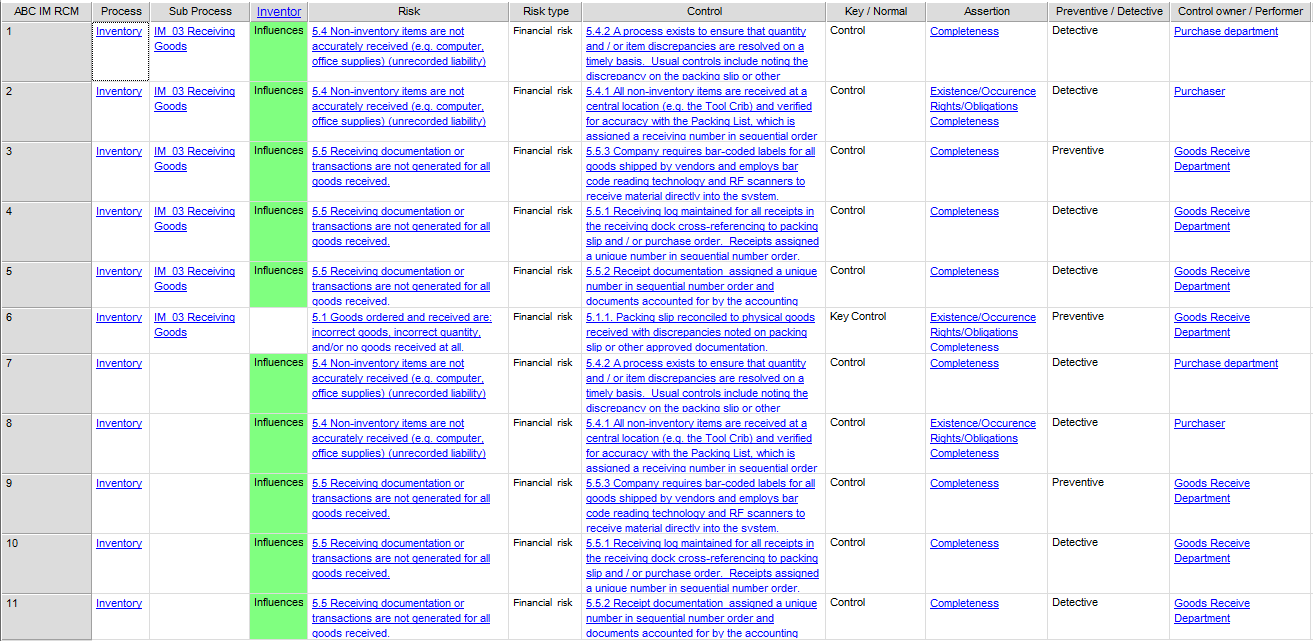
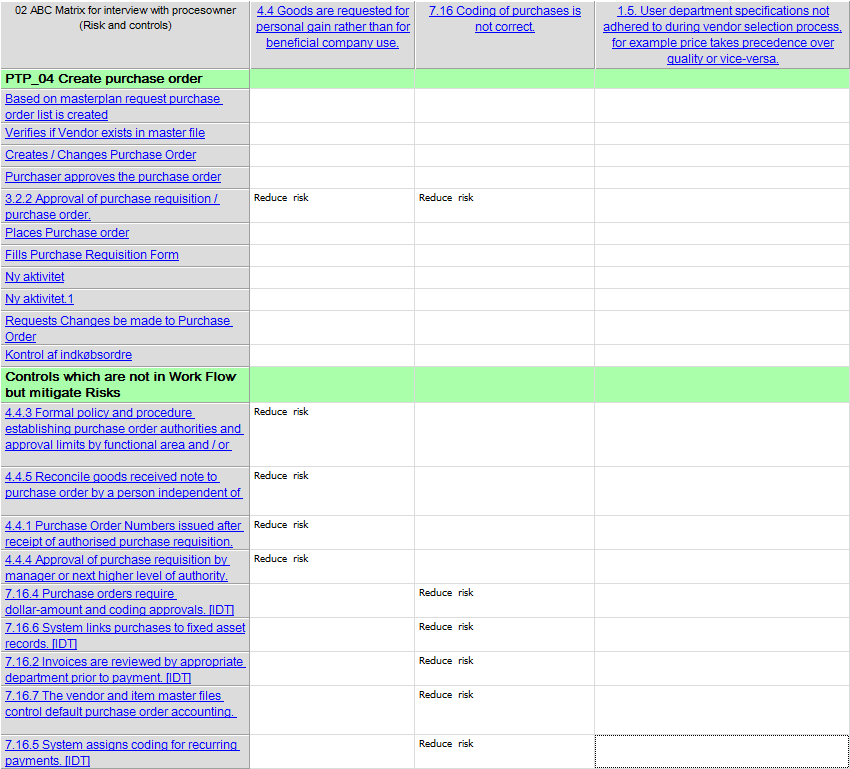
Below, you can see some examples of different toolbars:

RepositoryDesktop_2

RepositoryDesktop_1

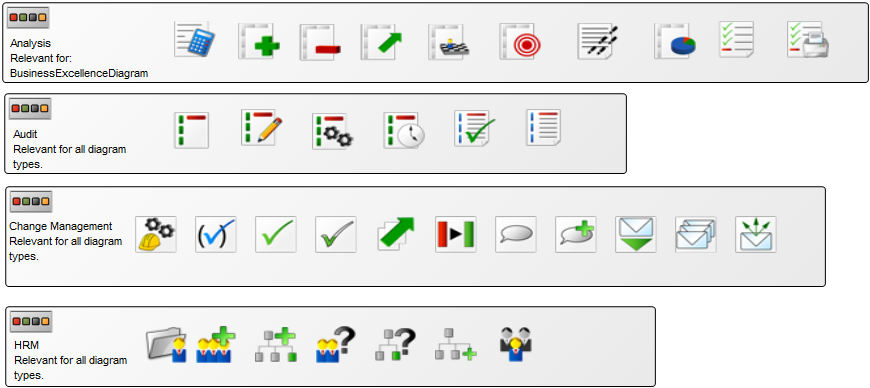
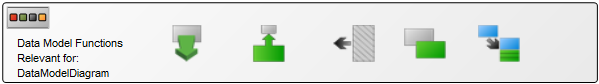
The repository has several toolbars available when installed that you, through the repository template can assign to the desired template types.

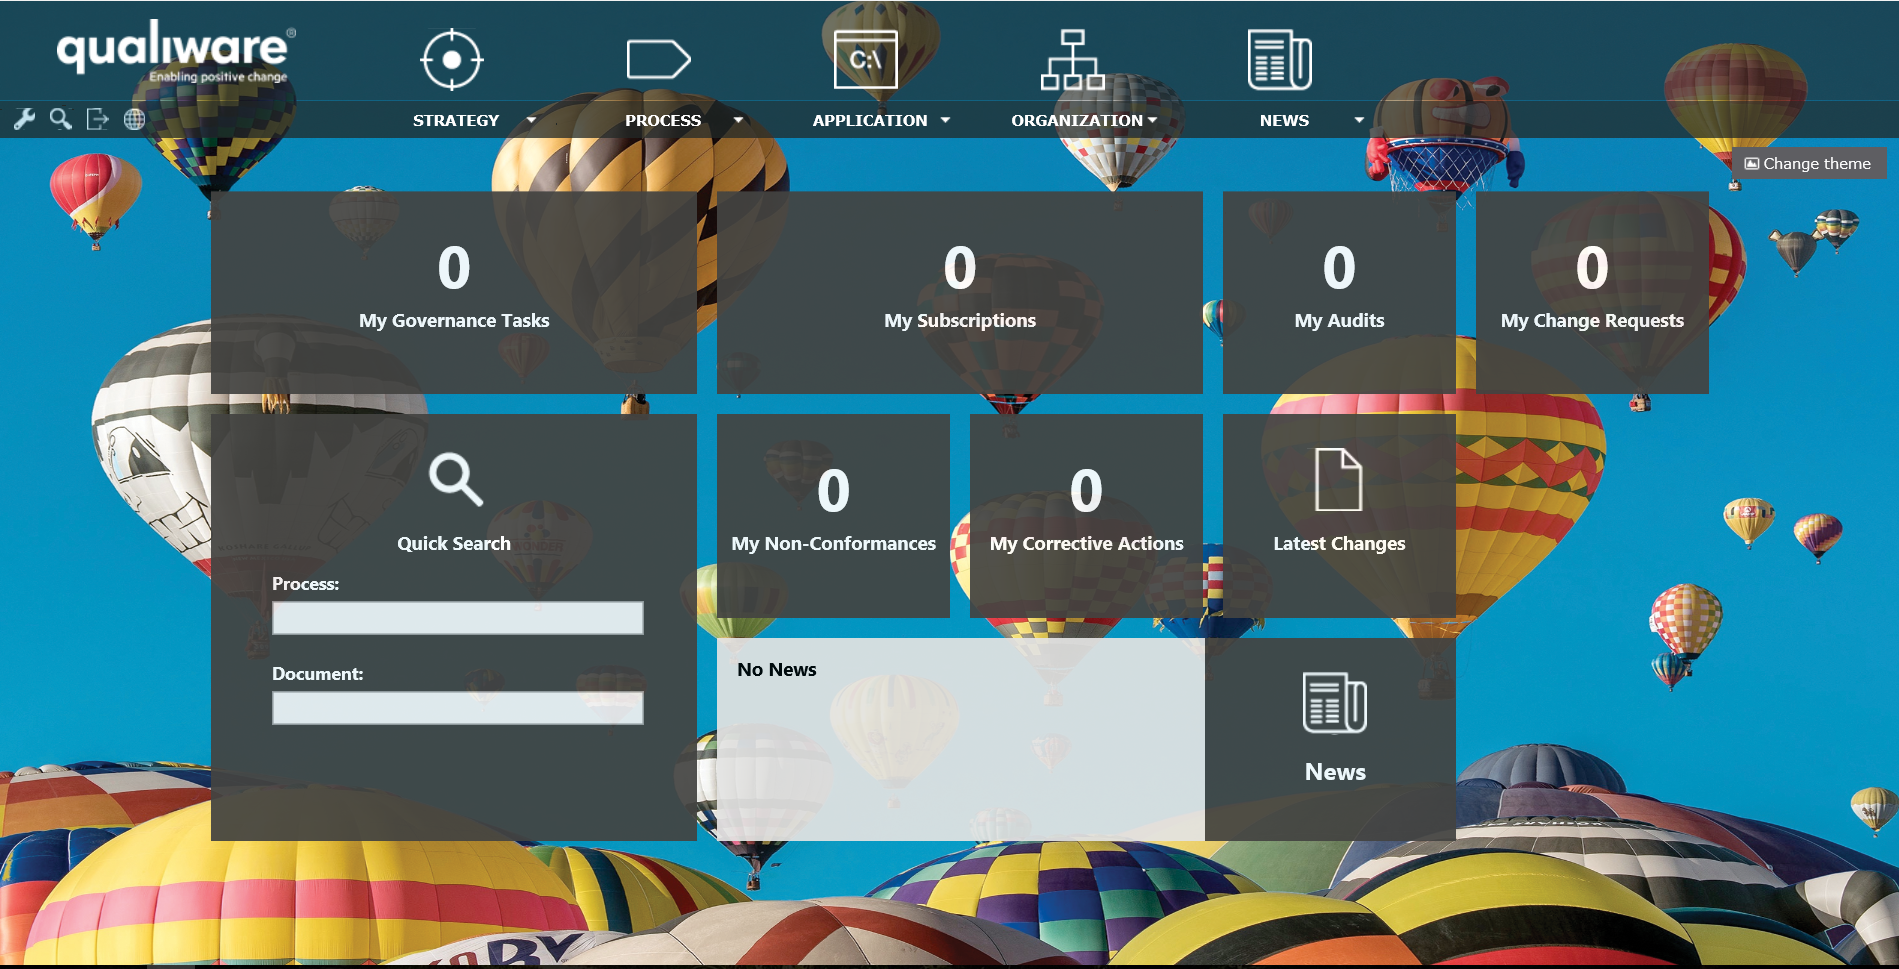
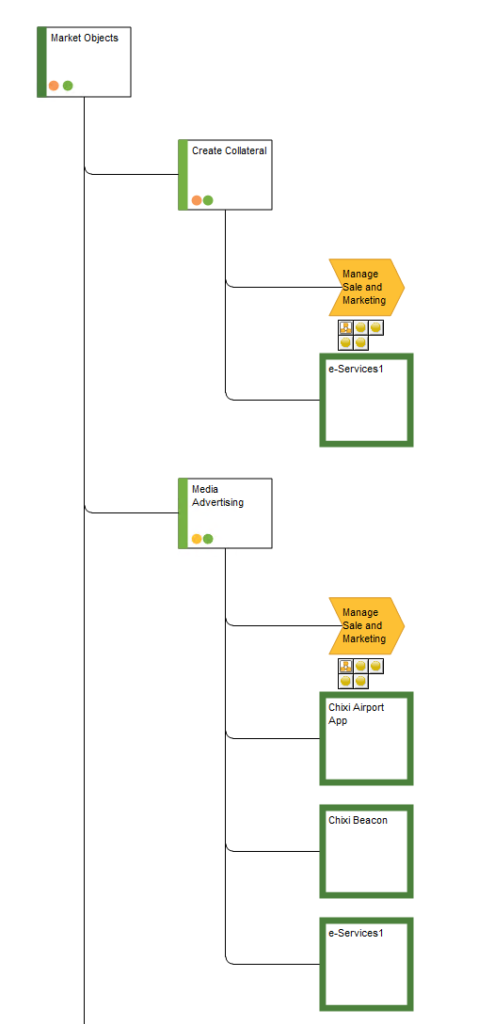
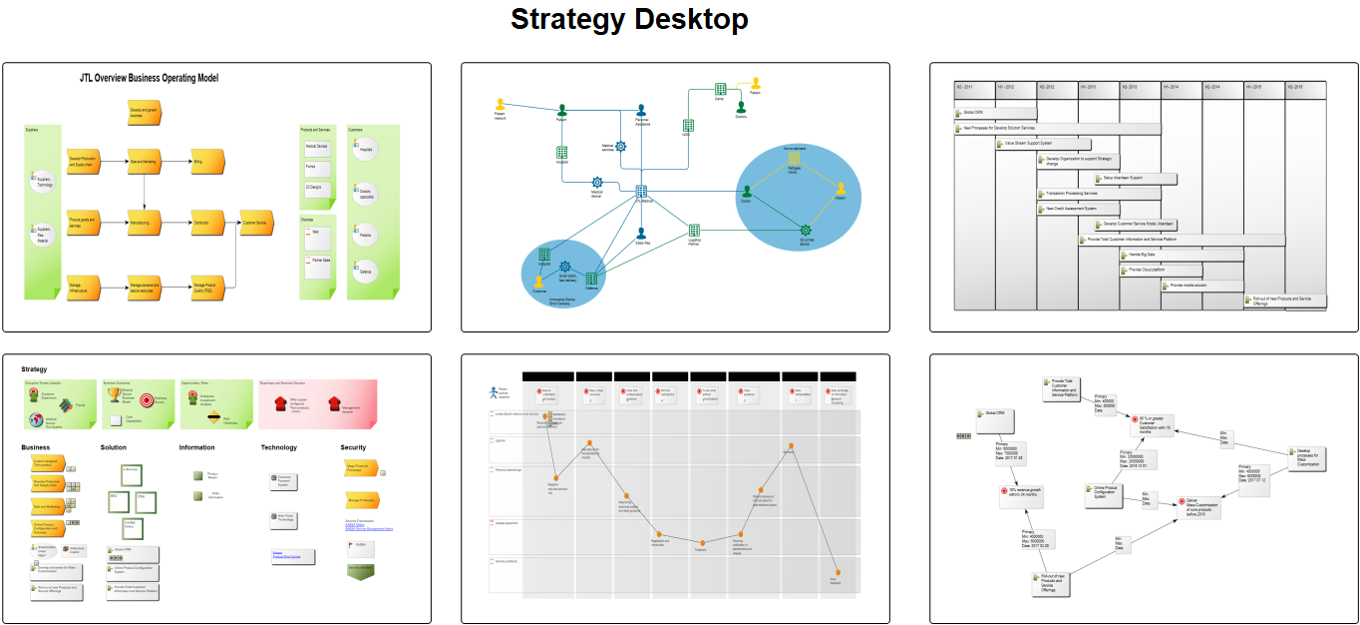
Other functionalities: The Repository Desktop template can also be used as an overview page that links out to other diagrams relevant for certain stakeholders. Below, you can see an example of a strategy desktop where each icon links to the model illustrated:

Relation to other templates: The Repository Desktop is, like the Matrix template, an auxiliary diagram. As such it is not directly connected to other templates but can be used to enable certain analytical functions in all types of diagrams.

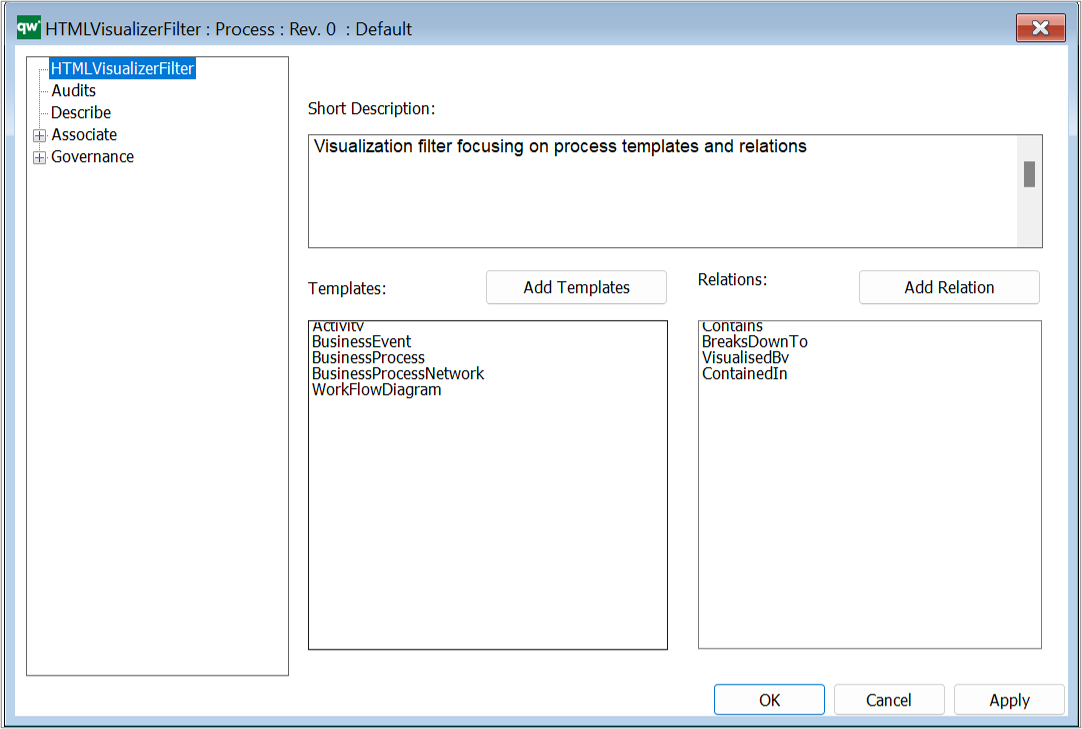
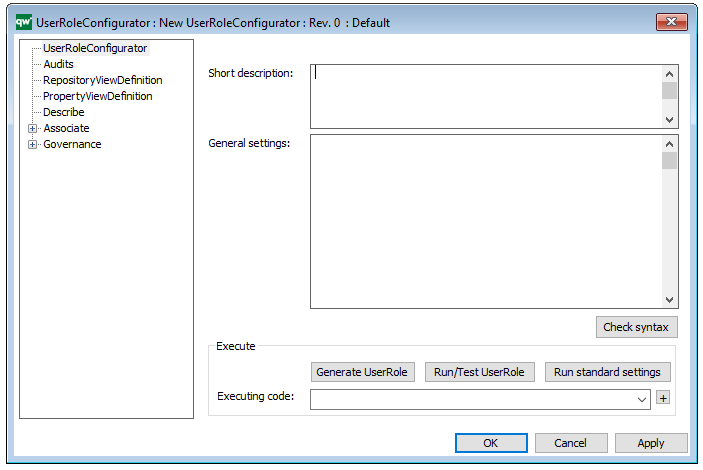
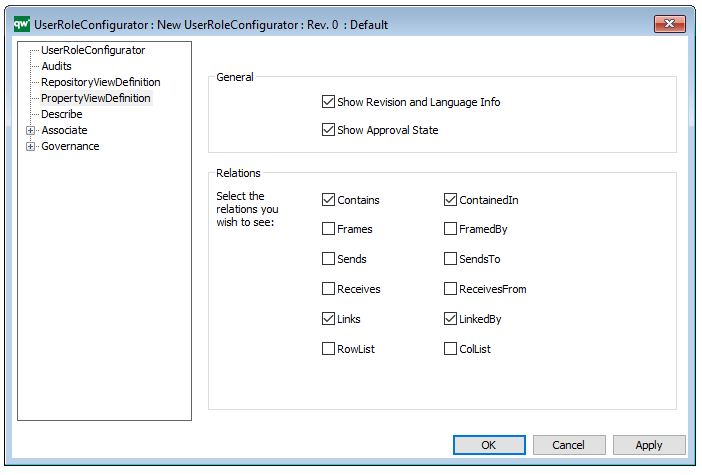
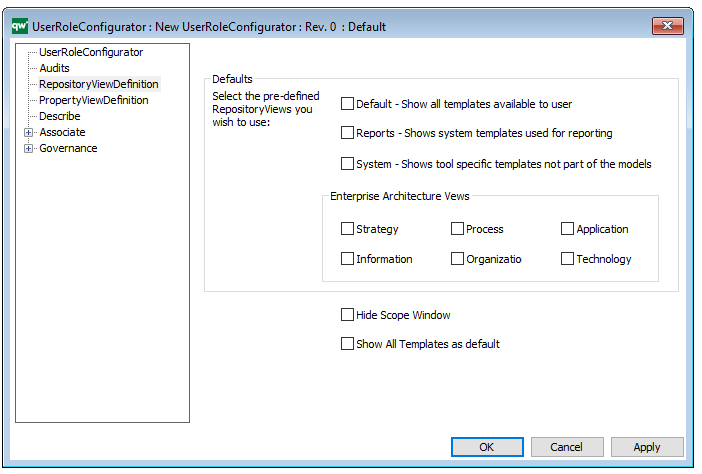
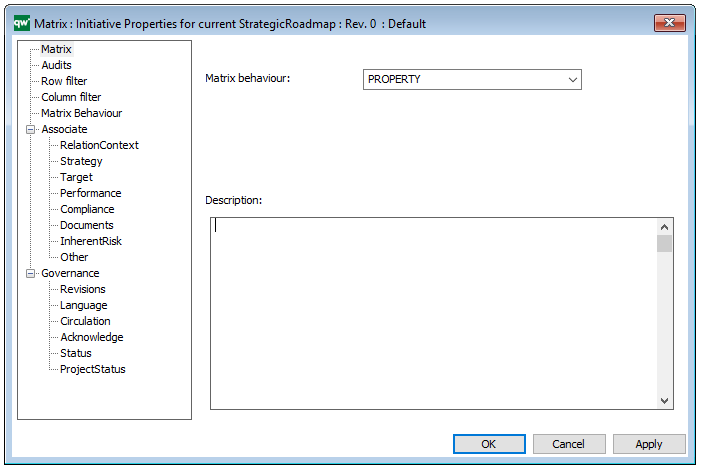
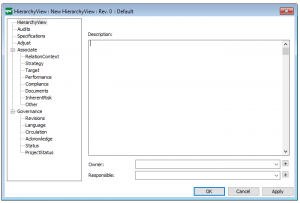
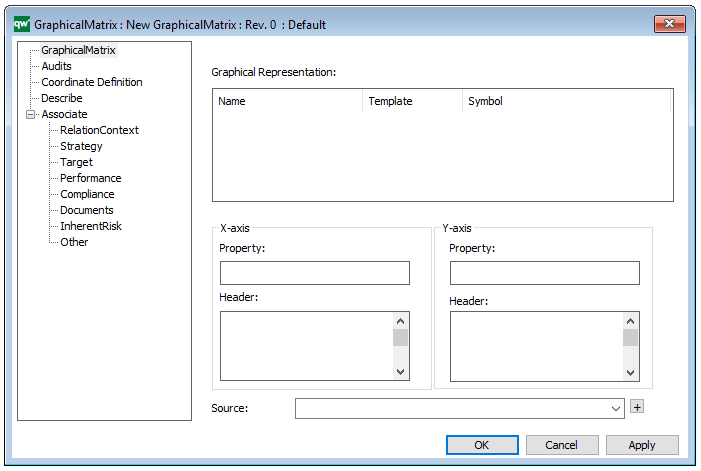
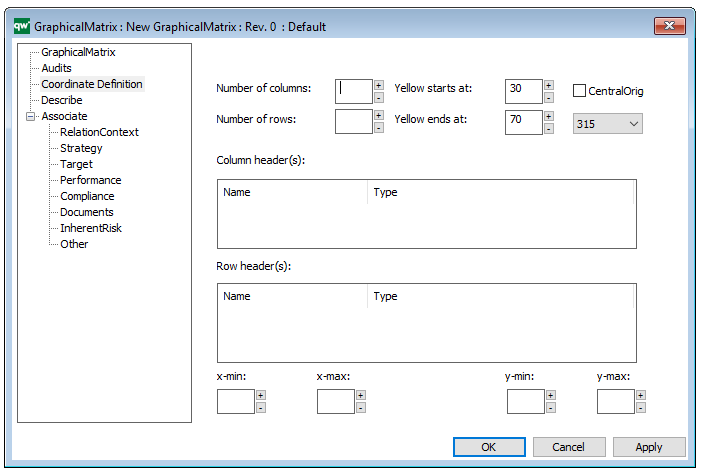
Properties and metadata: The Repository Desktop template can, for example, retain the following information:

  • A description of the template
  • Audits (auto generated information regarding its current state and access rights)
  • Associated documents, diagrams and other objects
  • Inherent Risk detailing risk considerations
  • Governance information detailing information about the published diagram and who has been involved in the approval of the diagram

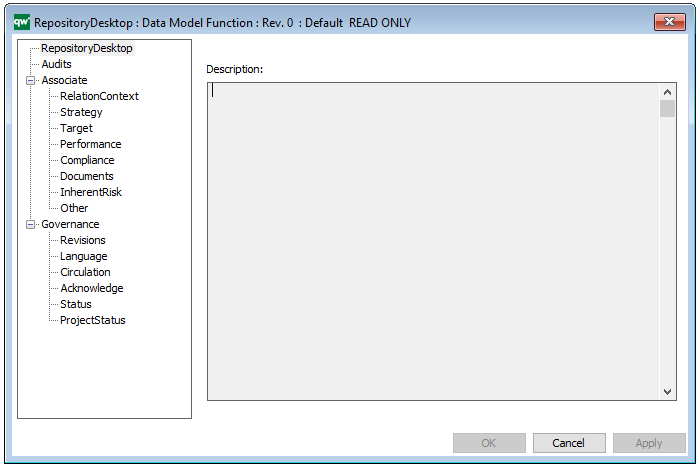
The above picture shows the properties dialogue window for the Repository Desktop template where you can view and edit the diagram’s properties in QualiWare Lifecycle Manager.

Matrix

Purpose: The Matrix template is used as an auxiliary diagram type for other diagrams. It can either show the properties or links of and between existing objects.

Concerns: There can be generated three types of Matrix diagrams: Link Matrices, Property Matrices and Text Matrices.

  • Link Matrices are typically used to summarize the links of two different template types. For example, a Link Matrix can be created using Business Process as the rows and Information Systems as the columns to quickly get an overview over which Information Systems are linked to which Business Processes under IT -Support.
  • Property Matrices can be used to summarize the contents of many objects, for example, of a single template type in a single diagram. For example, a Property Matrix can be created for Information Systems to obtain an overview over the details describing all the relevant Information Systems and identify any gaps in the information. You could also choose to filter the items in the template, so only the Information Systems used in a specified process are shown.
  • Text Matrices function as a regular spreadsheet. This type of matrix can for example be used to store data used for KPIs

Below is an example of a property matrix detailing the risks and control processes related to the process called ‘Inventory’:

Matrix_1

Below is an example of a link matrix detailing the relation between three identified risks and several controls (from the diagram, you can see that only two of three risks are addressed by the control processes):

Matrix_2

Relation to other templates: Where the Matrix can be used as a backend tool, Query Result Views (QRV’s) are created to give an overview of specific objects and their attributes on the collaboration platform.

 Properties and metadata: The Matrix template can for example retain the following information:

  • A description of the diagram
  • Audits (auto generated information regarding its current state and access rights)
  • Associated documents, diagrams and other objects

In the picture below you can see the Matrix template’s properties dialogue window, where the properties can be viewed and edited:

You can also edit the properties of the Matrix in the properties dialogue window by changing the Matrix behavior, Row filter or Column filter.


Hierarchy View

Purpose: The purpose of the Hierarchy View template is to show the hierarchy of objects related to a chosen root object.

Core concerns: The root object in the hierarchy View can for example be a Capability or a Business Process. The view is not modeled as a diagram, but generated based on information specified in the template’s property dialog, making the scope of the view flexible. Below, you can see an examples of a Hierarchy View for the Capability “Market Objects”:

Relation to other templates: The Hierarchy View is not directly connected to any single template but is not unlike a Context View. The Hierarchy View is, compared to a Context View, usually filtered to only show certain types of relations amongst certain types of objects and not as a default connected to diagram templates:

Properties and metadata: The Hierarchy View template can for example retain the following information:

  • A description of the diagram
  • Link to the owner of the Hierarchy View
  • Link to the one responsible for the Hierarchy View
  • Audits (auto generated information regarding its current state and access rights)
  • Specifications (definition of root object and other inclusion criteria)
  • Adjust (specification of templates that should be removed from the view)
  • Associated documents, diagrams and other objects
  • Inherent Risk detailing risk considerations
  • Governance information detailing information about the published diagram and who has been involved in the approval of the diagram

The above picture shows the properties dialogue window for the Hierarchy View template where you can view and edit the diagram’s properties in QualiWare Lifecycle Manager.

The HierachyView can be used in relation to the Standard Tree View in the HTMLPublisher, to establish a hierarchy for the network of process models in a repository.

Graphical Matrix

Purpose: The purpose of the Graphical Matrix template is to compare the states or scores of objects, such as for example Capabilities or Information Systems.

Core concerns: The Graphical Matrix is generated based on information inserted into its property dialog where input, x-axis and y-axis are defined. Below, you can see an example of a Graphical Matrix for capabilities, scoring their quality and timeliness:

GraphicalMatrix_1

Relation to other templates: When scoring risks and visualizing residual risks, you can use a Heatmap.

Properties and metadata: The Graphical Matrix template can for example retain the following information:

  • A description
  • Link to the source of the input
  • Coordinate definitions of the Graphical Matrix
  • Audits (auto generated information regarding its current state and access rights)
  • Associated documents, diagrams and other objects

The above picture shows the properties dialogue window for the Graphical Matrix, where you can view and edit the diagram’s properties in QualiWare Lifecycle Manager. Below, you can see the tab for Coordinate Definition: