Purpose: The purpose of the Graphical Matrix template is to compare the states or scores of objects, such as for example Capabilities or Information Systems.
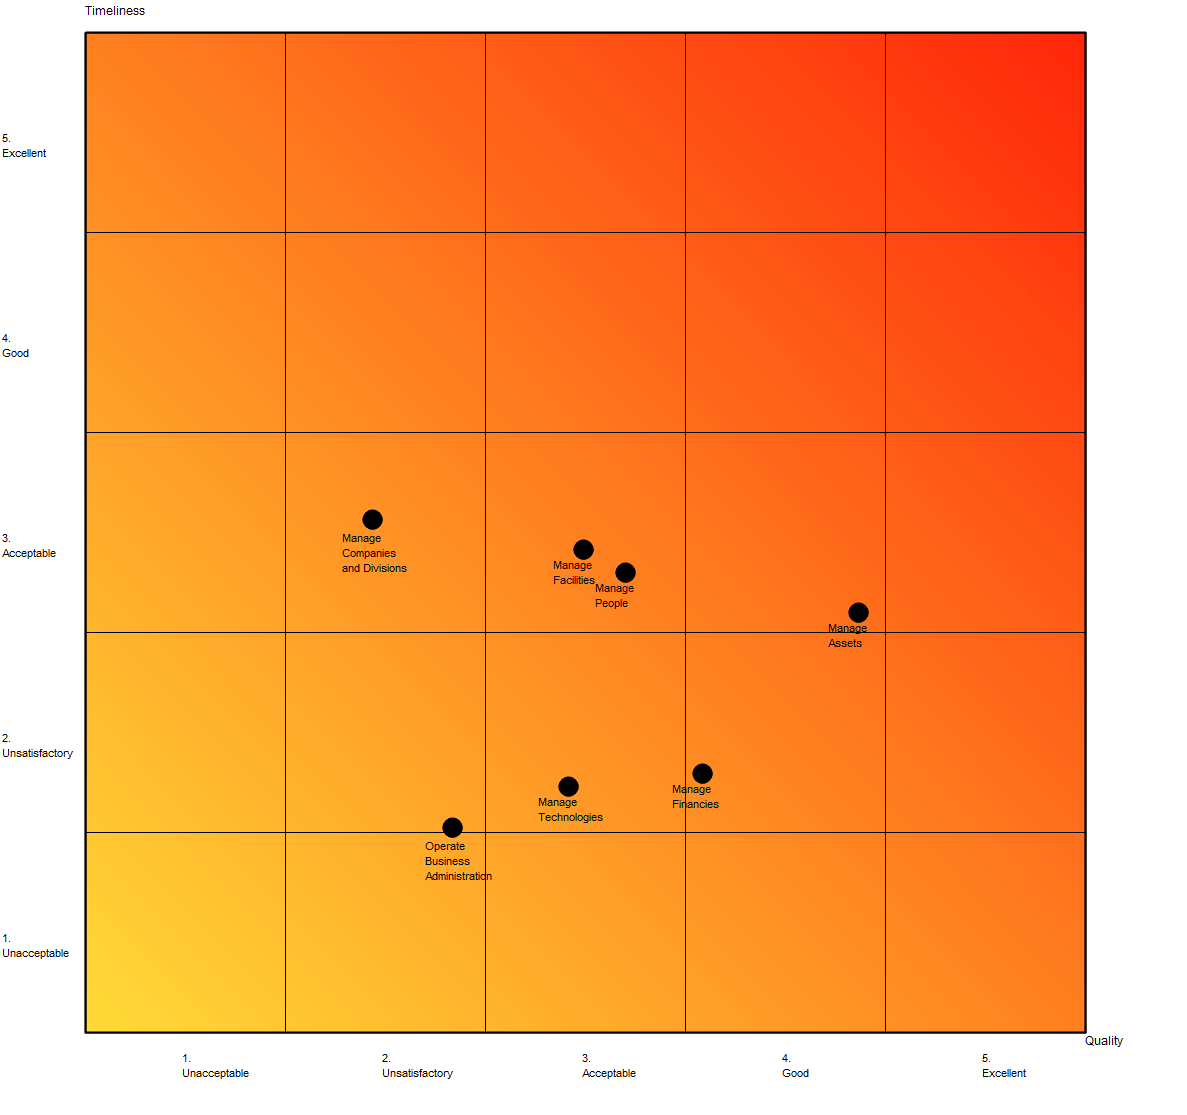
Core concerns: The Graphical Matrix is generated based on information inserted into its property dialog where input, x-axis and y-axis are defined. Below, you can see an example of a Graphical Matrix for capabilities, scoring their quality and timeliness:
Relation to other templates: When scoring risks and visualizing residual risks, you can use a Heatmap.
Properties and metadata: The Graphical Matrix template can for example retain the following information:
- A description
- Link to the source of the input
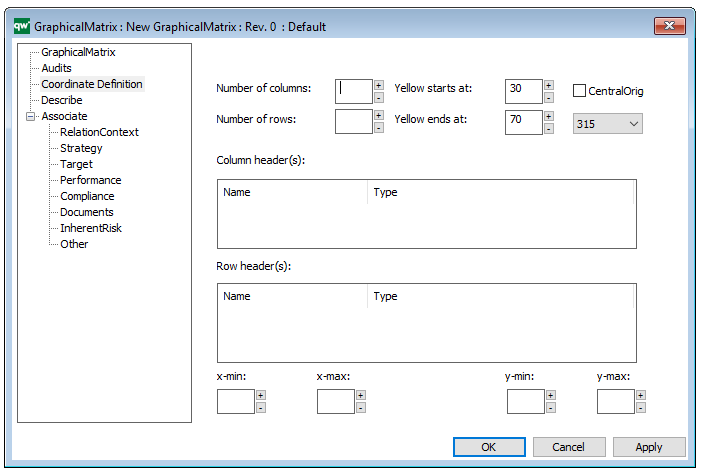
- Coordinate definitions of the Graphical Matrix
- Audits (auto generated information regarding its current state and access rights)
- Associated documents, diagrams and other objects
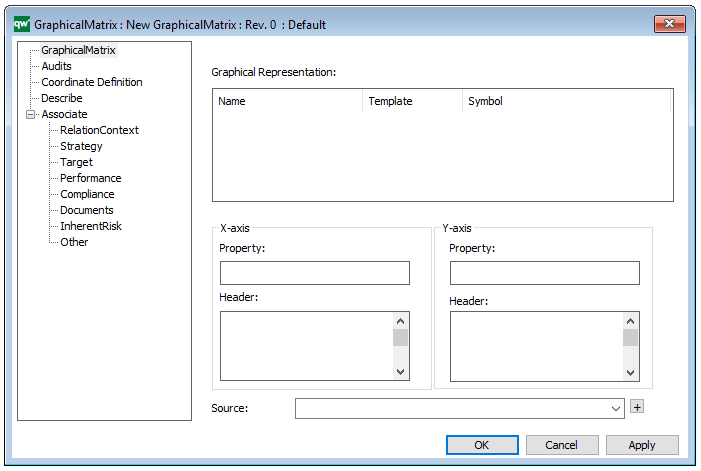
The above picture shows the properties dialogue window for the Graphical Matrix, where you can view and edit the diagram’s properties in QualiWare Lifecycle Manager. Below, you can see the tab for Coordinate Definition: