European Government Enterprise Architecture: Interoperability Architecture
European public-sector EA must deliver actionable recommendations and effective solution designs to support government demands for interoperability and digitalization.
Government Enterprise Architecture (GEA) in the European context has two major levels:
Each country’s own National GEA practice
European GEA practice
Strictly speaking, the European practice has not been called Enterprise Architecture per se, but was and is in all but name a Government Enterprise Architecture practice (“EA by stealth”).
It became the theme interoperability that caught the attention of the European Commission, who defines interoperability as the facilitation of cross-border and cross-sector information exchange, taking into account legal, organisational, semantic and technical aspects (source).
From IDA to ISA2
The Inter-Change of Data Between Administrations programme (IDA) was launched in 1995 and later became the Interoperable Delivery of European eGovernment Services to public Administrations, Businesses and Citizens programme (IDABC), which offered funding of some €25 million per year from 2004-2009 for various pan-European interoperability projects. One of these projects formulated the European Interoperability Framework v1, published in 2004, which provides recommendations and defines generic standards with regard to organizational, semantic and technical aspects of interoperability, offering a comprehensive set of principles for European cooperation in eGovernment. The framework was accompanied by the IDA Architecture Guidelines. Updated in 2010, the framework (now European Interoperability Framework v2) became part of the European Interoperability Strategy.
For continued work on European interoperability, a new programme was established in 2010: The ISA Programme, Interoperability Solutions for European Public Administrations:
Public administrations are expected to provide efficient public services to businesses and citizens across Europe. ISA, the programme on Interoperability Solutions for European Public Administrations, addresses this need. ISA supports and facilitates efficient and effective cross-border electronic collaboration between European public administrations. The programme enables the delivery of electronic public services and ensures the availability, interoperability, re-use and sharing of common solutions (source).
With a budget of €164 million for the period from 2010-2015, the ISA programme has established a number of action areas.
The ISA action on Interoperability architecture studies the possibility of structuring European public information systems and services around a joint architectural blueprint. This action develops together with the Member States and the relevant European Commission departments a joint vision for an Interoperability Architecture for European public services. This involves outlining its scope, deciding how the architectural building blocks will fit together, and determining the need for interface standards between such building blocks, tools and services that can be reused across borders and sectors, such as the following:
a multilingual service, CIRCABC provides private workspaces for collaborative groups to share information and documentation;
a Machine translation service can be used by European public administrations to facilitate efficient and effective electronic cross-border interaction;
the sTesta project provides a secure private European network for data exchange between all the EU Institutions and national networks.
ISA has further supported the development of interoperability-related recommendations for the assessment of standards and specifications used by Member States when acquiring electronic tools and services. The aim to create not only more interoperable information systems but also more efficient use of public funds via sharing and reuse of completed assessments among eGovernment projects. The National Interoperability Framework Observatory tries to help in the sharing, and collects/creates informative Member State Factsheets.
Conceptual Reference Architecture. This involves defining conceptual reference building blocks that are needed in order to build systems supporting public services. A conceptual reference architecture captures the fundamental patterns and concepts that should be applicable for all domains and more specific architectures.
Cartography. This involves mapping existing reusable solutions towards the conceptual reference building blocks. The cartography is meant to include solutions that are readily reusable.
European Interoperability Reference Architecture
The European Interoperability Reference Architecture (EIRA) is
an architecture content metamodel defining the most salient architectural building blocks (ABBs) needed to build interoperable e-Government systems.
On 8 June 2015, release 0.9.0 beta of the EIRA entered an eight-week public review period. Stakeholders working for public administrations in the field of architecture and interoperability were invited to provide feedback.
The EIRA is a four-view reference architecture for delivering interoperable digital public services across borders and sectors. It defines the required capabilities for promoting interoperability as a set of architecture building blocks (ABBs). The EIRA has four main characteristics:
Common terminology to achieve a minimum level of coordination: It provides a set of well-defined ABBs that provide a minimal common understanding of the most important building blocks needed to build interoperable public services.
Reference architecture for delivering digital public services: It offers a framework to categorise (re)usable solution building blocks (SBBs) of an e-Government solution. It allows portfolio managers to rationalise, manage and document their portfolio of solutions.
Technology- and product-neutral and a service-oriented architecture (SOA) style: The EIRA adopts a service-oriented architecture style and promotes ArchiMate as a modelling notation. In fact, the EIRA ABBs can be seen as an extension of the model concepts in ArchiMate.
Alignment with EIF and TOGAF: The EIRA is aligned with the European Interoperability Framework (EIF) and complies with the context given in the European Interoperability Strategy (EIS) . The views of the EIRA correspond to the interoperability levels in the EIF: legal, organisational, semantic and technical interoperability. Within TOGAF and the Enterprise Architecture Continuum, EIRA focuses on the architecture continuum. It re-uses terminology and paradigms from TOGAF such as architecture patterns, building blocks and views.
EIRA in one picture
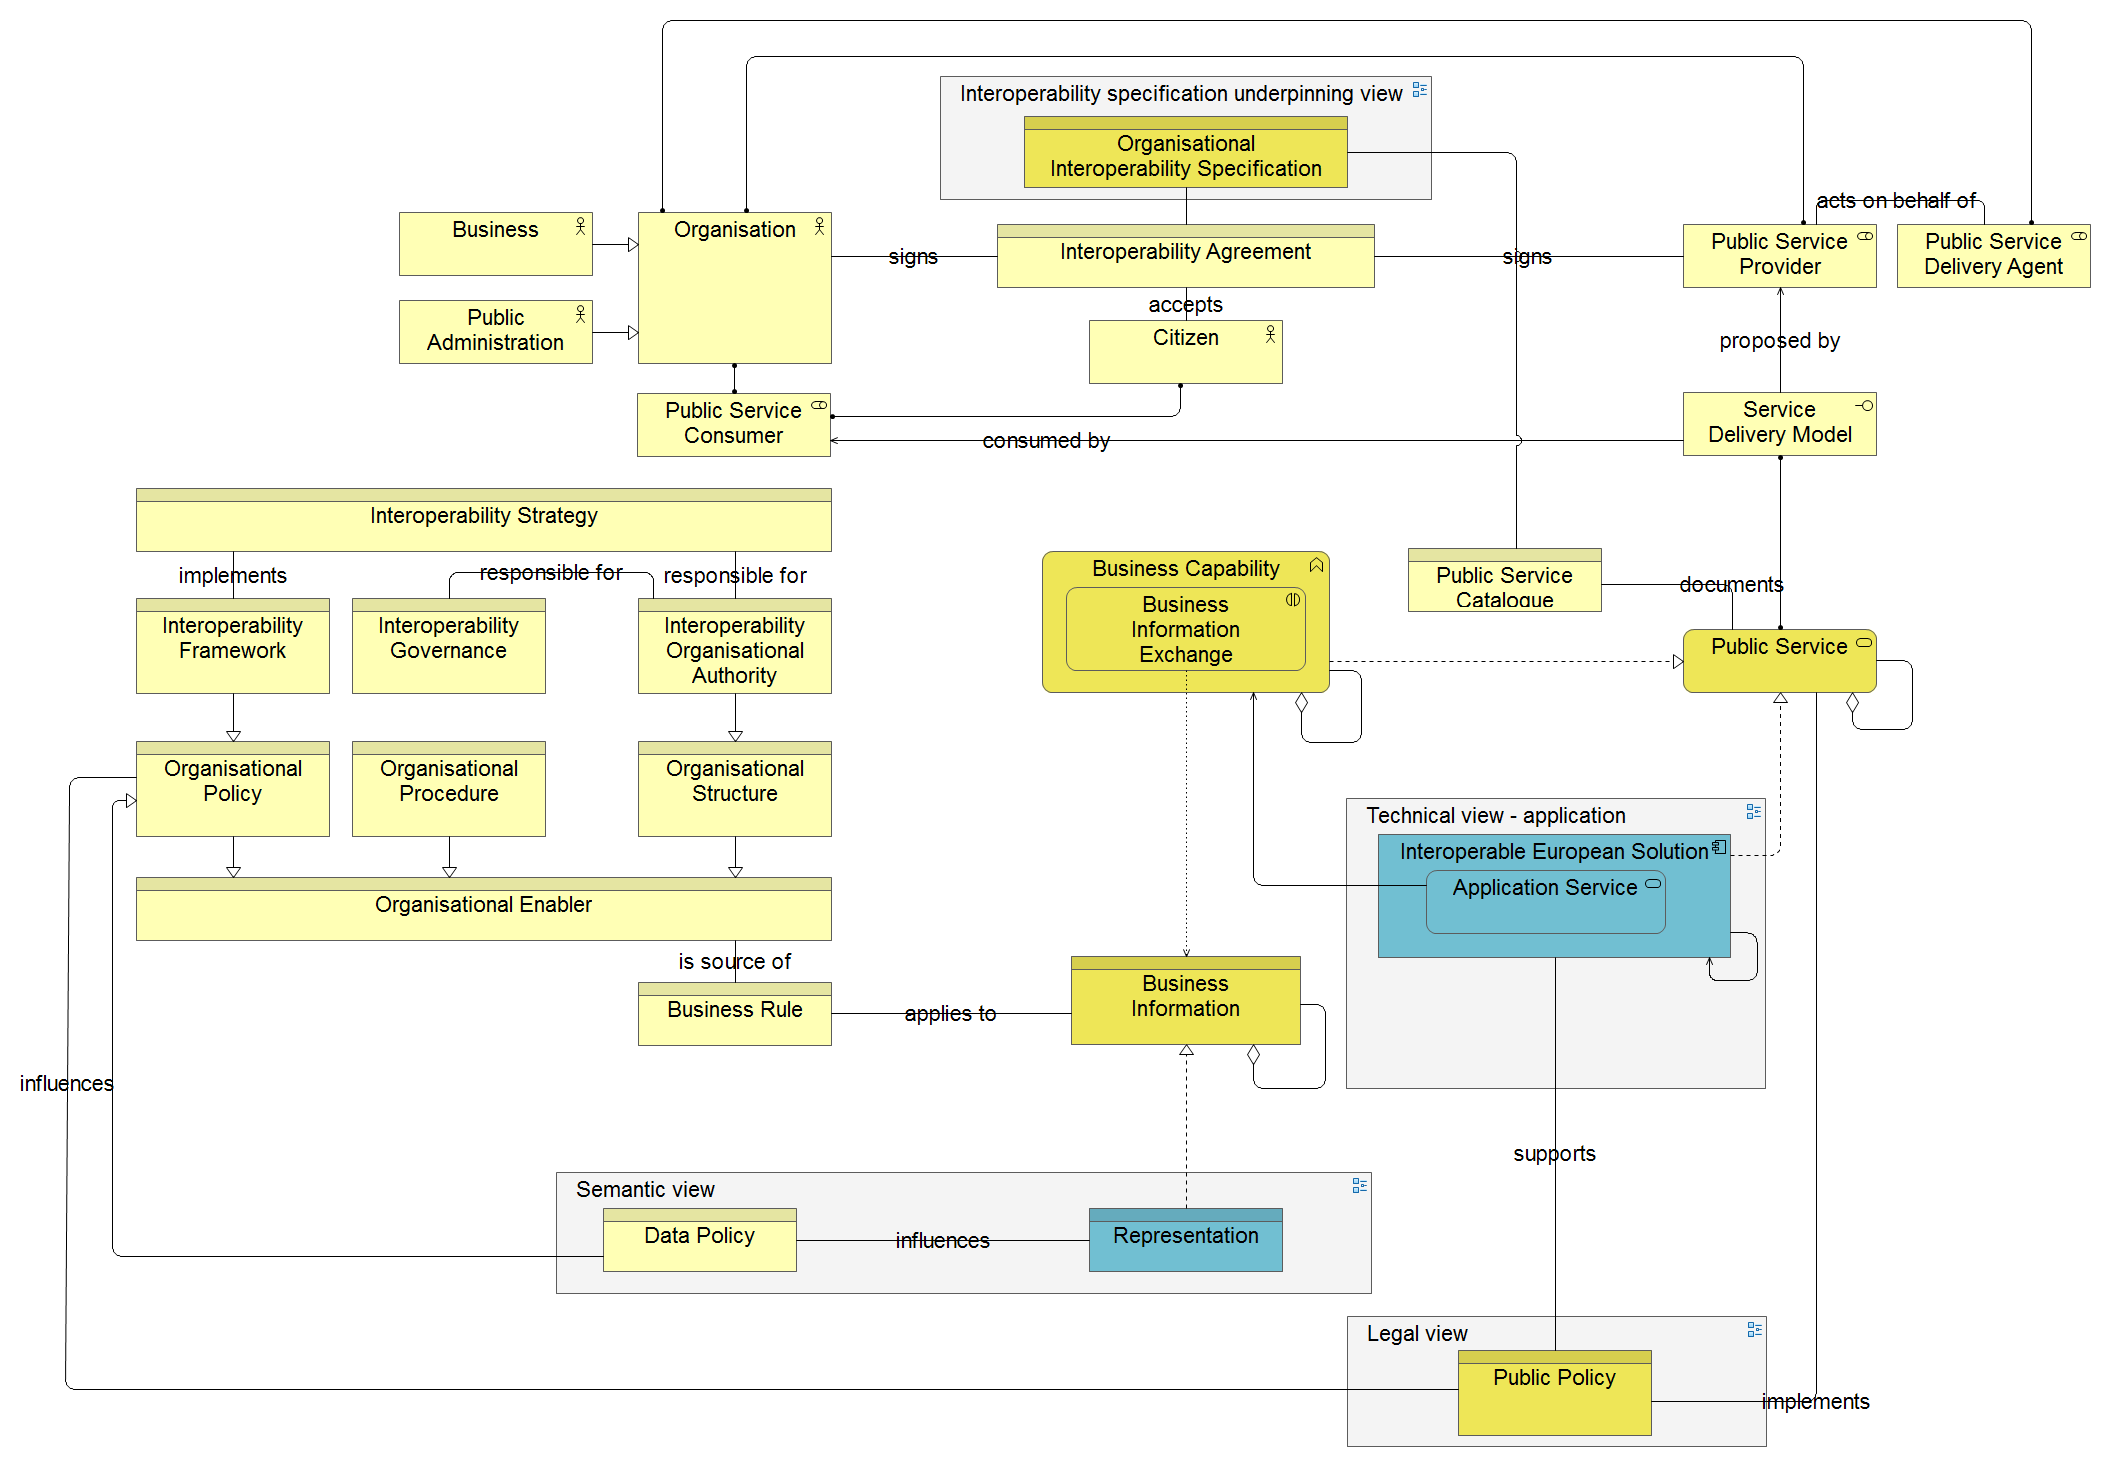
The figure below provides a high-level overview of the four views in EIRA. Each of the four views consists of a set of Architecture Building Blocks (ABBs) and relations pertaining to the legal, organisational, semantic and technical domain of an Interoperable European Architecture. Each view has entry and exit points from one view to another.
The legal, organisational, semantic and technical domains are the classic European interoperability concerns. The EIRA defines building blocks for each view.
In addition, a new Interoperability specification underpinning view has been added as an additional view, depicting architecture building blocks of the different views as a taxonomy of interoperability specifications:
The “metaview” detailing and specifying interoperability.
EIRAs raison d’etre?
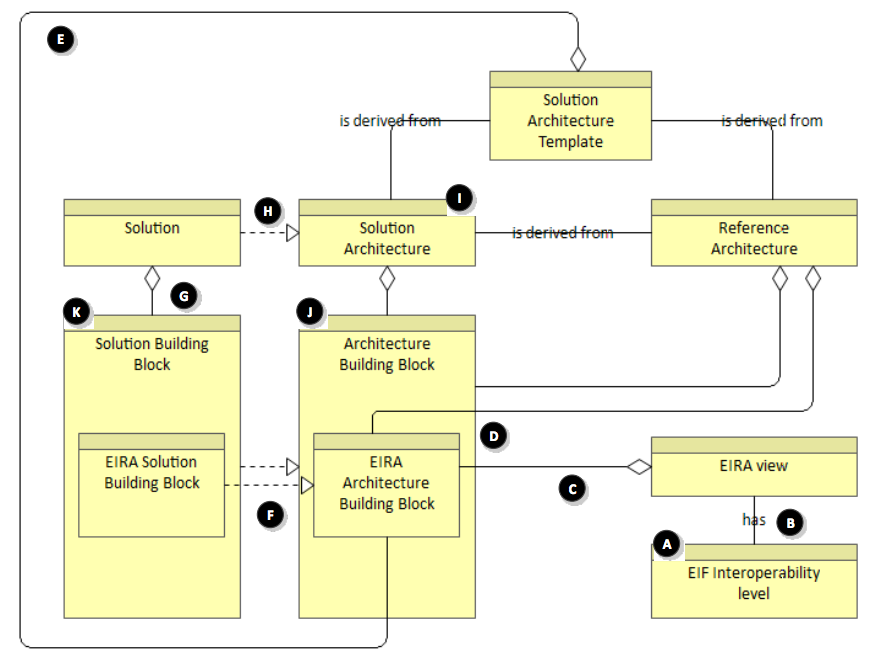
The key concepts of the EIRA and their relationships are described here:
The following list explains the different relationships:
A. The EIRA is derived from the European Interoperability Framework (EIF);
B. The EIRA has one view for each EIF interoperability level;
C. Each EIRA view contains several EIRA ABBs;
D. EIRA ABBs can be used to create reference architectures;
E. A SAT addresses a certain interoperability need. It consists of a sub-set of the most important EIRA ABBs and is derived from a reference architecture;
F. An EIRA SBB realizes one or more EIRA ABB;
G. A (interoperable) solution consists of one or more SBBs;
H. A (interoperable) solution realizes a solution architecture;
I. A solution architecture can be derived from a SAT or directly from a reference architecture;
J. As the EIRA focuses only on the most important ABBs needed for interoperability, other ABBs (= non-EIRA ABBs) can exist;
K. Similar to ABBs, non-EIRA SBBs can exist next to EIRA SBBs.
Release 0.9 of the EIRA does not provide as much detail about the SBBs as it does on the ABBs. This will be done in another project. Also see the SBB template document.
Further information about the EIRA can be obtained in the document ‘An introduction to the European Interoperability Reference Architecture v0.9.0’ (EIRA_v0.9.0_beta_overview.pdf). The release consists of the following release components:
EIRA_v0.9.0_beta_overview.pdf:PDF document containing an introduction to the EIRA, including its key concepts, used ArchiMate notation, tool support, and views.
EIRA_v0.9.0_beta_ABBs: An HTML file containing the definitions of the architecture building blocks.
EIRA lists 161 architecture building blocks. Of these, more than half are technical:
82 Technical View (27 Application and 55 Infrastructure)
26 Organisational View
19 Semantic View
18 Legal View
6 Interoperability View
10 Deprecated (11 if ABB59 Logging Service included – not marked in View:Deprecated but in Status).
The building blocks are described via selected archimate model concepts, of which four are used a lot:
40 archimate:ApplicationService
34 archimate:BusinessObject
26 archimate:ApplicationComponent
18 archimate:DataObject
Other model concepts are also used:
6 archimate:BusinessProcess
5 archimate:Contract
4 archimate:BusinessActor
3 archimate:BusinessRole
3 archimate:InfrastructureService
3 archimate:Network
3 archimate:Node
2 archimate:ApplicationInterface
1 archimate:BusinessFunction
1 archimate:BusinessInteraction
1 archimate:BusinessInterface
1 archimate:BusinessService
So, looking at the big picture, EIRA is perhaps a bit “heavy” on the technology side of interoperability, but does cover the four layers. In particular, EIRA establishes a set of views across the four layers. In doing so, it has to “embrace and extend” ArchiMate.
EIRA and ArchiMate
EIRAs commitment to ArchiMate is somewhat courageous. And somewhat creative, for example:
EIRAs Business Capability is covered by archimate:BusinessFunction
EIRAs Business Information Exchange is covered by archimate:BusinessInteraction
A Business Capability is the expression or the articulation of the capacity, materials and expertise an organization needs in order to perform core functions. Enterprise architects use business capabilities to illustrate the over-arching needs of the business in order to better strategize IT solutions that meet those business needs.
A Business Information Exchange is a piece of business data or a group of pieces of business data with a unique business semantics definition in a specific business context [ISO15000-5, UN/CEFACT CCTS].
These are work-arounds to two well-known ArchiMate limitations.
The archimate:BusinessObject is also quite busy, and for example covers these ABBs:
Business Rule
Business Information
Organisational Procedure
Organisational Structure
Again, work-arounds to current ArchiMate limitations.
EIRAs ABBs have changed with each release. Deprecated ABBs in the 0.9 beta include:
Business Process
Business Process Model
Business Transaction
Licensing and Charging Policy
Privacy Policy
Metadata Management Policy
Data Routing Service
Data Routing Component
Information Security Policy
Data Quality Policy
Logging Service?
So, Business Process and Business Process Model are deprecated, but the archimate:BusinessProcess model concept is used several times, namely for these ABBs:
Public Policy Cycle
Definition of Public Policy Objectives
Formulation of Public Policy Scenarios
Impact Assessment
Public Policy Implementation
Public Policy Evaluation
ArchiMate of course allows for a certain amount of flexibility (ArchiMate 2.1, Chapter 9 Language Extension Mechanisms), but the creativity can be dangerous, expecially in an interoperability context.
EIRA is an many ways ahead of ArchiMate. The challenge is that ArchiMate is under continuous development, and is likely to change on exactly these areas in future versions (see chapter 12.1 in the ArchiMate 2.1 spec). So EIRAs current notation standard should be seen as a temporary “fix”.
A note of caution
EIRA has obviously selected a winner of the longstanding Process vs Capability Debate. Eradicating processes is rather bold, and contrary to advice from experts like Roger Burlton, Paul Harmon, Alan Ramias and Andrew Spanyi, and Keith Swenson. While it is laudable to focus on capabilities, the use of capabilities should not be seen as an alternative to using processes and business process models. Both are needed.
From a maturity standpoint, this is only just acceptable. Even an Excel sheet version would be better, but better would be “raw data” available in a range of formats, possible as an api.
EIRA does not have any mapping to any other framework.
The Legal and the Organisational views are less conventional as architecture views go. The Semantic, Application (Technical) amd Infrastructure (Technical) views are classic architecture views in many EA frameworks. A comparison with established frameworks seems to be a good idea.
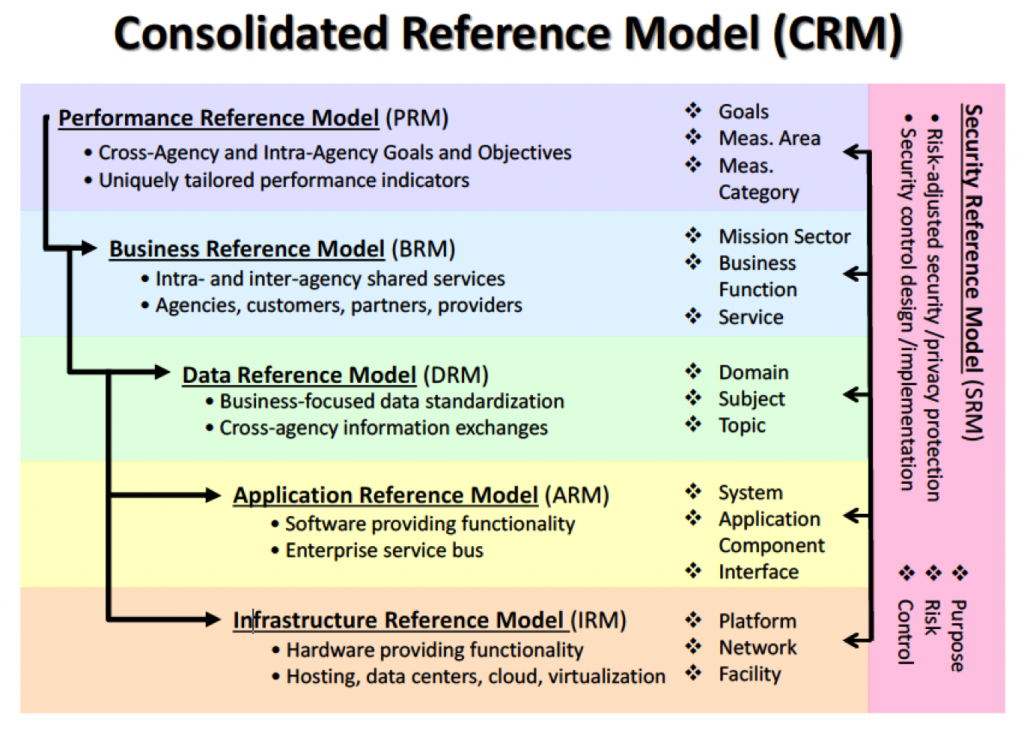
A key part of the US Federal Enterprise Architecture Framework Version 2 (FEAF-II) is the Consolidated Reference Model, which equips the US Federal Government and its Federal agencies with a common language and framework to describe and analyze investments. It consists of a set of interrelated reference models that describe the six sub-architecture domains in the framework:
Strategy
Business
Data
Applications
Infrastructure
Security
EIRAs Legal view is roughly equivalent to FEAF-IIs Strategy (Performance Reference Model), and EIRAs Organisational view roughly equivalent to FEAF-IIs Business Reference Model.
Contentwise, EIRA and FEAF-II use these two layers in different ways:
US FEAF-II Performance Reference ModelEU EIRA Legal Interoperability viewEIRAs organisational viewUS FEAF-II Business Reference Model
EIRAs model scope is wider than FEAF-IIs, but FEAF-II is more comprehensive as a classification scheme.
EIRA should consider taking inspiration from FEAF-II, and at least add a security view. If anything, such view should become mandatory for all European governments.
Towards EIRA 1.0
The 0.9 release of EIRA is a big step forward for reference architecture work in European governments.
QualiWare proposes a rapid consolidation and documentation process, and then releasing Version 1.0. EIRA should not await the next version of ArchiMate, but rather run with well-documented revision control.
QualiWare is committed to supporting international governments in their interoperability work. QualiWare fully supports using ArchiMate 2.1. If customer demand requires it, the “EIRA ArchiMate” approach can easily be supported.
John Gøtze will speak in the afternoon. His talk is about the EA3 approach to enterprise architecture, and how it relates to other EA approaches such as TOGAF.
TOGAF 35.6 introduces TOGAFs artifacts. The complete set of artifacts are illustrated like this:
Figure 35-3: Artifacts Associated with the Core Content Metamodel and Extensions
TOGAF defines three distinct artifact classes:
Catalogs are lists of building blocks.
Matrices show the relationships between building blocks of specific types.
Diagrams present building blocks plus their relationships and interconnections in a graphical way that supports effective stakeholder communication.
Catalogs (14 types):
Principles Catalog
Organization/Actor Catalog
Driver/Goal/Objective Catalog
Role Catalog
Business Service/Function Catalog
Location Catalog
Process/Event/Control/Product Catalog
Contract/Measure Catalog
Data Entity/Data Component Catalog
Application Portfolio Catalog
Interface Catalog
Technology Standards Catalog
Technology Portfolio Catalog
Requirements Catalog
Matrices (10 types)
Stakeholder Map Matrix
Business Interaction Matrix
Actor/Role Matrix
Data Entity/Business Function Matrix
Application/Data Matrix
Application/Organization Matrix
Role/Application Matrix
Application/Function Matrix
Application Interaction Matrix
Application/Technology Matrix
Diagrams (32 types)
Value Chain Diagram
Solution Concept Diagram
Business Footprint Diagram
Business Service/Information Diagram
Functional Decomposition Diagram
Product Lifecycle Diagram
Goal/Objective/Service Diagram
Business Use-Case Diagram
Organization Decomposition Diagram
Process Flow Diagram
Event Diagram
Conceptual Data Diagram
Logical Data Diagram
Data Dissemination Diagram
Data Security Diagram
Data Migration Diagram
Data Lifecycle Diagram
Application Communication Diagram
Application and User Location Diagram
Application Use-Case Diagram
Enterprise Manageability Diagram
Process/Application Realization Diagram
Software Engineering Diagram
Application Migration Diagram
Software Distribution Diagram
Environments and Locations Diagram
Platform Decomposition Diagram
Processing Diagram
Networked Computing/Hardware Diagram
Communications Engineering Diagram
Project Context Diagram
Benefits Diagram
TOGAF makes a distinction between the 56 artifacts and 21 deliverables:
Architecture Building Blocks
Architecture Contract
Architecture Definition Document
Architecture Principles
Architecture Repository
Architecture Requirements
Architecture Roadmap
Architecture Vision
Business Principles, Business Goals, and Business Drivers
Capability Assessment
Change Request
Communications Plan
Compliance Assessment
Implementation and Migration Plan
Implementation Governance Model
Organizational Model for Enterprise
Request for Architecture Work
Requirements Impact Assessment
Solution Building Blocks
Statement of Architecture Work
Tailored Architecture Framework
Some would argue that several if not all these deliverables are (also) artifacts.
TOGAF artifacts described
The individual TOGAF artifacts are listed and described here:
Principles Catalog
The Principles catalog captures principles of the business and architecture principles that describe what a “good” solution or architecture should look like. Principles are used to evaluate and agree an outcome for architecture decision points. Principles are also used as a tool to assist in architectural governance of change initiatives.
Stakeholder Map Matrix
The purpose of the Stakeholder Map matrix is to identify the stakeholders for the architecture engagement, their influence over the engagement, and their key questions, issues, or concerns that must be addressed by the architecture framework.
Value Chain Diagram
A Value Chain diagram provides a high-level orientation view of an enterprise and how it interacts with the outside world. In contrast to the more formal Functional Decomposition diagram developed within Phase B (Business Architecture), the Value Chain diagram focuses on presentational impact.
Solution Concept Diagram
A Solution Concept diagram provides a high-level orientation of the solution that is envisaged in order to meet the objectives of the architecture engagement. In contrast to the more formal and detailed architecture diagrams developed in the following phases, the solution concept represents a “pencil sketch” of the expected solution at the outset of the engagement. This diagram may embody key objectives, requirements, and constraints for the engagement and also highlight work areas to be investigated in more detail with formal architecture modeling.
Organization/Actor Catalog
The Organization/Actor catalog captures a definitive listing of all participants that interact with IT, including users and owners of IT systems. The Organization/Actor catalog can be referenced when developing requirements in order to test for completeness.
Driver/Goal/Objective Catalog
The Driver/Goal/Objective catalog provides a cross-organizational reference of how an organization meets its drivers in practical terms through goals, objectives, and (optionally) measures. Publishing a definitive breakdown of drivers, goals, and objectives allows change initiatives within the enterprise to identify synergies across the organization (e.g., multiple organizations attempting to achieve similar objectives), which in turn allow stakeholders to be identified and related change initiatives to be aligned or consolidated.
Role Catalog
The purpose of the Role catalog is to provide a listing of all authorization levels or zones within an enterprise. Frequently, application security or behavior is defined against locally understood concepts of authorization that create complex and unexpected consequences when combined on the user desktop. If roles are defined, understood, and aligned across organizations and applications, this allows for a more seamless user experience and generally more secure applications, as administrators do not need to resort to workarounds in order to enable users to carry out their jobs. In addition to supporting security definition for the enterprise, the Role catalog also forms a key input to identifying organizational change management impacts, defining job functions, and executing end-user training. As each role implies access to a number of business functions, if any of these business functions are impacted, then change management will be required, organizational responsibilities may need to be redefined, and retraining may be needed.
Business Service/Function Catalog
The Business Service/Function catalog provides a functional decomposition in a form that can be filtered, reported on, and queried, as a supplement to graphical Functional Decomposition diagrams. The Business Service/Function catalog can be used to identify capabilities of an organization and to understand the level that governance is applied to the functions of an organization. This functional decomposition can be used to identify new capabilities required to support business change or may be used to determine the scope of change initiatives, applications, or technology components.
Location Catalog
The Location catalog provides a listing of all locations where an enterprise carries out business operations or houses architecturally relevant assets, such as data centers or end-user computing equipment. Maintaining a definitive list of locations allows change initiatives to quickly define a location scope and to test for completeness when assessing current landscapes or proposed target solutions. For example, a project to upgrade desktop operating systems will need to identify all locations where desktop operating systems are deployed. Similarly, when new systems are being implemented, a diagram of locations is essential in order to develop appropriate deployment strategies that comprehend both user and application location and identify location-related issues, such as internationalization, localization, timezone impacts on availability, distance impacts on latency, network impacts on bandwidth, and access.
Process/Event/Control/Product Catalog
The Process/Event/Control/Product catalog provides a hierarchy of processes, events that trigger processes, outputs from processes, and controls applied to the execution of processes. This catalog provides a supplement to any Process Flow diagrams that are created and allows an enterprise to filter, report, and query across organizations and processes to identify scope, commonality, or impact. For example, the Process/Event/Control/Product catalog allows an enterprise to see relationships of processes to sub-processes in order to identify the full chain of impacts resulting from changing a high-level process.
Contract/Measure Catalog
The Contract/Measure catalog provides a listing of all agreed service contracts and (optionally) the measures attached to those contracts. It forms the master list of service levels agreed to across the enterprise.
Business Interaction Matrix
The Business Interaction matrix depicts the relationship interactions between organizations and business functions across the enterprise. Understanding business interaction of an enterprise is important as it helps to highlight value chain and dependencies across organizations.
Actor/Role Matrix
The Actor/Role matrix shows which actors perform which roles, supporting definition of security and skills requirements. Understanding Actor-to-Role relationships is a key supporting tool in definition of training needs, user security settings, and organizational change management.
Business Footprint Diagram
A Business Footprint diagram describes the links between business goals, organizational units, business functions, and services, and maps these functions to the technical components delivering the required capability. A Business Footprint diagram provides a clear traceability between a technical component and the business goal that it satisfies, while also demonstrating ownership of the services identified. A Business Footprint diagram demonstrates only the key facts linking organization unit functions to delivery services and is utilized as a communication platform for senior-level (CxO) stakeholders.
Business Service/Information Diagram
The Business Service/Information diagram shows the information needed to support one or more business services. The Business Service/Information diagram shows what data is consumed by or produced by a business service and may also show the source of information. The Business Service/Information diagram shows an initial representation of the information present within the architecture and therefore forms a basis for elaboration and refinement.
Functional Decomposition Diagram
The purpose of the Functional Decomposition diagram is to show on a single page the capabilities of an organization that are relevant to the consideration of an architecture. By examining the capabilities of an organization from a functional perspective, it is possible to quickly develop models of what the organization does without being dragged into extended debate on how the organization does it. Once a basic Functional Decomposition diagram has been developed, it becomes possible to layer heat-maps on top of this diagram to show scope and decisions. For example, the capabilities to be implemented in different phases of a change program.
Product Lifecycle Diagram
The purpose of the Product Lifecycle diagram is to assist in understanding the lifecycles of key entities within the enterprise. Understanding product lifecycles is becoming increasingly important with respect to environmental concerns, legislation, and regulation where products must be tracked from manufacture to disposal. Equally, organizations that create products that involve personal or sensitive information must have a detailed understanding of the product lifecycle during the development of Business Architecture in order to ensure rigor in design of controls, processes, and procedures. Examples of this would include credit cards, debit cards, store/loyalty cards, smart cards, user identity credentials (identity cards, passports, etc.).
Goal/Objective/Service Diagram
The purpose of a Goal/Objective/Service diagram is to define the ways in which a service contributes to the achievement of a business vision or strategy. Services are associated with the drivers, goals, objectives, and measures that they support, allowing the enterprise to understand which services contribute to similar aspects of business performance. The Goal/Objective/Service diagram also provides qualitative input on what constitutes high performance for a particular service.
Business Use-Case Diagram
A Business Use-Case diagram displays the relationships between consumers and providers of business services. Business services are consumed by actors or other business services and the Business Use-Case diagram provides added richness in describing business capability by illustrating how and when that capability is used. The purpose of the Business Use-Case diagram is to help to describe and validate the interaction between actors and their roles to processes and functions. As the architecture progresses, the use-case can evolve from the business level to include data, application, and technology details. Architectural business use-cases can also be re-used in systems design work.
Organization Decomposition Diagram
An Organization Decomposition diagram describes the links between actor, roles, and location within an organization tree. An organization map should provide a chain of command of owners and decision-makers in the organization. Although it is not the intent of the Organization Decomposition diagram to link goal to organization, it should be possible to intuitively link the goals to the stakeholders from the Organization Decomposition diagram.
Process Flow Diagram
The Process Flow diagram depicts all models and mappings related to the process metamodel entity. Process Flow diagrams show sequential flow of control between activities and may utilize swim-lane techniques to represent ownership and realization of process steps. For example, the application that supports a process step may be shown as a swim-lane. In addition to showing a sequence of activity, process flows can also be used to detail the controls that apply to a process, the events that trigger or result from completion of a process, and also the products that are generated from process execution. Process Flow diagrams are useful in elaborating the architecture with subject specialists, as they allow the specialist to describe “how the job is done” for a particular function. Through this process, each process step can become a more fine-grained function and can then in turn be elaborated as a process.
Event Diagram
The Event diagram depicts the relationship between events and process. Certain events – such as arrival of certain information (e.g., customer submits sales order) or a certain point in time (e.g., end of fiscal quarter) – cause work and certain actions need to be undertaken within the business. These are often referred to as “business events” or simply “events” and are considered as triggers for a process. It is important to note that the event has to trigger a process and generate a business response or result.
Data Entity/Data Component Catalog
The purpose of the Data Entity/Data Component catalog is to identify and maintain a list of all the data use across the enterprise, including data entities and also the data components where data entities are stored. An agreed Data Entity/Data Component catalog supports the definition and application of information management and data governance policies and also encourages effective data sharing and re-use.
Data Entity/Business Function Matrix
The purpose of the Data Entity/Business Function matrix is to depict the relationship between data entities and business functions within the enterprise. Business functions are supported by business services with explicitly defined boundaries and will be supported and realized by business processes. The mapping of the Data Entity-Business Function relationship enables the following to take place:
Assign ownership of data entities to organizations
Understand the data and information exchange requirements business services
Support the gap analysis and determine whether any data entities are missing and need to be created
Define application of origin, application of record, and application of reference for data entities
Enable development of data governance programs across the enterprise (establish data steward, develop data standards pertinent to the business function, etc.)
Application/Data Matrix
The purpose of the Application/Data matrix is to depict the relationship between applications (i.e., application components) and the data entities that are accessed and updated by them. Applications will create, read, update, and delete specific data entities that are associated with them. For example, a CRM application will create, read, update, and delete customer entity information. The data entities in a package/packaged services environment can be classified as master data, reference data, transactional data, content data, and historical data. Applications that operate on the data entities include transactional applications, information management applications, and business warehouse applications. The Application/Data matrix is a two-dimensional table with Logical Application Component on one axis and Data Entity on the other axis.
Conceptual Data Diagram
The key purpose of the Conceptual Data diagram is to depict the relationships between critical data entities within the enterprise. This diagram is developed to address the concerns of business stakeholders. Techniques used include Entity Relationship models and simplified UML class diagrams.
Logical Data Diagram
The key purpose of the Logical Data diagram is to show logical views of the relationships between critical data entities within the enterprise. This diagram is developed to address the concerns of Application developers and Database designers.
Data Dissemination Diagram
The purpose of the Data Dissemination diagram is to show the relationship between data entity, business service, and application components. The diagram shows how the logical entities are to be physically realized by application components. This allows effective sizing to be carried out and the IT footprint to be refined. Moreover, by assigning business value to data, an indication of the business criticality of application components can be gained. Additionally, the diagram may show data replication and application ownership of the master reference for data. In this instance, it can show two copies and the master-copy relationship between them. This diagram can include services; that is, services encapsulate data and they reside in an application, or services that reside on an application and access data encapsulated within the application.
Data Security Diagram
Data is considered as an asset to the enterprise and data security simply means ensuring that enterprise data is not compromised and that access to it is suitably controlled. The purpose of the Data Security diagram is to depict which actor (person, organization, or system) can access which enterprise data. This relationship can be shown in a matrix form between two objects or can be shown as a mapping. The diagram can also be used to demonstrate compliance with data privacy laws and other applicable regulations (HIPAA, SOX, etc). This diagram should also consider any trust implications where an enterprise’s partners or other parties may have access to the company’s systems, such as an outsourced situation where information may be managed by other people and may even be hosted in a different country.
Data Migration Diagram
Data migration is critical when implementing a package or packaged service-based solution. This is particularly true when an existing legacy application is replaced with a package or an enterprise is to be migrated to a larger packages/packaged services footprint. Packages tend to have their own data model and during data migration the legacy application data may need to be transformed prior to loading into the package.
Data Lifecycle Diagram
The Data Lifecycle diagram is an essential part of managing business data throughout its lifecycle from conception until disposal within the constraints of the business process. The data is considered as an entity in its own right, decoupled from business process and activity. Each change in state is represented on the diagram which may include the event or rules that trigger that change in state. The separation of data from process allows common data requirements to be identified which enables resource sharing to be achieved more effectively.
Application Portfolio Catalog
The purpose of this catalog is to identify and maintain a list of all the applications in the enterprise. This list helps to define the horizontal scope of change initiatives that may impact particular kinds of applications. An agreed Application Portfolio allows a standard set of applications to be defined and governed. The Application Portfolio catalog provides a foundation on which to base the remaining matrices and diagrams. It is typically the start point of the Application Architecture phase.
Interface Catalog
The purpose of the Interface catalog is to scope and document the interfaces between applications to enable the overall dependencies between applications to be scoped as early as possible. Applications will create, read, update, and delete data within other applications; this will be achieved by some kind of interface, whether via a batch file that is loaded periodically, a direct connection to another application’s database, or via some form of API or web service.
Application/Organization Matrix
The Application/Organization matrix depicts the relationship between applications and organizational units within the enterprise. Business functions are performed by organizational units. Some of the functions and services performed by those organizational units will be supported by applications. The mapping of the Application Component-Organization Unit relationship supports the gap analysis and determine whether any of the applications are missing and as a result need to be created. The Application/Organization matrix is a two-dimensional table with Logical/Physical Application Component on one axis and Organization Unit on the other axis.
Role/Application Matrix
The Role/Application matrix depicts the relationship between applications and the business roles that use them within the enterprise. People in an organization interact with applications. During this interaction, these people assume a specific role to perform a task; for example, product buyer.
The Role/Application matrix is a two-dimensional table with Logical Application Component on one axis and Role on the other axis.
Application/Function Matrix
The purpose of the Application/Function matrix is to depict the relationship between applications and business functions within the enterprise. Business functions are performed by organizational units. Some of the business functions and services will be supported by applications. The Application/Function matrix is a two-dimensional table with Logical Application Component on one axis and Function on the other axis.
Application Interaction Matrix
The Application Interaction matrix depicts communications relationships between applications. The mapping of the application interactions shows in matrix form the equivalent of the Interface Catalog or an Application Communication diagram. The Application Interaction matrix is a two-dimensional table with Application Service, Logical Application Component, and Physical Application Component on both the rows and the columns of the table.
Application Communication Diagram
The purpose of the Application Communication diagram is to depict all models and mappings related to communication between applications in the metamodel entity. It shows application components and interfaces between components. Interfaces may be associated with data entities where appropriate. Applications may be associated with business services where appropriate. Communication should be logical and should only show intermediary technology where it is architecturally relevant.
Application and User Location Diagram
The Application and User Location diagram shows the geographical distribution of applications. It can be used to show where applications are used by the end user; the distribution of where the host application is executed and/or delivered in thin client scenarios; the distribution of where applications are developed, tested, and released; etc. Analysis can reveal opportunities for rationalization, as well as duplication and/or gaps.
Application Use-Case Diagram
An Application Use-Case diagram displays the relationships between consumers and providers of application services. Application services are consumed by actors or other application services and the Application Use-Case diagram provides added richness in describing application functionality by illustrating how and when that functionality is used. Application use-cases can also be re-used in more detailed systems design work.
Enterprise Manageability Diagram
The Enterprise Manageability diagram shows how one or more applications interact with application and technology components that support operational management of a solution. This diagram is really a filter on the Application Communication diagram, specifically for enterprise management class software. Analysis can reveal duplication and gaps, and opportunities in the IT service management operation of an organization.
Process/Application Realization Diagram
The purpose of the Process/Application Realization diagram is to clearly depict the sequence of events when multiple applications are involved in executing a business process. It enhances the Application Communication diagram by augmenting it with any sequencing constraints, and hand-off points between batch and real-time processing. It would identify complex sequences that could be simplified, and identify possible rationalization points in the architecture in order to provide more timely information to business users. It may also identify process efficiency improvements that may reduce interaction traffic between applications.
Software Engineering Diagram
The Software Engineering diagram breaks applications into packages, modules, services, and operations from a development perspective. It enables more detailed impact analysis when planning migration stages, and analyzing opportunities and solutions. It is ideal for application development teams and application management teams when managing complex development environments.
Application Migration Diagram
The Application Migration diagram identifies application migration from baseline to target application components. It enables a more accurate estimation of migration costs by showing precisely which applications and interfaces need to be mapped between migration stages. It would identify temporary applications, staging areas, and the infrastructure required to support migrations (for example, parallel run environments, etc).
Software Distribution Diagram
The Software Distribution diagram shows how application software is structured and distributed across the estate. It is useful in systems upgrade or application consolidation projects. This diagram shows how physical applications are distributed across physical technology and the location of that technology. This enables a clear view of how the software is hosted, but also enables managed operations staff to understand how that application software is maintained once installed.
Technology Standards Catalog
The Technology Standards catalog documents the agreed standards for technology across the enterprise covering technologies, and versions, the technology lifecycles, and the refresh cycles for the technology. Depending upon the organization, this may also include location or business domain-specific standards information. This catalog provides a snapshot of the enterprise standard technologies that are or can be deployed, and also helps identify the discrepancies across the enterprise. If technology standards are currently in place, apply these to the Technology Portfolio catalog to gain a baseline view of compliance with technology standards.
Technology Portfolio Catalog
The purpose of this catalog is to identify and maintain a list of all the technology in use across the enterprise, including hardware, infrastructure software, and application software. An agreed technology portfolio supports lifecycle management of technology products and versions and also forms the basis for definition of technology standards. The Technology Portfolio catalog provides a foundation on which to base the remaining matrices and diagrams. It is typically the start point of the Technology Architecture phase. Technology registries and repositories also provide input into this catalog from a baseline and target perspective. Technologies in the catalog should be classified against the TOGAF Technology Reference Model (TRM) – see Part VI, 43. Foundation Architecture: Technical Reference Model – extending the model as necessary to fit the classification of technology products in use.
Application/Technology Matrix
The Application/Technology matrix documents the mapping of applications to technology platform. This matrix should be aligned with and complement one or more platform decomposition diagrams.
Environments and Locations Diagram
The Environments and Locations diagram depicts which locations host which applications, identifies what technologies and/or applications are used at which locations, and finally identifies the locations from which business users typically interact with the applications. This diagram should also show the existence and location of different deployment environments, including non-production environments, such as development and pre production.
Platform Decomposition Diagram
The Platform Decomposition diagram depicts the technology platform that supports the operations of the Information Systems Architecture. The diagram covers all aspects of the infrastructure platform and provides an overview of the enterprise’s technology platform. The diagram can be expanded to map the technology platform to appropriate application components within a specific functional or process area. This diagram may show details of specification, such as product versions, number of CPUs, etc. or simply could be an informal “eye-chart” providing an overview of the technical environment. Depending upon the scope of the enterprise architecture work, additional technology cross-platform information (e.g., communications, telco, and video information) may be addressed.
Processing Diagram
The Processing diagram focuses on deployable units of code/configuration and how these are deployed onto the technology platform. A deployment unit represents grouping of business function, service, or application components. The organization and grouping of deployment units depends on separation concerns of the presentation, business logic, and data store layers and service-level requirements of the components. Deployment units are deployed on either dedicated or shared technology components (workstation, web server, application server, or database server, etc.). It is important to note that technology processing can influence and have implications on the services definition and granularity.
Networked Computing/Hardware Diagram
Starting with the transformation to client-server systems from mainframes and later with the advent of e-Business and J2EE, large enterprises moved predominantly into a highly network-based distributed network computing environment with firewalls and demilitarized zones. Currently, most of the applications have a web front-end and, looking at the deployment architecture of these applications, it is very common to find three distinct layers in the network landscape; namely a web presentation layer, an business logic or application layer, and a back-end data store layer. It is a common practice for applications to be deployed and hosted in a shared and common infrastructure environment. So it becomes highly critical to document the mapping between logical applications and the technology components (e.g., server) that supports the application both in the development and production environments. The purpose of this diagram is to show the “as deployed” logical view of logical application components in a distributed network computing environment. The scope of the diagram can be appropriately defined to cover a specific application, business function, or the entire enterprise. If chosen to be developed at the enterprise level, then the network computing landscape can be depicted in an application agnostic way as well.
Communications Engineering Diagram
The Communications Engineering diagram describes the means of communication – the method of sending and receiving information – between these assets in the Technology Architecture; insofar as the selection of package solutions in the preceding architectures put specific requirements on the communications between the applications. The Communications Engineering diagram will take logical connections between client and server components and identify network boundaries and network infrastructure required to physically implement those connections. It does not describe the information format or content, but will address protocol and capacity issues.
Project Context Diagram
A Project Context diagram shows the scope of a work package to be implemented as a part of a broader transformation roadmap. The Project Context diagram links a work package to the organizations, functions, services, processes, applications, data, and technology that will be added, removed, or impacted by the project. The Project Context diagram is also a valuable tool for project portfolio management and project mobilization.
Benefits Diagram
The Benefits diagram shows opportunities identified in an architecture definition, classified according to their relative size, benefit, and complexity. This diagram can be used by stakeholders to make selection, prioritization, and sequencing decisions on identified opportunities.
Requirements Catalog
The Requirements catalog captures things that the enterprise needs to do to meet its objectives. Requirements generated from architecture engagements are typically implemented through change initiatives identified and scoped during Phase E (Opportunities & Solutions). Requirements can also be used as a quality assurance tool to ensure that a particular architecture is fit-for-purpose (i.e., can the architecture meet all identified requirements).
With the rampant global expansion of IT shriking the planet and breaking down the rules for business models, modern enterprises are facing new challenges. Their enterprise strategies and business requirements have changed significantly. At one end of the spectrum, they have at their disposal multitude of paths to choose for growth, and on the other, they have large inventory of isolated and out-of-context legacy that weighsd own on resources. With the requirement of speed becoming ever so important, enterprises need to architect themselves into a seamlessly integrated form that enables the enterprise to grow in accordance with an overall vision. The enterprises need methodology to develop to realize this overall architecture vision [MSD]. This is the offering of enterprise architecture.
Enterprise architecture is a complete expression of the enterprise: collaborating goals, visions, strategies, business operations, organization structures, process and data [SCH]. It is a meta-model, complete with architecture framework, methodology, best practices, and governance frameworks. EA attempts to be an overarching ‘meta-approach’ that models and ties together all the best approaches of the enterprise [BER]. EA attempts to optimize the legacy and new processes by bringing them under an integrated environment, and by breaking silos that might exist in the organization [GRI].
The EA Approaches
The modern enterprises are complicated. They comprise of organizations, lines of businesses, functional segments, business units; sometimes, even external entities are tightly interwoven or coupled into the various business units. In such a scenario, an enterprise’s goal would be to have a mature, broad, and hierarchical architecture, which incorporates all of the enterprise’s aspects.
To deal with the complexity and chaos of streamlining and smoothly operating a business, EA has become quintessential. EA is a meta-model complete with architecture framework, methodology, best practices, and governance framework. EA attempts to be an overarching ‘meta-approach’ that models and ties together all the best approaches of the enterprise [BER]. EA attempts to optimize the legacy and new processes by bringing them under an integrated environment. These EA attributes create flexibility for change, and make technology supportive of the strategy.
Over the past thirty years, many EA frameworks have been defined and developed: some through consortia (TOGAF, RM-ODP, GERAM, etc.,) some by the Department of Defense (DoDAF, FIAF, etc.,) and a few individual efforts (Zachman, EA3, etc.) This article focuses on two of these approaches. TOGAF is an EA approach that stems from TAFIM, a US government research project, which is heavily used in the industry, and has evolved from years of usage and experience. The EA3 is an EA architecture approach that comes with solid theory from the academia, and years of author’s personal experience, both on field, and as a key contributor of FEAF-II.
EA3
The EA3 is an open enterprise architecture framework that was developed in 2004 by Dr. Scott Bernard. The framework is designed as a cube, with some key ideas:
Hierarchies are needed to avoid disjunct sub-architectures.
Defining common methodology and repository for enterprise allows the enterprise’s technology to be driven by business changes, and business to be driven by strategic decisions.
Enforcing common principles to all the different types and segments of the enterprise is useful.
Enabling smooth information flow is quintessential for growth.
Allowing outcomes to be measured is advantageous: as a form of feedback process for future work, estimating ROI, capital planning, et.c,.
The EA3 is based on the primary function of organizing and planning IT resources and documentation of the Enterprise Architecture. The EA3 attempts to track and manage the assets across the enterprise; additionally, it also structures them by lines of businesses and functional units as well [SWE].
TOGAF
TOGAF (The Open Group Architecture Framework) is an EA approach developed by The Open Group. It comprises of a detailed method and a set of supporting tools for developing enterprise architecture. TOGAF is designed with the key idea to allow an IT enabled enterprise to streamline business requirements and directions to periodically drive the IT. TOGAF understands that an EA supports the business by providing the fundamental technology and process structure for an IT strategy. TOGAF also focuses on reuse of entire architectures to the largest extent possible, by providing a rich library of architectures – varying from the ones most specific to the domain, to very generic architectures. TOGAF draws upon its years of existence and continuously building library of frameworks that can adopted as is, or tailored to meet the needs of the enterprise.
EA Space
An enterprise architecture approach should provide
a methodology to create an architecture for an enterprise
a frameworka structure/set of structures for developing the architecture
artifacts, that describe various aspects of the architecture, and hence form the unit of knowledge
common diction for standardization across the enterprise
ways to assess existing capability, maturity and measure outcomes
reference models, set of reusable tools for building the architecture
Both EA3 and TOGAF lay emphasis on most of these, but structure them differently.
The clear demarcation of various elements of EA can be understood by looking at the EA3‘s definition of EA.
EA3 structures all these, and places these inside a governance boundary to enable smooth execution of EA work. For comparing the two, we will follow this model, and focus on the Methodology, Framework, Artifacts, Repository and Governance aspects of the EA in both approaches.
TOGAF’s structure of EA places emphasis on how these various structures revolve around IT.
TOGAF’s EA approach focuses on process and content, with the business drivers and vision driving the future, and the current state of the enterprise reflected by business capabilities. The TOGAF is built as a capability framework, where current capabilities are measured, required capabilities are discovered and IT projects spun off to complete the work.
The rest of this paper attempts to compare the two with respect to their different strengths and weakness of being a complete and comprehensive EA approach.
Methodology
Methodology is a generic term that can describe any structured approach for solving some, or all, of the problems in a particular problem space. Specifically, Methodology of an EA approach identifies the particular steps that establish a new EA program, and implement the documentation method specified by the approach.
Neglecting the details, both EA3 and TOGAF target the enterprise architecture methodology to be driven by analyzing the existing architecture, identifying the target architecture, and identifying the gaps. The next steps also aim at plotting a course from existing to target architecture fulfilling the gaps, and following the course.
EA3 Methodology
EA3‘s methodology is a 20 step process, segmented into four phases. The highlight of the methodology is the inclusion of a higher-order business direction, the strategy of the enterprise.
The initial phase is the establishment of an EA Program. This involves the steps required to identify the executive committee for the EA (possibly an architecture board with a chief architect,) and the stakeholders for the EA (who would benefit from EA, and hence would fund the EA efforts.) This requires a buy in from stakeholders and the management. The actual methodology is tailored in this phase adapting to the needs of the enterprise. The phase also identifies and establishes the channels of communication and feedback between every department and role of the EA effort – from the executives of the enterprise to the individual teams.
The second phase is the process of selection of EA Framework and Tools. The EA3 is flexible enough to accommodate external frameworks, and pick tools from existing solutions of the organization. The phase also deals with identifying the lines of business and various segments of the enterprise. The initial version of an architecture repository (possibly The Living Enterprise) is established in this phase.
The phase III deals with documentation of the EA process. As the first step of this phase, the existing architecture is identified, evaluated, documented, and brought into the architecture repository. The next step is to create several business and technology operating scenarios. This brings intuition about the future of the entire enterprise into the EA methodology. The phase also emphasizes on software applications and tools that can support automated EA documentation.
The final phase of the EA3‘s methodology is the actual use and maintenance of EA by the enterprise. This phase is the actual implementation phase, where the documentation and knowledge that was accrued in the prior phases is put to use. The EA documentation will aid as a planning tool for future expansions (in terms of resources, organizations, etc.,) and serves a guideline for making informed decisions. This phase is the ‘running’ phase of the EA process, where the enterprise has created a self-sustaining information base which is updated automatically. Once the enterprise enters the Phase IV, it can harvest the knowledge from the repository. The phase also imposes importance to manage the EA, by adding a separate step in the methodology to plan updates to (at least) EA annually.
The ADM
TOGAF’s methodology, termed as ADM ñ Architecture Development Method, is an iterative process that identifies a cyclical sequence of steps to address needs of each of the different segments of the enterprise. The focus of the ADM is to create a process that fits into the enterprise’s release cycles; hence, ADM’s customization to suit the enterprise’s needs is encouraged. The methodology is amenable for change at every cycle, at the beginning of which the scope can be fixed.
The ADM has eight phases that comprise a cycle, and some preparatory work before beginning the ADM cycles.
The very first phase of ADM is a Preliminary Phase, wherein the scope, participants, and sponsors are identified. This decides the feasibility and scope of architecture work based on the existing constraints on the enterprise, such as budget, time among other factors. This phase also involves (a) creating an architecture repository, (b) defining architecture principles and business goals/drivers, including any modifications to ADM, and (c) selecting the appropriate architecture frameworks. This is a one-time phase that decides the strategy of the entire EA approach, and lays a baseline for expectations and measures.
Once the scope and expectations/measures are decided, the iterative ADM process is triggered with the Phase A, the Architecture Vision phase. As a part of the first steps of this phase, various capabilities of the enterprise are assessed, the results of which lead to defining the scope: the scope could be ranging anywhere from small subset of activities to a big-bang EA implementation. Once a scope is set, the cycle’s goals, principles, measures, risks and activities are identified. This is followed by creating a statement of architecture work and getting a sign-off from the stakeholders.
The next three stages of the ADM Phases B, C, and D (Business, Information System and Technology Architecture Phases) focus on creating the business, data, application and technology architecture to satisfy the requirements and scope defined in Phase A. The Phase B – business architecture phase – focuses on identifying the current business architecture, identifying the gap, and defining the future business architecture to address the gaps in the Architecture Definition. Similarly Phase C – Information System phase – focuses on data and application architecture and Phase D with technology architecture sections of the Architecture Definition.
The Phase E – Opportunities and Solutions Phase – centers on identifying the build/buy decisions to solve the gaps identified in the earlier phases, and also to comply and complete the Architecture Definition. This leads to Phase F – Migration Planning Phase – that deals with the detailed planning of implementing the solutions identified in the earlier phases. The various segments/lines-of-businesses’ managers are involved in the planning process to ensure feasibility.
The Phase G – Implementation Governance – involves the interaction between the EA board, the committee responsible for overlooking the architecture of the enterprise, and the implementation teams. The governance here refers to the activities of the EA board in ensuring the changes brought about in IT are in-line with the proposed architecture, using the Migration Implementation Plan.
The final phase, Phase H – Architecture Change Management – involves steps in assessing the gaps in implementation of the architecture that might have identified in the beginning of the cycle, or that might have happened (possibly unknowingly) in any of the phases. These gaps, along with the changes that might be required to support future growth result in Change-Requests, which are possibly the inputs for the next cycle.
Other notable features of ADM are
Sequencing the phases of an ADM cycle as required: {A, B, A, B, C, B, C}
Constant updates to the requirements of architecture
Comparison of Methodologies
To map the various phases of EA3 with ADM, the first three phases of the EA3 are roughly equivalent the Preliminary phase and some parts of the Phase A of the ADM. The fourth phase of EA3 is expanded into the Phases B through H of the ADM.
The first obvious noticeable difference in the two methodologies is TOGAF’s IT centricity, as opposed to EA3‘s focus on strategy. The methodology assumes the changes to essentially originate in business, and always end up as IT changes. This disconnects the changes to various segments from reflecting in the overall EA until a certain phase. For instance, the TOGAF’s governance, implementation touch-points, and information flow between involved parties is discrete.
The preparatory work of EA is not as well documented in ADM, as in EA3. EA3 dedicates almost three phases towards the preparatory work, whereas ADM contains a single preliminary phase, which mostly covers the tactical aspects of EA. However, on the flip side, only the steps 18 and 19 of EA3‘s Phase IV discuss the steps to implement the EA. These steps are elaborated in ADM: the ADM details the process of EA implementation, specifying steps to carry out the changes through to completion.
Both EA3 and ADM bring in good discipline into EA. Both attempt to enable boundaryless information flow in the enterprise. However, though TOGAF understands the need for boundaryless information flow, it only confines to suggesting III-RM model, not providing a model. This is probably a shortcoming in TOGAF, as in EA3, the process needs to be boundaryless, not the products.
ADM scores in the area of describing a method to adjust the enterprise’s architecture to existing IT. The problem in ADM, however, is the duration of these cycles that might delay the realization of strategy if improperly followed. The EA3, on the other hand assumes the constant update and maintenance of EA3 framework is enough for the enterprise’s architecture requirements. The reason for the difference is mainly because of the focus of TOGAF on bringing IT under the EA umbrella, whereas that EA3 is to create an EA metamodel that involves every aspect of the enterprise under one umbrella.
Framework
Framework identifies the scope of the overall architecture and the type and the relationship of the various sub-architecture levels and threads.
The EA3 has a detailed framework that defines the content, or the what, of the EA approach will document. Though TOGAF is described as a framework, the emphasis is more on the methodology (ADM,) and less on the framework aspects [MSD]. The closest things to a framework in TOGAF are the concepts of an Architecture Content Framework and Enterprise Continuum.
The EA3 Cube
The EA3‘s framework, termed EA3 Cube, ties together the various artifacts, responsibilities and processes of EA into a three-dimensional hierarchically arranged composite. The framework has multiple layers of depth – each layer indicating a line of business, multiple layers stacked vertically indicating the hierarchical levels of the enterprise, and cross-cutting dependencies and components forming the cube.
Each level is placed in the cube to indicate the hierarchical relation between various levels and functional areas of the enterprise. The top layer focuses on the strategic goals of the organization, and as the layers below focuses more and more on tactical goals of the enterprise. The cross cutting concerns are captured at the same hierarchical level, as the decision in one line of business, and layer might require similar alterations at the equivalent level. For example, a change in goal by a CXO might affect the functioning of another CXO at the highest level. The EA3 Cube attempts to capture such interconnections in the enterprise, and attempts to enable smooth flow of information required for decision making.
The highest level of EA3 cube deals with the goals, initiatives and other strategic directions of the enterprise. These are the critical factors that decide the survival or prosperity of the enterprise. These decisions drive the rest of the enterprise’s architecture work.
The next level deals with the business requirements. These requirements tend to focus on identifying the business solutions described by the strategic directions of the higher level of the framework.
The third level deals with the data and information requirements of the enterprise, which arise from the business requirements. The realization of business requirements is designed and spelled out by an IT department that would create data and information banks that describe and map the business problems to software.
The fourth hierarchical level describes the systems, which involves creating and hosting the software solutions and services. The creation of software is dependent on the problem space defined by business, and solution space defined by the information levels; again, the requirements are driven by the higher layers.
The fifth level is the network and infrastructure, which describes the physical realization of the software solution. This involves tasks of building the network infrastructure, maintaining server farms, and building and maintaining software infrastructure to enable the software solution requirements.
Apart from the hierarchical levels and lines of businesses, the EA3 Cube also allows capture of cross-cutting concerns, such as security, across the various levels.
ACF and Enterprise Continuum
The documentation framework of TOGAF resides in two parts: the ACF – Architecture Content Framework, and the Enterprise Continuum.
The ACF describes three different kinds of work products:
i. deliverables that are contractually required to be signed off by stakeholders indicating approval
ii. artifact describing some aspect of the architecture,
iii. building blocks, readymade solutions that can be plugged in as is.
The Architecture Metamodel defines the formal structure of how various artifacts are grouped, and how they relate to each other. This architecture metamodel identifies all of these concerns (i.e., application, data entity, technology, actor, and business service), shows the relationships that are possible between them (e.g., actors consume business services), and finally identifies artifacts that can be used to represent them.
The highest layer is the architecture vision, which attempts to capture the strategy of the enterprise. The architecture vision yields architecture requirements, which define the enterprise architecture work.
Next, the business architecture captures the business goals, affected lines of businesses and the functional requirements. The information systems architecture captures the data entities and the information system entities that operate on them. It also captures the logical and physical components that realize these entities. Finally, the technology architectures deals with the platform which enables the realization of the information systems architecture. The architecture realization captures the governance of realizing the architecture.
With the focus on maximizing reuse, TOGAF attempts to create templates of entire architectures, termed building blocks. Hence, TOGAF describes an enterprise continuum, which is the classification method of the architectural knowledge base. Everything from business principles to technical standards to third party frameworks, all those things too that are present in your enterprise are classified as per the enterprise continuum. The enterprise continuum is further classified as architectural building blocks (generalized problem statements) and solution building blocks (possible solution set.)
Comparison
The EA3 cube has a framework that stretches to cover every aspect of an enterprise, and also how the various facets of the EA are hierarchically associated. The ACF and Content Metamodel also capture similar facets, but suffer in associating these requirements in a manner to indicate the direction of dependencies. The ACF is useful in capturing and arranging the EA information, but no in enabling the enterprise in harvesting the information at every level into knowledge that can drive the enterprise strategy, and hence the business.
The TOGAF focuses on the architecture requirements, and attempts to deal with separate set of documents that capture such requirements. These are not part of the EA3 cube, as such requirements are assumed to be in the cross-cutting components of the EA3 cube. The TOGAF has a broader frameworkand attempts to encompass the implementation and governance work of the EA to be included in the framework, which is missing in EA3 Cube.
The TOGAF scores from being able to provide a large ready-made/off-the-shelf solution and direction to enterprise, and allow standardization not only across the enterprise, but also across the domain and industry. The reason for this is that TOGAF has been widely used, and for a long time, which results in the creation of a large repository of building blocks.
Artifacts
Architectural artifacts are created in order to describe a system, solution, or state of the enterprise. With time, the artifacts evolve beyond being simple documents, they become models that guide progress, act as indicators of capabilities, and as essential knowledge frames for strategizing the enterprise.
Good artifact collection captures the essence of the enterprise – strategy in terms of vision and mission, business ideas and opportunities, present and future capabilities, functional aspects – among many other facets.
EA3 Artifacts
EA3 describes 46 recommended documentation artifacts that capture the enterprise’s EA at strategy, business and technology level.
The artifact list is only indicative, and can be augmented, or swapped with other documentation artifacts as required.
The artifacts are classified and arranged in a hierarchical fashion, within the EA3 cube structure. The strategic artifacts discuss the plan, mission and vision of the enterprise, and how the various programs and resources in the enterprise are aligned. The business artifacts identifies the business plans, along with the stakeholders and their perspective and understanding of these business ideas. The business artifacts attempt to umabiguously capture the business requirements, so that the next sub-architecture, data sub-architecture plan can be defined correctly. The data sub-architecture plan defines the key data and information elements of the enterprise. Ensuring data models are driven by business plans ensure correctness and appropriateness of these models.
The other artifacts mostly deal with tactical work, and capture state of the enterprise in terms of its resources. The systems sub-architecture artifacts capture the information about the infrastructure of the enterprise, how the resources are connected and used, and how the resources enable the enterprise to function. The systems sub-architecture artifacts might also contain performance measures, plans for infrastructure evolution, and other such strategic documentation with the resources in perspective. The network sub-architecture artifacts depict the actual hardware the realizes the infrastructure of the enterprise. These act as inventory and capability models.
The security artifacts and workforce artifacts address cross-cutting concerns from other departments such as Security Team, HR.
Artifacts and Deliverables
As discussed in an earlier section, TOGAF classifies the documentation artifacts as artifacts, deliverables, and building blocks. Central to the concept of TOGAF documentation is the concept of views and viewpoints. The documentation always describes (viewpoint) the system from the perspective of a stakeholder (view.)
TOGAF describes 43 artifacts grouped under 23 deliverables. The deliverables, artifacts are not produced simultaneously, but from the perspective of ADM. The preliminary phase, and phases A, B, E, F, G and H produce deliverables that are essential in the progression of the ADM.
Most of the strategic artifacts are created during the preliminary phase, and small changes are allowed phase A. The deliverables of Phase A capture the scope of the EA changes, phase B addresses the business changes to the architecture, phase C addresses the data and information system changes to the architecture, and phase D addresses the technology changes to the enterprise architecture. The deliverables from phases F and G describe the tactical planning aspects of implementation. Phase H deliverable addresses measurement and gap analysis along with any failures or misses in the cycle – mostly tactical.
The artifacts contain catalogs, core diagrams, and matrices. Like EA3, the artifacts deal with various layers of the enterprise architecture and address the strategic, business, and technology aspects of the EA.
Comparison
A rough mapping of the various artifacts between EA3 and TOGAF:
Mapping of catalogs to EA3 artifacts
Mapping of TOGAF core diagrams to EA3 artifacts Mapping of TOGAF Extension Diagrams to EA3 artifacts
Visible from the comparison, is the fact that though the artifacts do not match one-to-one, the intent is quite the same. It is also interesting to note that neither of the approaches mandate a particular set of artifacts. Though the artifacts are comprehensive in collecting and depicting the enterprise’s architecture, they cannot be termed as complete and exhaustive.
This is a deliberate theme in both the approaches, for many reasons. The enterprises might have (will have, in most cases) existing documentation in various formats and notations. A very good example is UML. The UML is a de-facto standard for many technology enterprises, and the enterprises have expertise and repository of such artifacts. The enterprises might have regional or domain constraints in depending on some documentation.
TOGAF documents suffer from being too focused on tactical aspects of the enterprise (for instance, consider most of the artifacts in the opportunities and solutions phase.) The documents tend to focus on iterative development and will add to the repository as versioned history of the enterprise’s path to EA. This sometimes complicates things and makes knowledge harvesting from prior experiences and work a challenge.
EA3 scores with its ideas about keeping the documentation continuous, automated, and arranged for ease of access. Though most of the documents are extremely well thought off and are to be used in their entirety, some of the documentation artifacts in the technology domain may not be suitable for every organization. This is not a shortfall, as the enterprises current documentation can be swapped into the position of the artifacts to ensure completeness.
Keeping abreast with technology is an important aspect of an EA approach [SCH]. Technologically, EA3 is more suitable for cutting edge technology. The concepts of SOA, distributed applications, web applications are part of the recommended artifacts. These technologies are accurately placed in the right layers. For instance, the SOA work is correctly identified as being driven by business requirements. This is why EA3 has an extensive set of documentation, keeping abreast with both latest technology and retaining the requirements of legacy. Among other things, EA3 tries to be thorough in definition of roles and responsibilities. For instance, what TOGAF leaves unidentified as the ‘stakeholder’ is discussed in EA3.
TOGAF artifacts score in being more suitable for large enterprises with legacy, and/or established domains. The framework and artifacts are built for reuse and sharing. This, along with the fact that TOGAF has seen wide usage, allows TOGAF to have a rich reusable artifact base. Also, the artifacts are grouped together into reusable architecture templates, which vary in specificity.
Repository
Modern enterprises seek to organize the architecture information in a disciplined and efficient way, so as to avoid replication of information, improve accessibility of information and foster consistency [MIN].
The Living Enterprise
EA3 forces the enterprise to develop documentations in an automated way, in XML/HTML format, and store them in an online repository.
The Living Enterprise, the suggested EA3‘s repository, is an excellent example of arranging the documents in an online website.
The website has multiple tabs to indicate various lines-of-businesses and functional units, and each tab contains links to the artifact(s) that are arranged hierarchically. Designed with simplicity in mind, the format is that of a flattened cube, each tab representing a different segment.
TOGAFs Architecture Repository
TOGAF’s architecture repository attempts to not only contain the artifacts generated during EA, but also the best practices, reference models, and external standards.
Though the intent is to create a repository of any and every information generated in the enterprise, or for the enterprise, a structure for storing such content is absent.
Comparison
EA3‘s Living Enterprise is a better approach than the TOGAF’s: an online website allows
1. ease of access: the information is easily navigable, searchable and accessible
2. secure: access to the web pages can be controlled based on roles
3. visible: the changes are quickly visible to the intended audience
The TOGAF repository is all encompassing, and hence will be a vast base of knowledge. Unlike EA3, in TOGAF, enterprises will have to ensure the content is current, correct and organized. If done so, the artifacts can form a much larger inforamtion base.
Governance
EA Governance is the act of governing the entire EA process. EA Governance addresses managing, controlling, and guiding the various processes and workings of an enterprise. Good governance ensures the business of an entity is conducted as strategized: through guidance and by leveraging the involved resources. EA, being the `on-top’ process, deals with all the structures of the enterprise.
Governance is the effort to bring in
involvement from all parties by gaining commitment to comply to the process
transparency in decision making, and accountability of actions
provide independence to involved parties
fairness in the decisions and process to avoid unfair advantage to some
Governance in EA3
EA3 focuses on integrated governance. In EA3, EA governance is accomplished through processes that outline and guide the enterprise in its efforts to create and maintain EA, and groups that enable the process adherence and conformance in the enterprise. The governance is designed so as to coexist with, and integrate into the existing processes.
The EA governance of EA3 encompasses the Architecture Working Group that interacts with strategic planning, capital planning, workforce planning, program/portfolio management, and security governance bodies. The governance is accomplished through regular reviews of programs at the enterprise, segment, and system levels. These reviews look at both the business value in terms of priority, feasibility, risk, etc., and technology fit of the solution in terms of completeness and correctness.
The EA3‘s governance process is an iterative process, wherein the Architecture Working Group closely interacts with strategy, capital planning and IT to review programs and select for execution, to control the execution, and finally to evaluate and measure the outcome.
Governance in TOGAF
In TOGAF, governance is not addressed as a constant process, only a particular phase of ADM is earmarked for governance. The Phase G of ADM, Implementation Governance, describes the process of governing the realization of business requirements though IT. The Phase F, Migration Planning, produces an implementation and migration plan that is used as the guideline for governing the IT implementation.
The governance in TOGAF is directly under the supervision of IT, and hence headed by the CTO or the CIO. The governance activities are created and carried out by an Architecture Board, which consists of Enterprise Architects, and a Chief Architect. The goal of this Architecture Board is to create the various governance processes that are the guidance, and diffuse them into the enterprise, and enable conformance.
The governance, similar to EA3‘s governance, aims at linking IT processes resources and information to organizational strategies and objectives.
Comparison
EA3 clearly has a more involved and well directed governance framework than TOGAF. The governance in EA3 plays a central role in the organization by pushing the EA governance into the enterprise’s strategic and capital planning category, hence seamlessly integrating the entire EA governance into the enterprise governance. TOGAF’s governance is mostly limited to the IT governance, and the governance bodies do not add a ‘feedback’ value to the overall governance of the enterprise.
Conclusions
EA3 and TOGAF are both excellent EA approaches. The major differences arise from their target audience. TOGAF is more IT centric, and is in tune with the requirements of enterprises with legacy. EA3 is aimed at newer technology enterprises and enterprises where IT is considered as an extension that is directed by business and strategic requirements.
Currently, the school of thought promoting agility in IT aims at leaner documentation, increased interactions between departments[AGI]. Simultaneously, advances in software development methodology, time and money models have brought in new perspectives to the way organizations function. Though the TOGAF process is well defined, the approach continues to keep the communication between departments through a central architecture board. This weakens the requirement of quick and easy flow of communication throughout the enterprise, and also makes it hard for companies that intend to be agile. ADM is envisioned with IT in mind, hence the process focuses on collecting all the information from business, creating small ‘IT projects’, and governing them as an external entity [ROG]. TOGAF adherence relies on extensive documentation and meetings involving participants for a successful adherence to TOGAF. For instance, Architecture Review Process, Architecture Compliance entirely rely on meetings with all the involved stakeholders, architecture board, etc., Achitecure Contracts are enforced via copious documentation. Compare this with EA3: EA3‘s governance and repository, allow true boundary-less information flow across the enterprise. EA3 emphasizes on building the EA framework with enterprise’s strategy in mind.
The strength of TOGAF is its resource base – guidelines, templates, building blocks, et.c.,. Due to its emphasis on reuse, and its wide usage, coupled with the drive from TOGAF community to generalize every solution in the industry, TOGAF offers a rich library of artifacts and architecture models to use. This ensures enterprises can follow the standards of the domain, and only build things where they differ; for instance, key service offerings.
The EA3 is definitely a more accurate approach, which is devised to benefit the organization into having an excellent meta-model. Though not as thorough or vast as TOGAF, EA3 contains certain key elements that drive the enterprise into a better EA. The strength arises from the focus on strategy, being newer – hence being more apt for today’s enterprises, laying emphasis on automation and allowing constant ‘feedback-control’ from all segments. The most important aspect of EA3 is the elimination of duplicate enterprise architecture efforts by neatly connecting the various architectural efforts.
Reference
[AGI] Manifesto for Agile Software Development by Kent Beck et al [BER] An Introduction to Enterprise Architecture by Scott Bernard [ISBN:978-1418498085]
[COH] Comparison of EA3, OIO and Zachmann by Peter Flemming Teunissen Sjoeli [GRI] An Enterprise Architecture Development Framework by Adrian Grigoriu [ISBN:978-1412086653]
[MCG] A Practical Guide to Enterprise Architecture by James McGovern, Scott W. Ambler [ISBN:978-0131412750]
[MIN] Enterprise Architecture A to Z by Daniel Minoli [ISBN:978-0131412750]
[MSD] A Comparison of the Top Four EA Methodologies from MSDN Library [POT] fruITion: Creating the Ultimate Corporate Strategy for Information Technology by Chris Potts [ISBN:978-0977140032]
[ROG] Simple Architectures for Complex Enterprises by Roger Sessions [ISBN:978-0131412750]
[ROS] Enterprise Architecture as Strategy: Creating a Foundation for Business by Jeanne W. Ross, et al [ISBN:978-0131412750]
[SCH] How to Survive in the Jungle of Enterprise Architecture Frameworks by Jaap Schekkerman [ISBN:978-0131412750]
[SWE] Achieving Service-Oriented Architecture: Applying an Enterprise Architecture by Rick Sweeny [ISBN:978-0131412750]
[TOG] The Open Group Architecture Framework version 9.1 from The Open Group