Produces a value based on a specification, such as a constant or expression.
Archives: Templates
Templates and model types in the QualiWare platform.
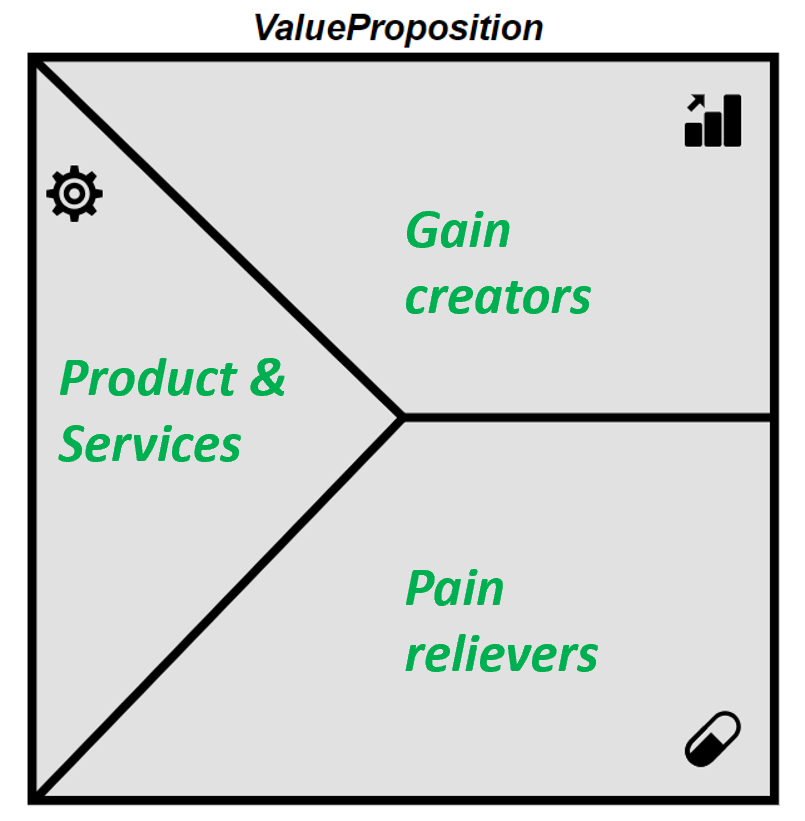
Value Proposition
A value proposition stands as a promise by a company to a customer or market segment.
The proposition is an easy-to-understand reason why a customer should buy a product or service from that particular business.
A value propostion can be shown as a symbol in a ValueStream
In a ValuePropostionCanvas a ValueProposition can be shown as a “canvas” where Gains and Pains can be mapped together with the Products & Services for a ValueProposition.
Value Pin
Holds a constant value used by an action, often for configuration or control.
Value From Repository
Description of this template will be available soon.
Value From Generic Query
Description of this template will be available soon.
Value Flow
Value flow is a type of connection used in business process modeling to represent the flow of value or information between different elements in a process. It shows how inputs are transformed into outputs, and how value is added or changed as the process progresses.
In a business process network, value flow connections can be used to illustrate how different processes interact with each other, and how value is exchanged between different business units or stakeholders. Value flow connections may also represent the flow of information or data between different systems or departments and can help to identify opportunities for process optimization or improvement.
Validation Report
Description of this template will be available soon.
User Interface
In a workflow diagram, the user interface symbol represents the point at which a user interacts with a system or application. It indicates the point where a user inputs data or makes a selection, and where the system displays information or results back to the user. The user interface symbol is typically represented by a rectangle with rounded corners, and may include labels to indicate the specific type of interface, such as a button or text box. It is an important symbol in workflow diagrams as it helps to identify the different touchpoints where users interact with the system, and can be used to guide the design of the user interface for optimal usability and efficiency.
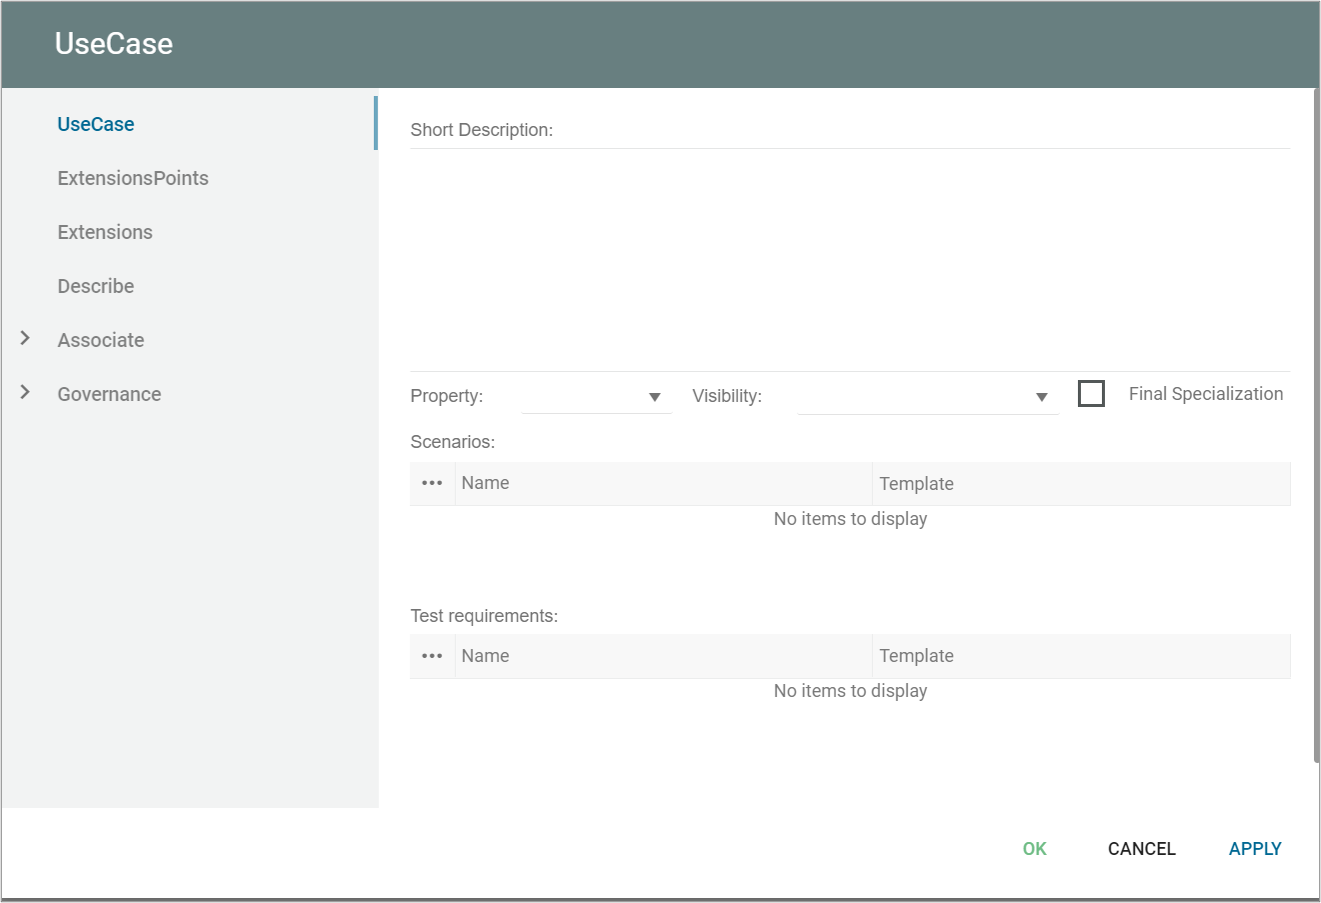
Use Case
A use case represents an example of how the system could be used.
A use case is modelled in a use case diagram.
Usage
Usage is a concept in Class Diagrams that represents a relationship between elements, indicating that one element (the client) uses or depends on another element (the supplier) without specifying the nature of the relationship in detail. The Usage relationship is a type of dependency that implies that the client element requires the presence of the supplier element to perform its function, but does not imply any kind of ownership or control over the supplier.
In a Class Diagram, Usage can be applied to various elements such as classes, interfaces, components, or packages. It helps to model the dependencies and connections between elements in the system, highlighting how different elements are related and rely on each other.
Example: In a Class Diagram for a system that manages a library, you might have a class called “LibrarySystem” that uses another class called “Book”. The Usage relationship between these classes indicates that the “LibrarySystem” class depends on the “Book” class to perform its functions, such as managing book loans and returns. This relationship shows that the “LibrarySystem” requires the presence of the “Book” class, but it does not imply any ownership or control over the “Book” class by the “LibrarySystem”.