Once an overview of the current situation has been established (in the form of a baseline application portfolio), the relevant steps for evaluating the portfolio can begin. These steps or processes in the application portfolio management journey are broadly to:
- Evaluate the performance of all applications in the portfolio
- Identify application redundancy
- Assess risks and opportunities associated with the applications
- Evaluate the current level of digitalisation in the enterprise
- Evaluate the coherency of the application portfolio
The evaluation stage in the journey is crucial as it represents the analysis work that will be undertaken to determine opportunities for improvement – this will, in turn, inform the action plans and transformation plans that need to be initiated and implemented to realise a target/future state. Each time the evaluation stage of the journey is started, it represents an opportunity for both iterative improvement and a checkpoint regarding the progress of targeted interventions.
Evaluating the application portfolio involves collaboration between different roles in the organisation. This includes enterprise architects, application owners, and application users and should consist of strategic decision-makers where necessary. The collaboration aspect of this stage in the journey ensures that assumptions and findings are validated with stakeholders and that business objectives are always considered.
Getting a clear overview of the Application list
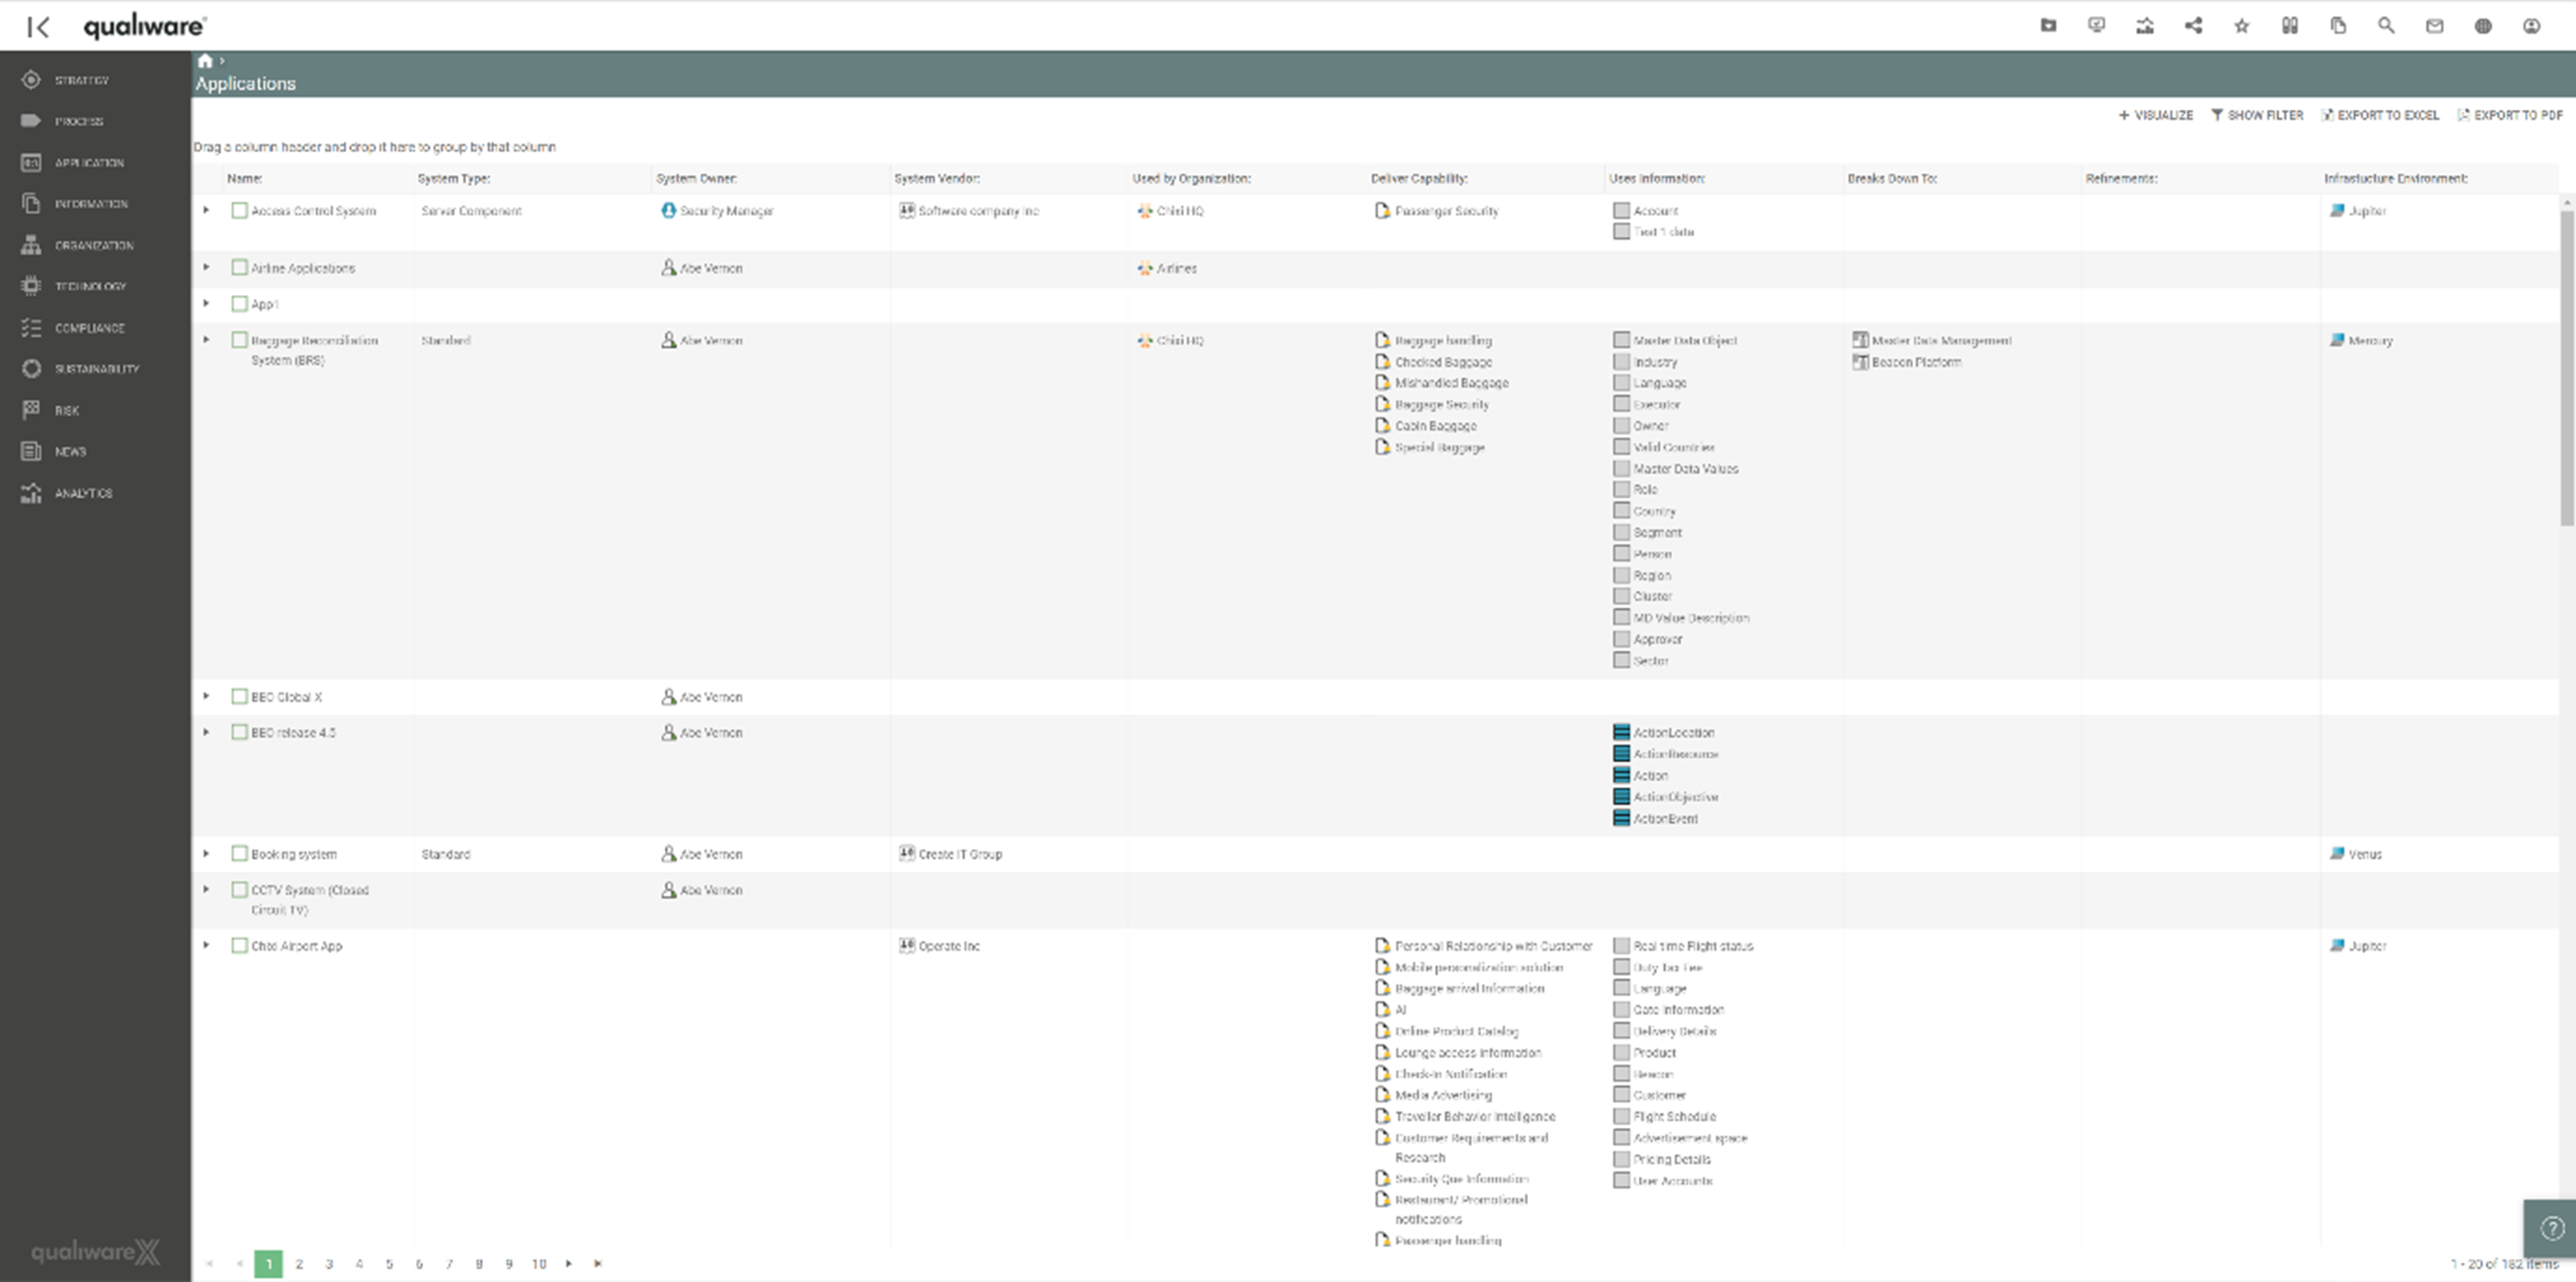
Once the initial data take on has been executed, the applications will be accessible in a spreadsheet type view in QualiWare. Here it is possible to get a clear overview of the applications in the repository along with a selected portion of the properties of the applications. This view is called a QRV.
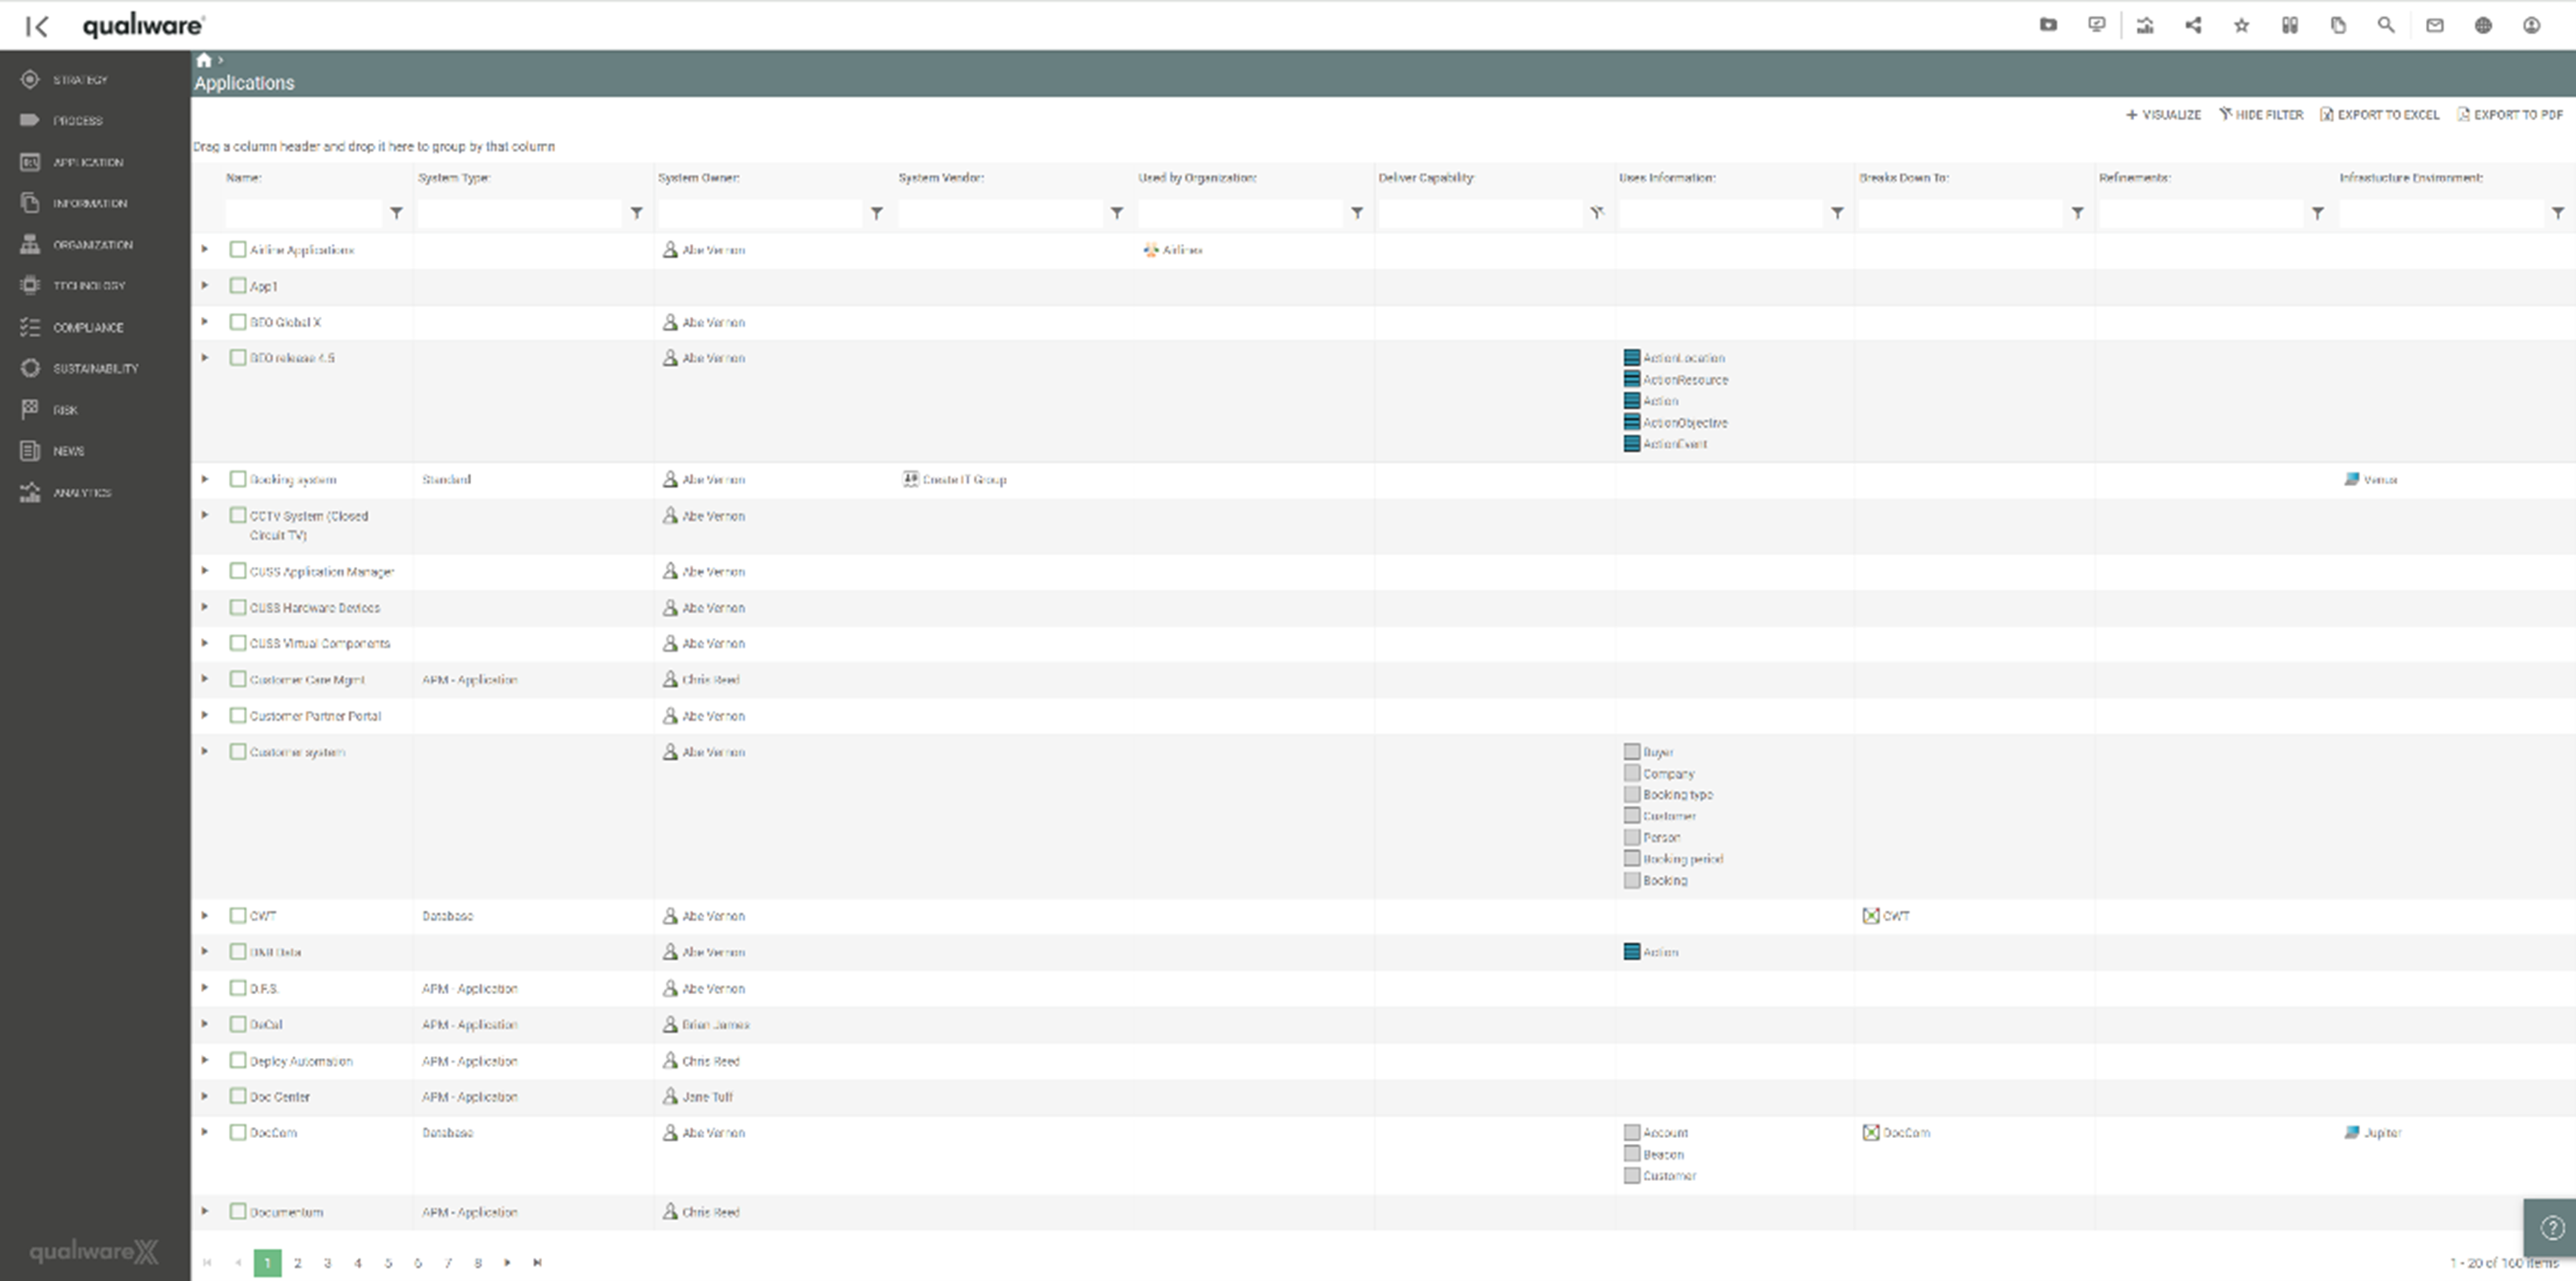
The QRV can be filtered so that the list dynamically updates and shows the applications with the filtered criteria that is selected by the user.
A filtered view of the application list where a filter to show the empty “Deliver Capabilities” has been selected. The result is a list where only applications with no Capabilities attached, are shown.
The QRV view can be exported to PDF or Excel for further and continuous manipulation of application data, that can then once again be imported with the updated properties. Another option is to visualize the QRV with the selected filtered properties. This provides unique 2D and 2D visualizations that enhances the understanding of relations and clusters of the applications eco system.


