Evaluate the performance of each application based on metrics such as usage, response time, downtime, and user feedback. After that, determine which applications are critical for business operations and which can be retired or replaced. This can be enhanced by leveraging information such as incident or problem data from IT service management platforms.
Assuming a baseline has been created, an application landscape can be created using the ApplicationArchitectureDiagram template. When creating the landscape diagram, information systems can be created directly in the model, or existing information systems can be selected from the repository (which is to be assumed if the baseline involves an import).

The application architecture diagram represents the relationships between a logical set of systems –a group of information systems that deliver specific services or capabilities together. The arrows between each information system represent either a system dependency or an information flow – these are important because these two types of connectors provide valuable insight when considering the impact of situations where individual applications are unavailable and the relative effect on delivering a service or capability.

Selecting an information system and clicking the edit button will open the standard HTML dialogue for that template type. It is unnecessary to complete every attribute in the various tabs to derive benefit or insight. However, a more comprehensive set of metadata will enable QualiWare to provide more comprehensive insight into the performance of the information system.
Collaborating with application owners and application users is essential when collating the qualitative performance metrics that can be captured using the “provides” tab.

Identifying platform usage can be aggregated to an organisation level and identifying specific locations and regions where the information system is used.

Using the “Highlight If” analysis feature in the analysing and improving dashboard, you can select “System has performance indicators” to show applications with a performance target or associated metric.

Selecting edit again for the information system and browsing to Associate -> Performance will provide an opportunity to create new performance indicators or link to existing ones.
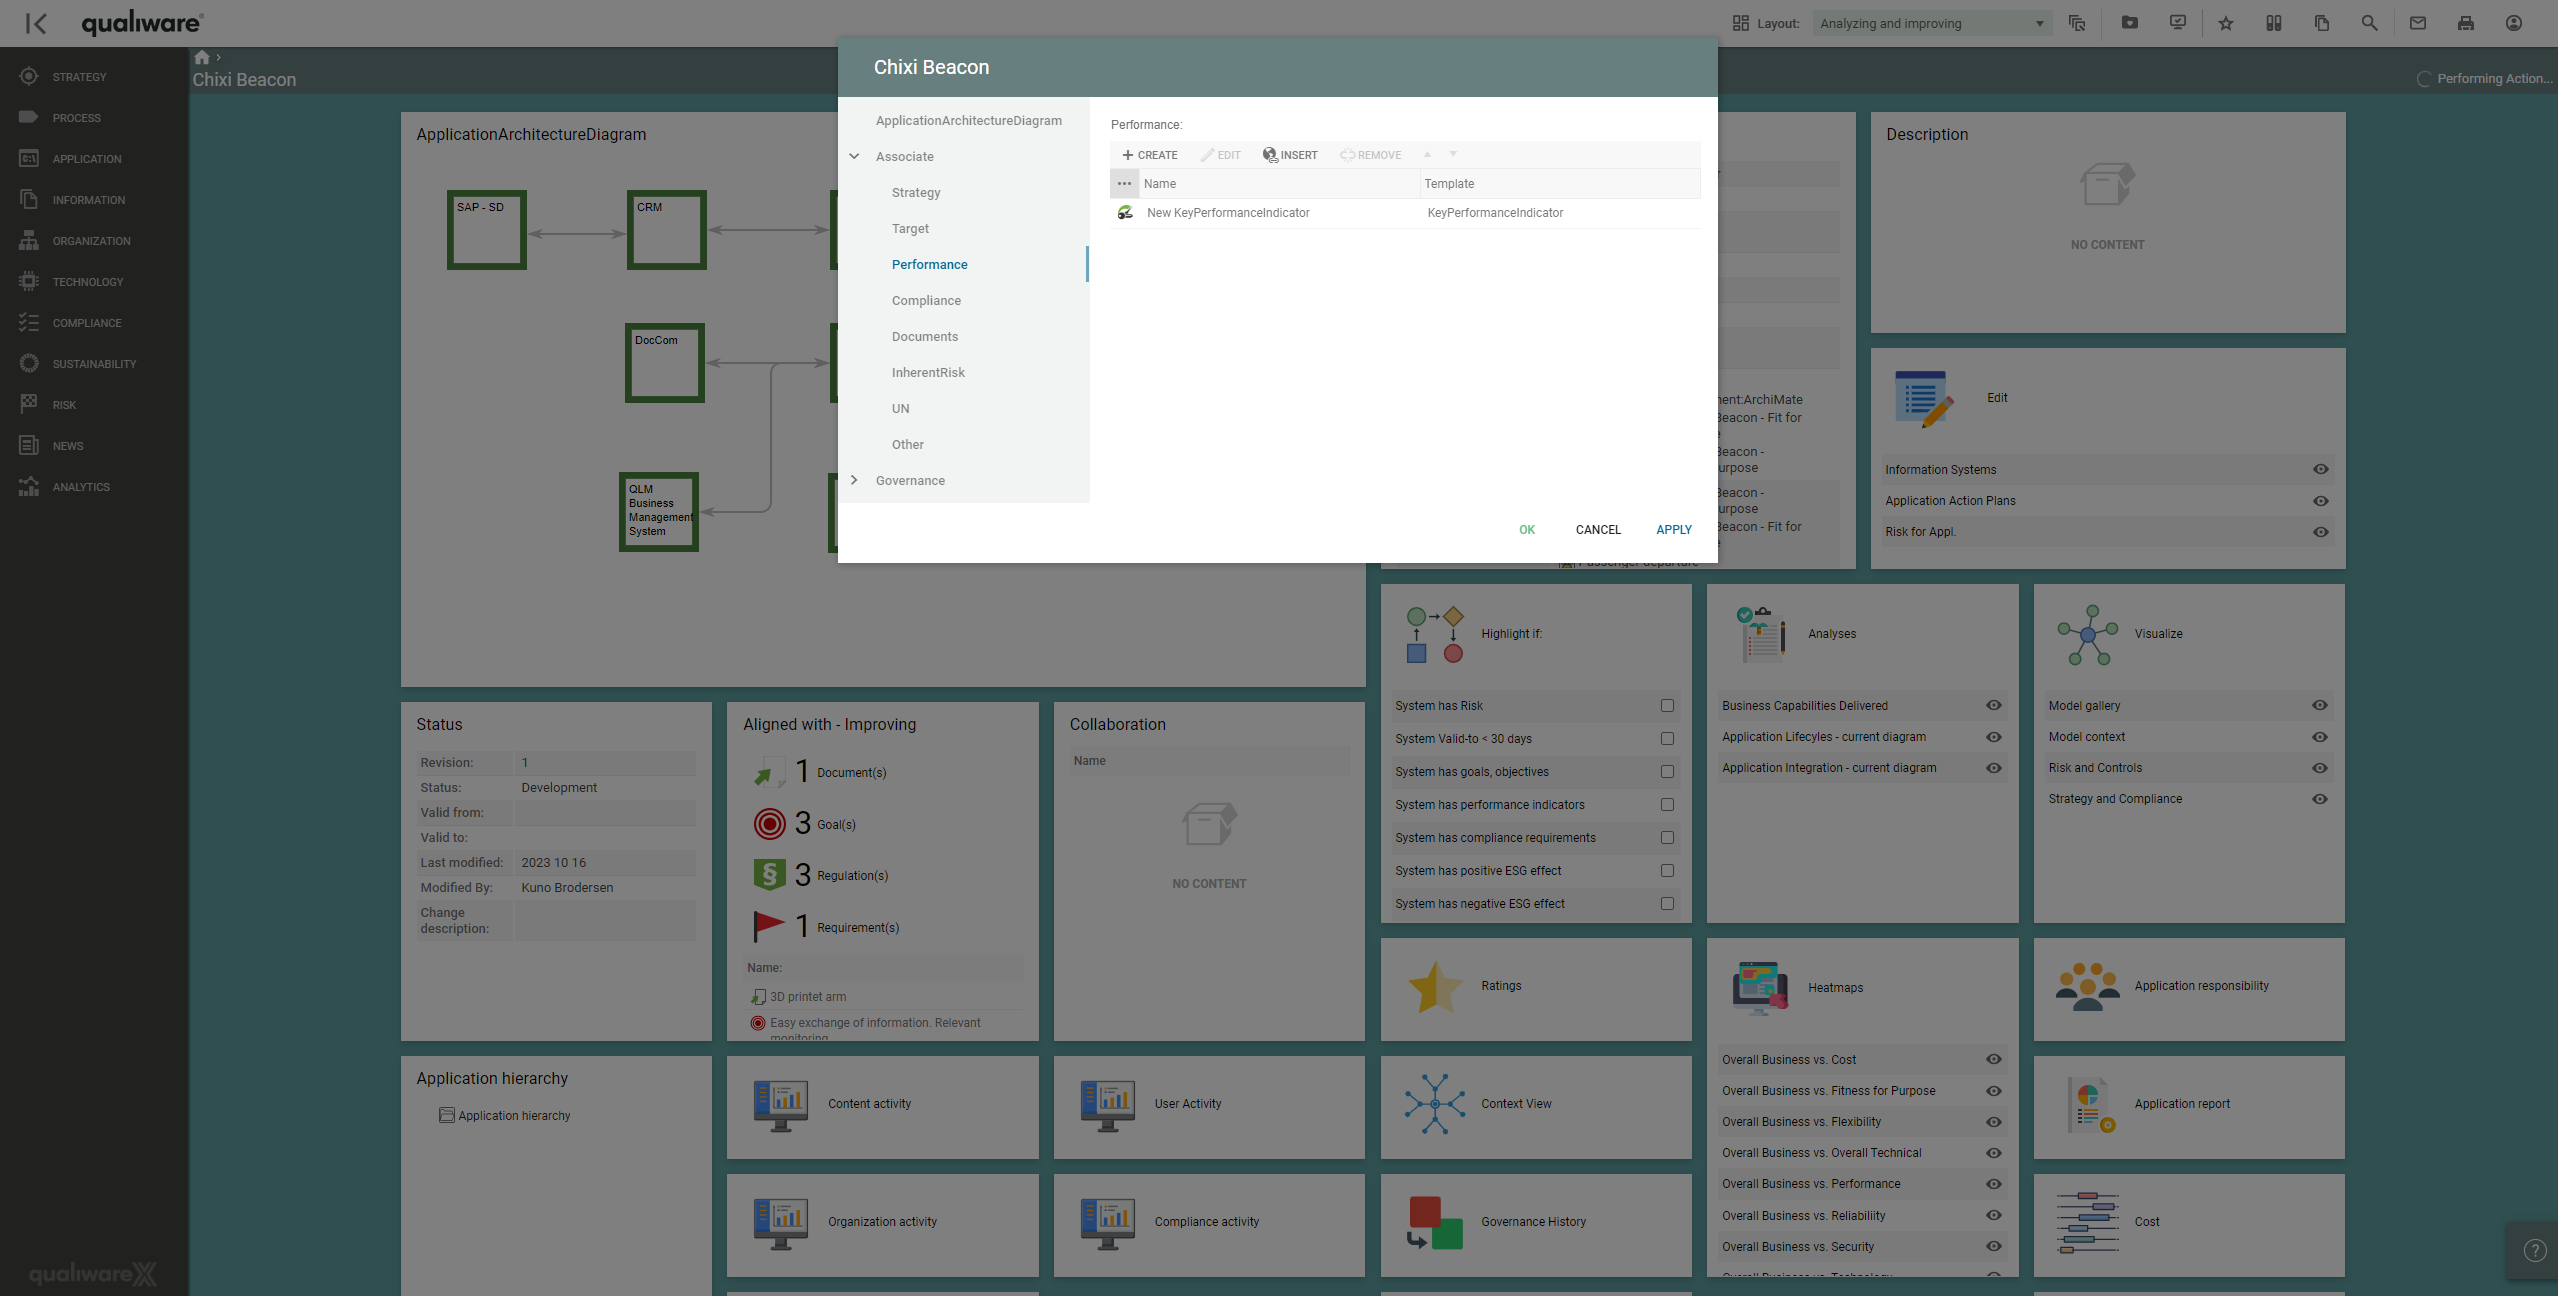
The KeyPerformanceIndicator template type contains valuable information for capturing indicators and visual scorecards, which the information system contributes to or enables. Monitoring the performance of these indicators relative to the operation of the information system is a valuable tool in evaluating the performance of an application.


Another fantastic feature is the ability to select the “System has netto benefit” using “Highlight if”. This highlights information systems that have a positive financial benefit to the organisation.
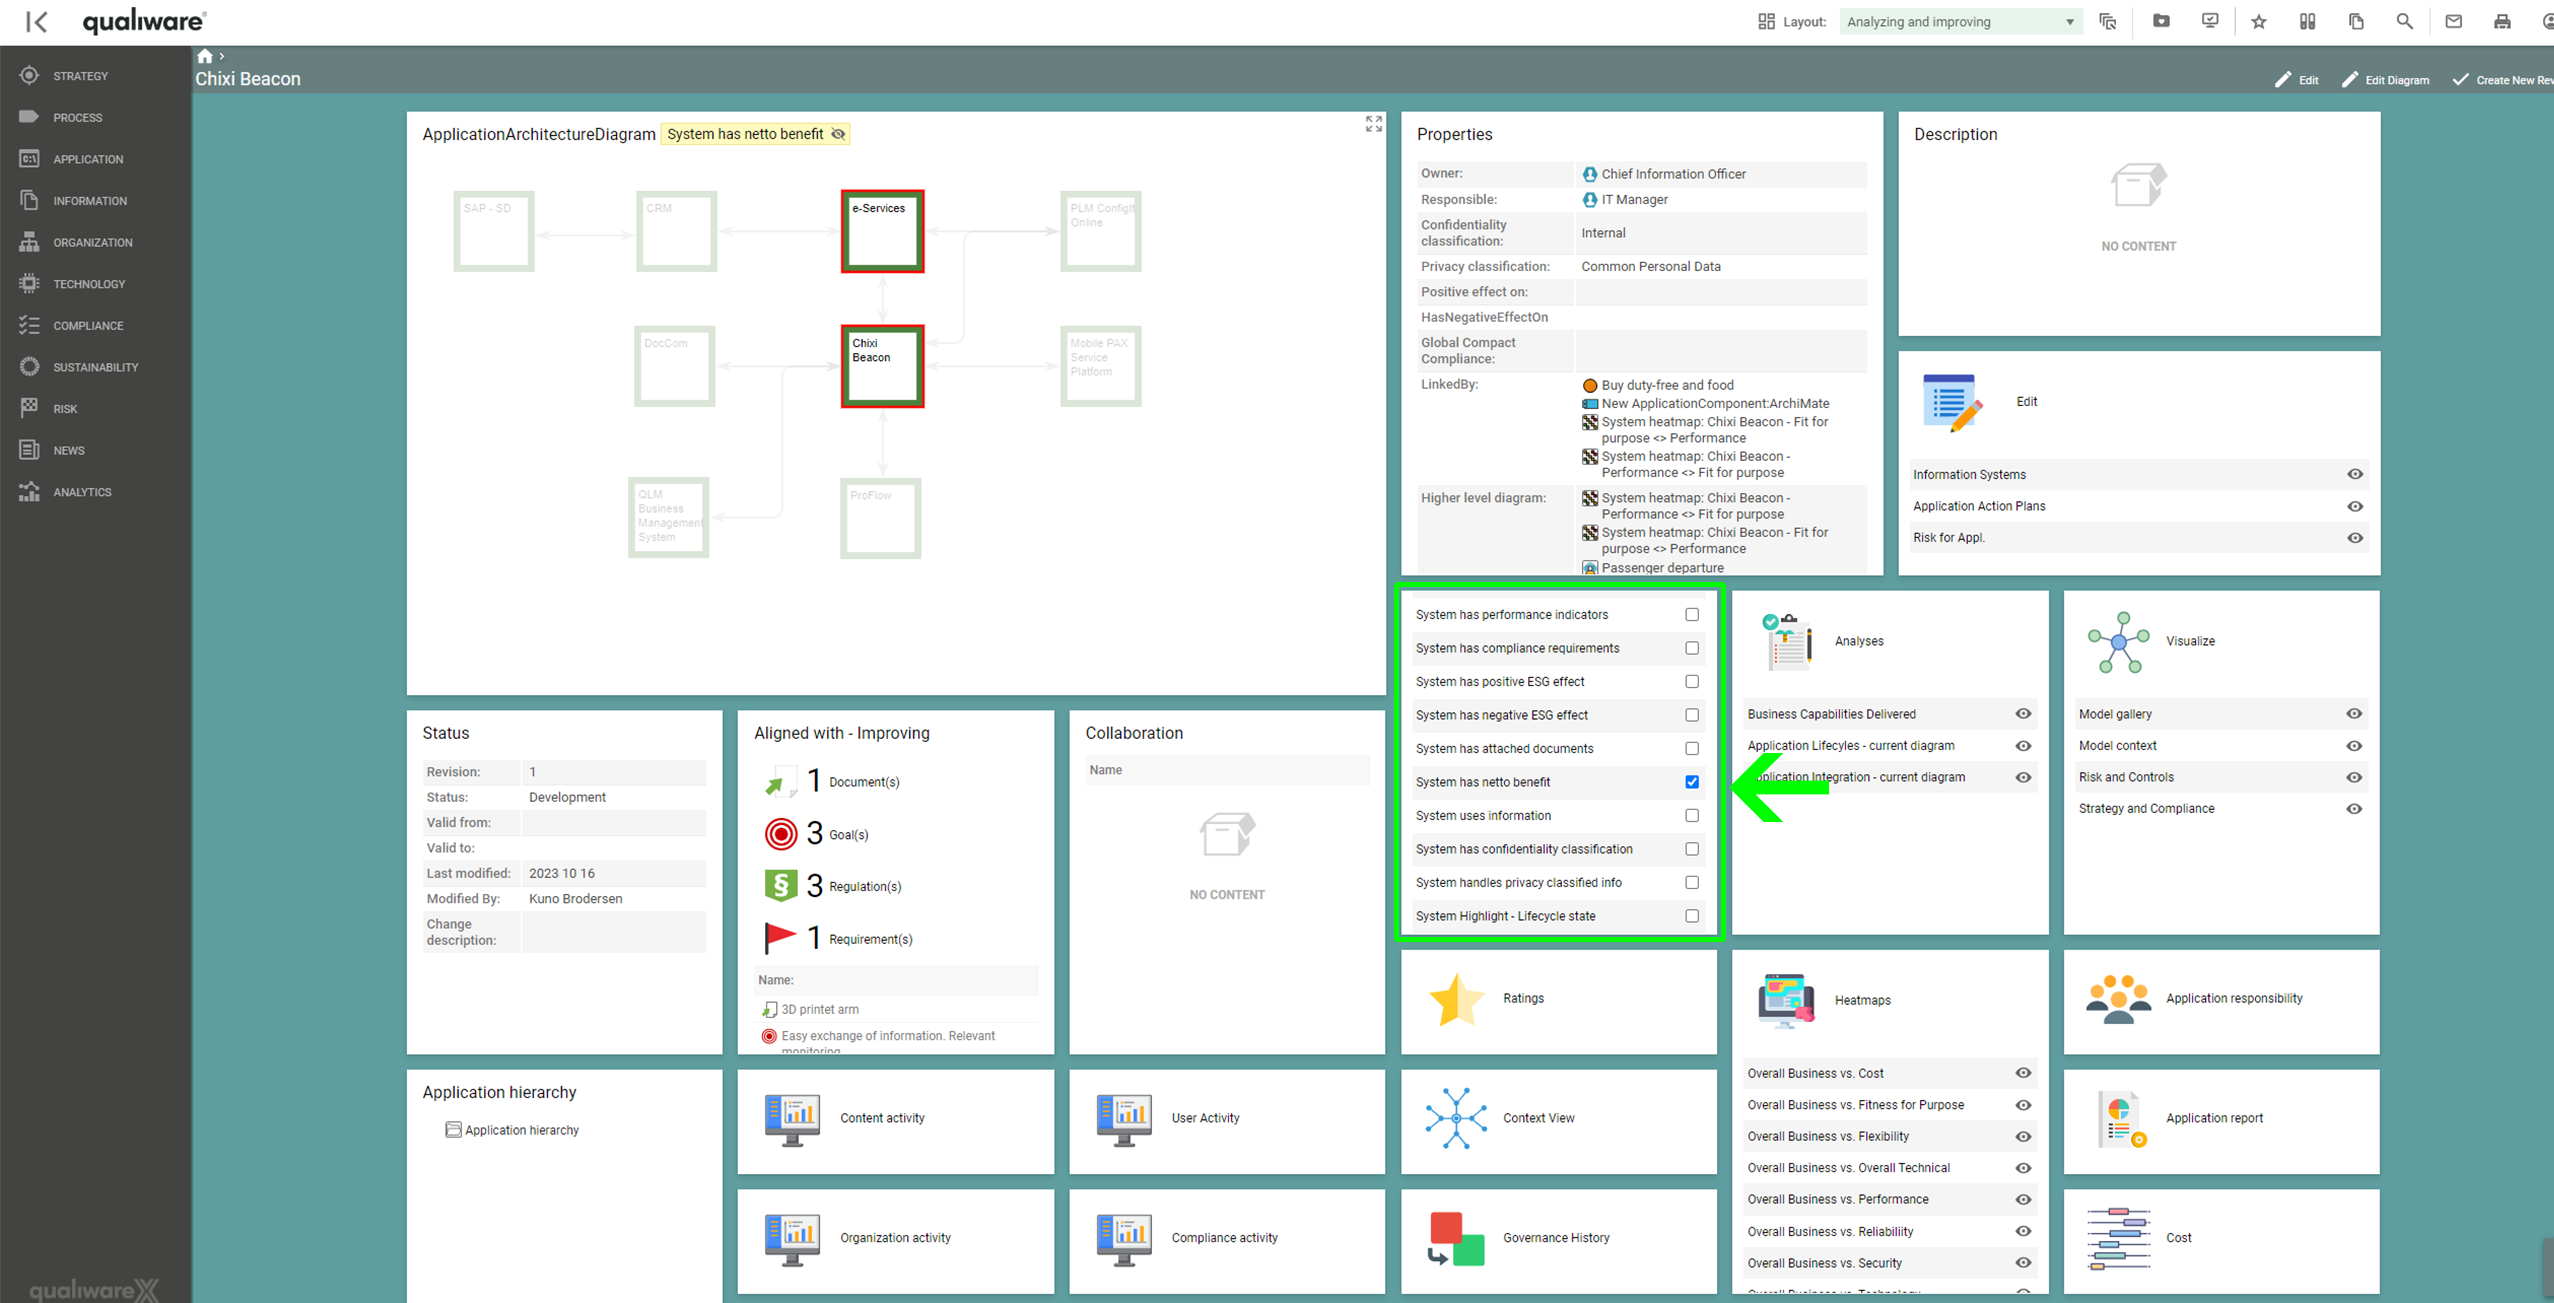
This can be viewed by using the Economy tab for the information system or leveraging the QualiWare spreadsheet view using the “Action Plans” button on the dashboard.

