Purpose: The purpose of the Balanced Scorecard Diagram is to model Balanced Scorecards, as described by Robert Kaplan and David Norton in 1992.
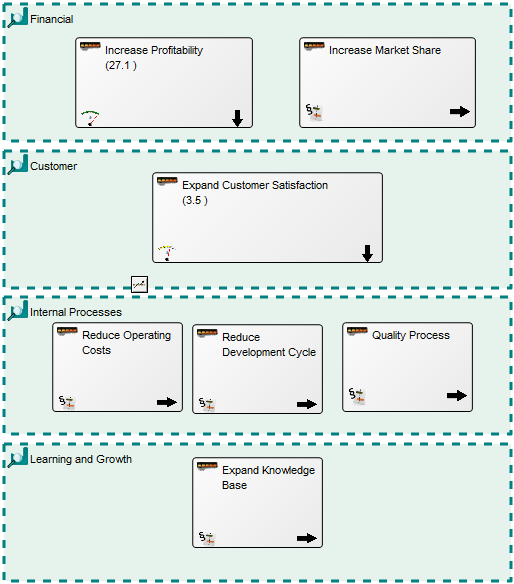
Core concern: Usually, a Balanced Scorecard Diagram template measures the state of the enterprise via Key Performance Indicators that are categorized into four different perspectives using Business Scopes. Aside from this, the template enables you to model general concepts and cause/effect.
Below, you can see an example of a Balanced Scorecard Diagram:

Relation to other templates: The Balanced Scorecard Diagram can be used to create a Performance Evaluation Model or a Strategic Management Diagram the Key Performance Indicators it contains can be broken down into Performance Diagrams offering a detailed view of how the organization performs. If CXO dashboards are to be created, the Strategy Model should be used instead.
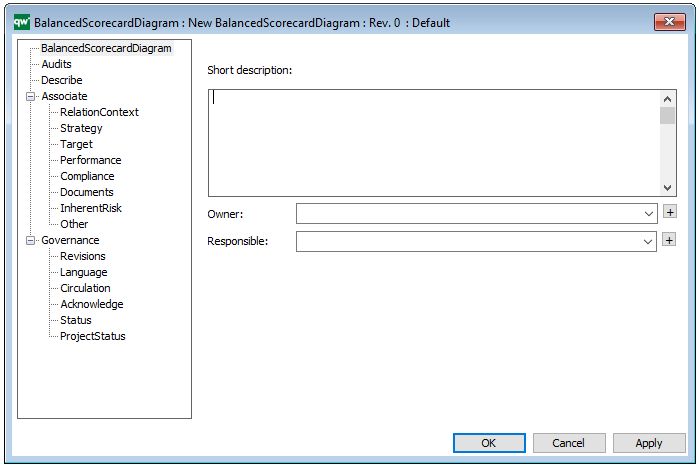
Properties and metadata: The Balanced Scorecard Diagram can for example retain the following information:
- A description of the diagram
- Link to the owner of the diagram
- Link to the one responsible for the diagram
- Audits (auto generated information regarding its current state and access rights)
- Associated documents, diagrams and other objects
- Inherent Risk detailing risk considerations
- Governance information detailing information about the published diagram and who has been involved in the approval of the diagram.

The above picture shows the properties dialogue window for the Balanced Scorecard Diagram, where you can view and edit the diagram’s properties in QualiWare Lifecycle Manager.