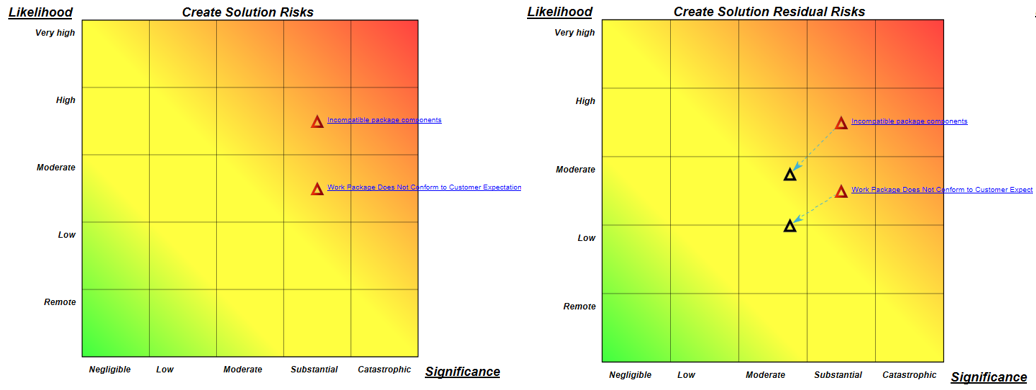
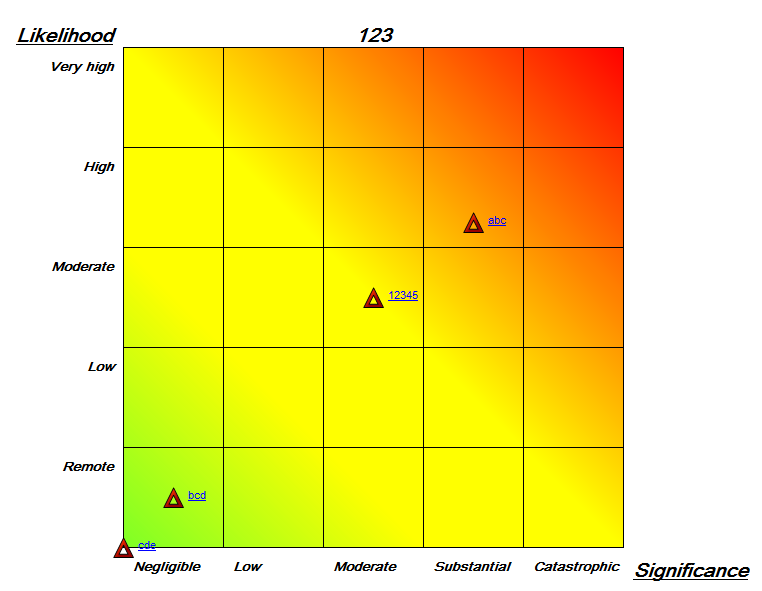
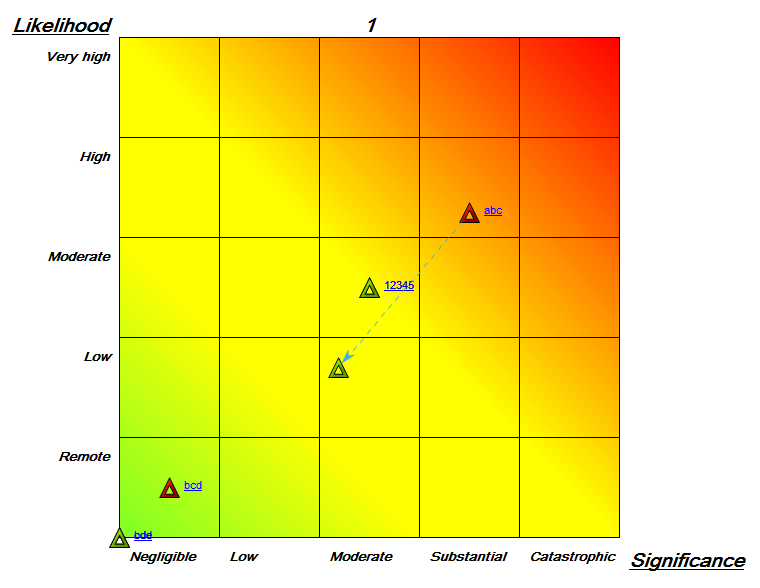
Risk Heat Maps can be used to graphically show how Risks are ranked from both an Likelihood and Significance point of view.
Example of Risk heat maps with and without residual risks:
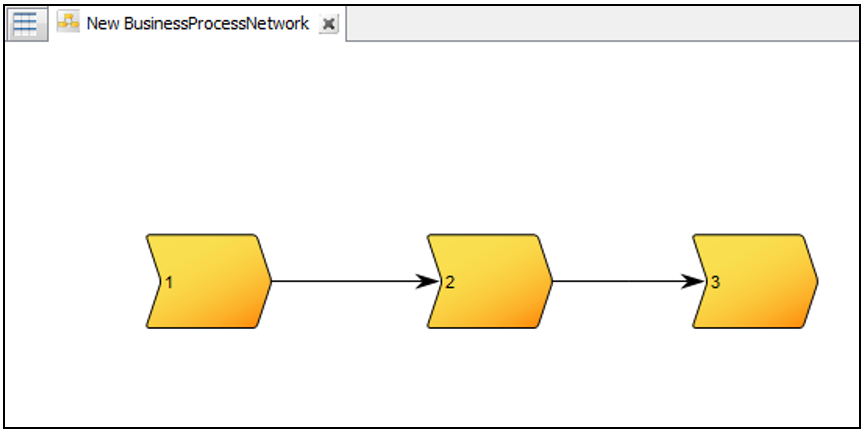
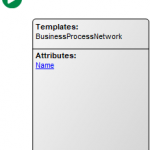
A Heat Map can be created for one or more objects within a diagram – for example a Workflow Diagram or a Business Process Network.
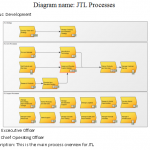
Example of a Business Process Network:
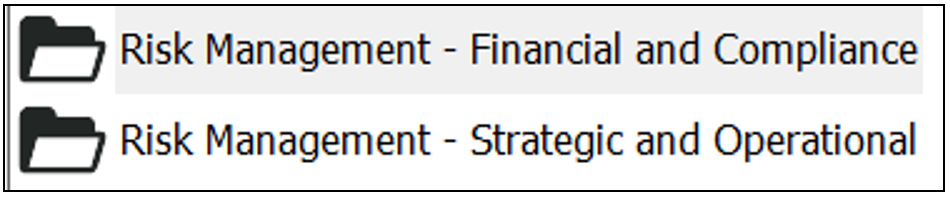
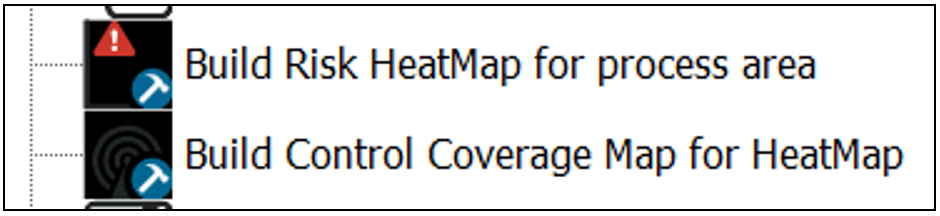
You can select one of the objects or all of the objects on the model. By then using the Actions tab you can select one of two Risk Management related toolbars:
Action menus from the Actions tab can be found on the right-hand side of a Diagram in QLM.
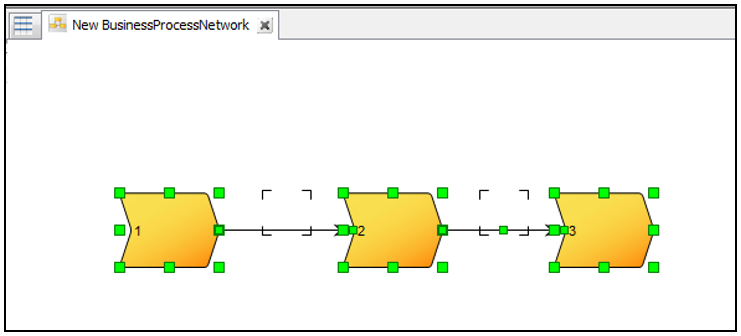
If you are dealing with Financial and Compliance related (e.g., SOX), the first choice would be what you would use. Alternatively, if you are dealing with Strategic and Operational Risk Management, then the second selection is appropriate, albeit the Risk Heat Map button is on both of the toolbars and will work regarding of your Risk Management focus. Below, you can see an example of a Business Process Network where all objects are selected:
Select one or more objects on the model. Select the “Create Risk Heat Map for process area button”:
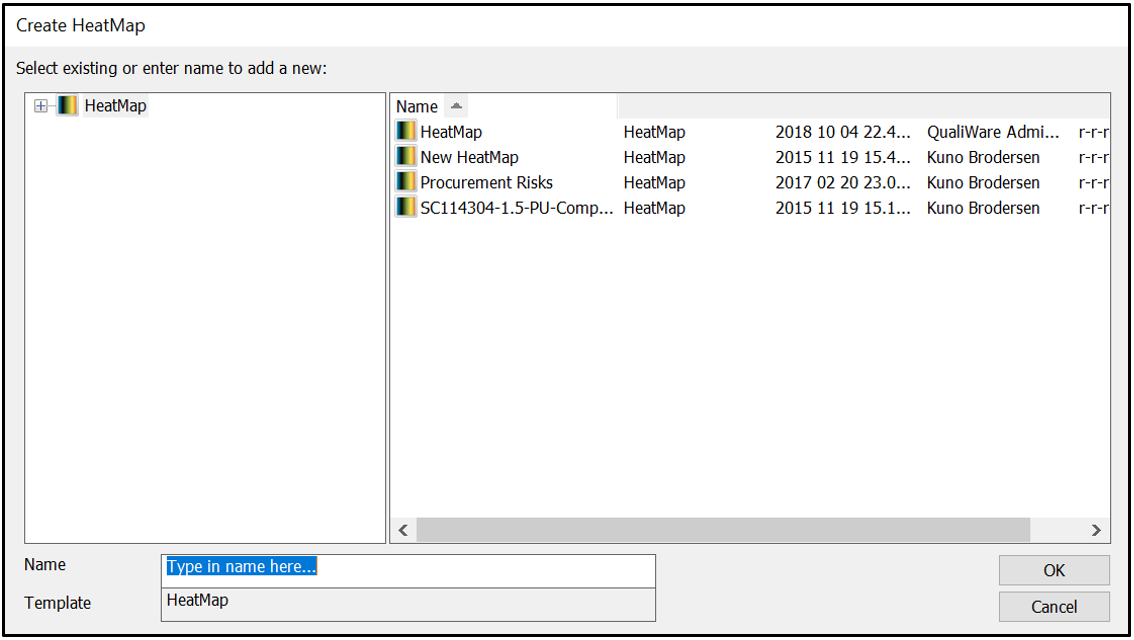
The user is then presented with the option to create and name a new Risk Heat Map, or to reuse an existing Heat Map:
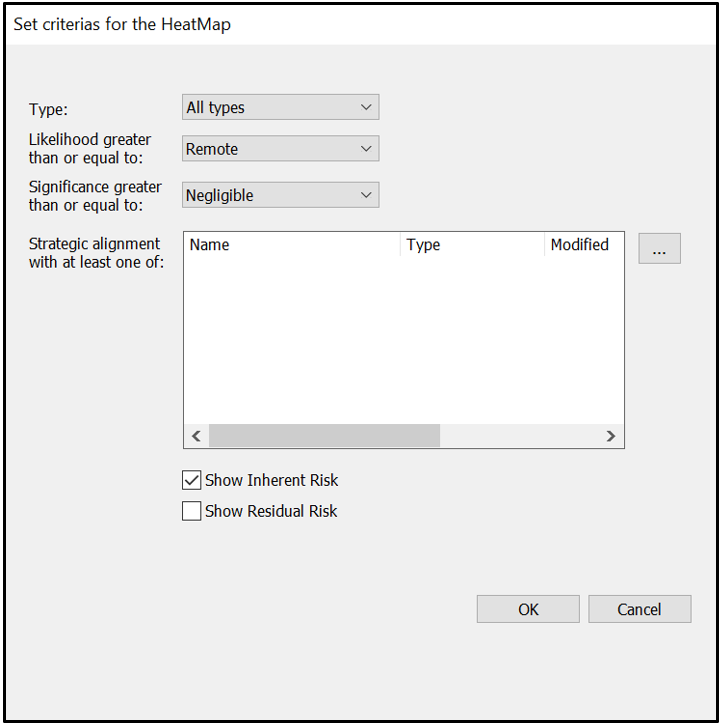
Next, the “set criteria” dialog for creating the Heat Map in QLM will appear:
The dialog permits the user to define what is shown on the Heat Map, including Inherent as well as Residual Risk. The resulting Heat Map will appear after the user selects OK:
When creating an Activity in an operational process model that is labeled as a Control or Key Control, the user also has the option to link to a ControlCoverage on the Coverage tab of the Activity. The ControlCoverage template permits the user to describe what level of coverage the Activity provides to mitigate the Risk, assuming that there may only be partial coverage, thereby leaving “Residual Risk”. On the ControlCoverage template the user is able to specify the coverage level. And, when a Heat Map is generated also displaying the Residual Risk, the user can see the Likelihood and Significance of the Risk at its Inherent and Residual levels:
Creating Control Coverage Maps
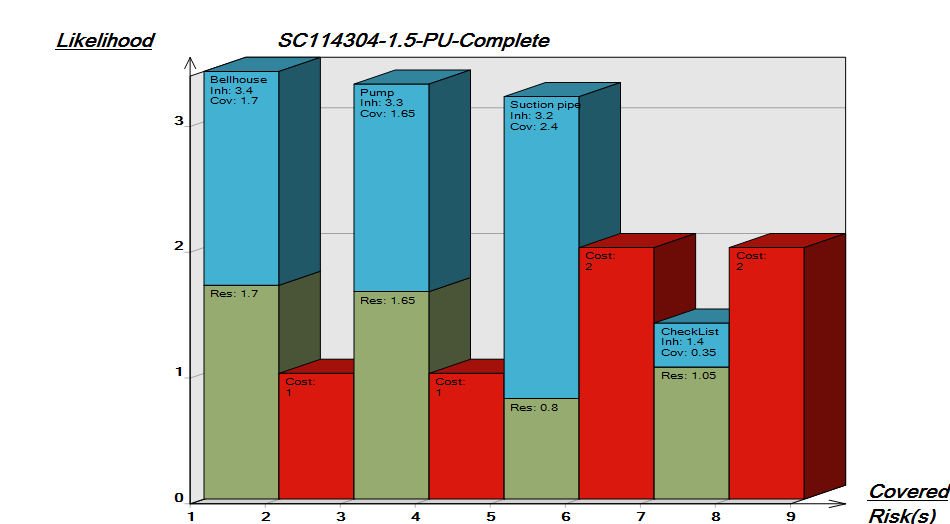
With the ControlCoverage template the user is also able to define the Cost Level; see the CostLevel tab on the ControlCoverage template. With the CoverageLevel and CostLevel completed for the ControlCoverage object and having this object linked to Risk(s), the user is also able to create what is referred to as a Control Coverage Map. With the Heat Map open and displayed on the QLM user interface, using the button on the Risk related toolbar a Control Coverage Map is created:
On this map each Risk is displayed with its Inherent (Blue) and Residual (Green) risk levels and the Cost (Red) is also displayed:
Other buttons on the Risk Management related toolbars include unique template views via the Repository Explorer, Matrices, Reports, etc. and each of the toolbar buttons can be explored but will not be addressed in this user documentation.
This guide covers the steps necessary to design a simple report.
Reports are designed via the template ReportDefinition.
Reports are always generated dynamically based on the content where they are executed. For example, if you click on the report button on a diagram, it will use the objects and their information contained on the diagram. To make this possible it is necessary to define what variables the ReportDefinition should gather and where it should place them in the report.
Designing a report consists of four stages: Designing the queries, arranging the attributes in the main report, designing sub-reports and finally applying advanced formatting.
In the design phase it is necessary to structure the data for the report. This is done via SQL. To remove the need of learning SQL QualiWare has introduced a Query Designer that helps users build SQL scripts and tables automatically based on a graphical diagram.
The queries are then used as input for the ReportDefinition where the individual attributes can be re-arranged graphically.
When designing a Query that needs to read the attributes of objects that are referenced in a multi-link field it is necessary to create sub-queries and sub-reports. Sub-reports gather and organize the attributes for the underlying objects and then are themselves inserted into the main report, just like the other attributes.
When the data has been defined, organized and arranged in the report it is necessary to apply advanced formatting to the report for aesthetic reasons.
This guide will describe the steps necessary to create a report that displays information about a BusinessProcessNetwork and the individual business processes contained in the diagram. The knowledge attained from this guide can then be used to build similar reports for other diagram types and objects, as the principles remain the same.
1 – Query Designer
1.1 – Designing the Query
This step details how to design the main query containing information about the BusinessProcessNetwork diagram.
Create a new QueryDesign name it “BusinessProcessNetwork Query”, and double-click it to open it
In the series of menus select From Repository, Diagram and BusinessProcessNetwork. This generated a diagram that contains a green Play button and a single Object Query for the template BusinessProcessNetwork with the attribute Name
QueryDesign ObjectQuery.
All of the attributes that are intrinsically a part of the object should be listed in the ObjectQuery’s attributes.
Attributes that should not be listed are links to other objects, which means connections like Contains, OwnedBy, HasResponsible, Employs etc. Out of those if any links are of the multi-link type, they need a sub-report which will be covered later.
Open the property dialog for ObjectQuery and navigate to the tab “Property”
For the field Object properties, right-click and click Insert…
Select the following properties: HTMLDrawing, AuditGS, OwnedBy, HasResponsible and Description
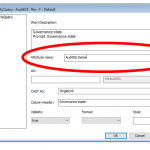
Because AuditGS points to a Governance State object, it is a link connection. This means that the field AuditGS points to the object which corresponds to the Governance State of the object at the given point in time. This is presented as a URL link There is a provision to remedy this by adding a .Name at the attribute. Instead of inserting the link it will insert the name of the object (in this case the governance state), which is what we are interested in.
In the property dialog for ObjectQuery “BusinessProcessNetwork”, on the tab Property, for the field Object properties, double-click on ObjectPropertyQuery “AuditGS” to open its property dialog
In the property dialog for ObjectPropertyQuery “AuditGS” for the field Attribute name type in AuditGS.Name
Do the same for OwnedBy and HasResponsible because these fields also point to an object
ObjectPropertyQuery for AuditGS.
1.2 – Generate Query
In order to generate the Query itself the green Play button needs to be double-clicked.
On the QueryDesign diagram “BusinessProcessNetwork Query” double-click on the green Play button to open the property dialog for GenericQuery “BusinessProcessNetwork Query”
In the property dialog for GenericQuery “BusinessProcessNetwork Query” navigate to the tab Query Filter and for the top field insert the string: T01.sys_ObjectId = '<qlmScript id="ObjID">'
Navigate back to the click the button Rebuild to build and open the GenericQuery table “BusinessProcessNetwork Query”
2 – Report Definition
Now that the query has been designed and generated it is possible to connect it to the ReportDefinition and design the main report.
2.1 – Connect ReportDefinition to GenericQuery
In the RepositoryExplorer, Right-click on ReportDefinition (it is an object template, not a diagram template), click New… and name the new ReportDefinition “BusinessProcessNetwork Report”
Double-click on ReportDefinition “BusinessProcessNetwork Report” to open its property dialog
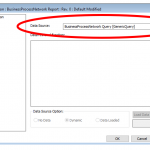
In the property dialog for ReportDefinition “BusinessProcessNetwork Report” navigate to the tab Data Source and for the field Data Source insert GenericQuery “BusinessProcessNetwork Query”, and click Apply
Connecting the GenericQuery to the ReportDefinition.
2.2 – Design the report with Report Wizard
In the property dialog for ReportDefinition “BusinessProcessNetwork Report”, Navigate to the tab ReportDefinition and click Wizard to open the Report Wizard window
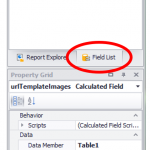
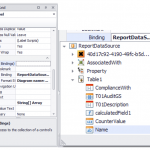
In the Report Wizard Window, on the right, click Field List and expand Table1
Where to locate Table1 in the Report Wizard.
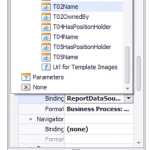
Drag the following fields into the Detail ribbon of the report: Name, T01AuditGS (the governance state), T01Description (the description of the diagram), T01sys_ObjedctId (an image of the BusinessProcessNetwork), T01OwnedBy (the owner of the diagram) and T01HasResponsible (the responsible for the diagram).
Click on each of the text-based fields and then click on the [>] button to open additional settings for the field
In the extra settings, for the field Format String, click on the three dots
On the category tab General for the field Prefix type in an appropriate text, for example “Diagram name: “ for the Name attribute
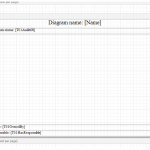
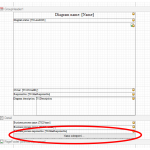
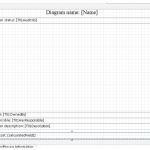
Rearrange the fields and enter a prefix for all the attributes as in the picture
The fields have been inserted, rearranged and got a prefix.
2.3 – Add a Table
Some attributes will require additional formatting tools, such as the description, which does not have a Formatting String option. In these cases a table can be used to add a prefix.
In the toolbar on the left click table and place a table inside the Detail ribbon
Delete columns in the table until there are two and change the size of the table to the full width
In the cell on the left type in “Diagram description: ”
For the cell on the right drag in the attribute T01Description
2.4 – Add a Page Break
It is a good idea to keep reports structured with page breaks.
In the toolbar on the left click on the Page Break icon
Click at the bottom of the Detail ribbon to add a page break
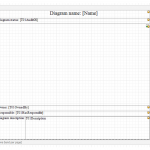
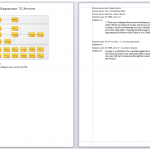
The Page Break can be seen as the dotted line just above the PageFooter ribbon.
2.5 – Preview Report
With the report designed it is now time to try out the report via the View button. The example will contain all BusinessProcessNetworks, whereas in a real use scenario it will be limited to a single BusinessProcessNetwork.
Save the report design with CTRL+S and then close the report designer
In the property dialog of ReportDefinition “BusinessProcessNetwork Report” click the View button to open an example of the report
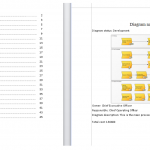
A test report can be previewed.
3 – Sub-Report
In order to get information about the BusinessProcesses contained on the BusinessProcessNetwork as well as the Regulations that the BusinessProcess points to it is necessary to create a sub-report which has its own query.
3.1 – Design a Sub Query
Single-link connections do not need a sub-report. Multi-link connections like Employs, AssociatedDocument and ComplianceWith need a sub-report.
Open QueryDesign “BusinessProcessNetwork Query”
Double-click on ObjectQuery “BusinessProcessNetwork” and click Expand from metamodel
Click Graphical
Click Full and click OK
This automatically adds a new ObjectQuery connected to the ObjectQuery “BusinessProcessNetwork” via a Contains RelationQuery.
Open the property dialog for the new ObjectQuery
In the property dialog for the new ObjectQuery for the field Template Filter remove everything except BusinessProcess
3.2 – Adding Properties
In the PropertyDialog for ObjectQuery “BusinessProcess”
Navigate to the tab Property and add the ObjectPropertyQuery OwnedBy and HasResponsible
Edit the ObjectPropertyQueries OwnedBy and HasResponsible by adding .Name to them, just like before
3.3 – Adding Relations
Double-click on ObjectQuery “BusinessProcess” and click Expand from metamodel
Click Relations
From the list select ComplianceWith and click OK
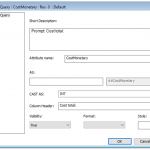
Open the property dialog for ObjectQuery “Regulation” and navigate to the tab Property
Insert ParagraphText and click OK to save your changes
3.4 – Adding a Concerns for the SubQuery
For the purposes of testing the report later, an object must be added to the concerns field of the subquery before the query is built properly.
On the diagram QueryDesign “BusinessProcessNetwork Report” open the property dialog for the RelationQuery ComplianceWith
In the property dialog, Open the GenericQuery in the field Subquery
Open the property dialog for the GenericQuery and navigate to the tab Advanced Query
Insert any BusinessProcess into the field Concerns
Click on the button Rebuild
3.5 – Generating the SubReport Query
On the diagram QueryDesign “BusinessProcessNetwork Query” double-click on the green Play button to generate the query
In the property dialog for GenericQuery “BusinessProcessNetwork Query” click Rebuild
In the Repository Explorer create a new ReportDefinition and name it “subBusnessProcessNetwork – BusinessProcess Regulation”
Double-click on the new ReportDefinition to open its property dialog and navigate to the Data Source tab
For the field Data Source insert the GenericQuery “BusinessProcessNetwork Query SubQuery_T03”
3.6 – Design the SubReport
Ensure that the property dialog for ReportDefinition “subBusnessProcessNetwork – BusinessProcess Regulation”
Navigate to the tab ReportDefinition and click Wizard
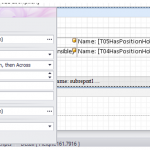
The SubReport must now be designed. Design it to fit the picture below:
The Regulation properties have been placed and arranged in the Report Wizard for the Sub Report.
Save and close the report designer
3.7 – Insert Sub Report into Main Report
Open the property dialog for ReportDefinition “BusinessProcessNetwork Report”
Navigate to the tab Associate->Other and insert ReportDefinition “subBusnessProcessNetwork – BusinessProcess Regulation” into the Associated with field
Navigate to the tab ReportDefinition and click Wizard to open the report designer
In the lower left corner of the screen click Add a Group and click Name
Move all the previously arranged objects to the GroupHeader1 ribbon
Insert T02Name, T02OwnedBy and T02HasResponsible into the Detail ribbon
On the right in the Field List unfold the AssociatedWith group and insert “subBusnessProcessNetwork – BusinessProcess Regulation” into the report
The sub report is inserted into the main report the same way as an attribute.The contents, as designed in the sub report, can be seen in the main report.
3.8 – Add the ReportDefinition to a Template
Open the Publisher with CTRL+H
Navigate to the tab Template Definitions
Open the property dialog for TemplateDefinition “BusinessProcessNetwork”
In the property dialog for TemplateDefinition “BusinessProcessNetwork” for the field “Report definitions” inser the ReportDefinition “BusinessProcessNetwork Report” and click OK to save your changes
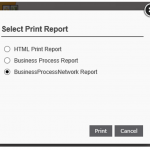
The ReportDefinition will now be available when the Print button is clicked
The new Report Definition can be seen on the web when the Print button is clicked.
4 – Advanced Formatting
Advanced formatting techniques can be used to improve the readability and usability of the report.
4.1 – Calculated Fields
Calculated fields can be used to sum up a series of objects. In this example the costs of all BusinessProcesses will be summed together to find out the total cost of the workflow.
In the QueryDesign for the ObjectQuery “BusinessProcess” add Object Property CostMonetary. Make sure that it is cast as an INT and not as a VARCHAR, so it can be calculated.
For calculated fields it is important that the Property is cast as an INTeger.
Double-click the green Play button and Rebuild the Query
Go to the ReportDefinition Wizard
In the Field List for Table1, right-click and click “Add calculated field”
Right-click on calculatedField1 and for the Expression field type in Sum([T02CostMonetary])
Add a text label and type in Total cost: [calculatedField1]
The calculated field has been inserted in the ReportDefinition via the Report Wizard.
4.2 – Table of Contents
A table of contents that lists all the important chapters in the report can greatly improve the usability of the report for the reader.
4.2.1 – Add a bookmart to all relevant elements
Select Diagram name: [Name] and in the Property Grid, scroll down to Data->Data bindings->Bookmark->Binding
Set the binding to Name
Set the Format String to Diagram name: {0}
A data binding has been set for the BusinessProcessNetwork Name.
Select Business Process Name: [T02Name] and in the Property Grid, scroll down to Data->Data bindings->Bookmark->Binding
Set the binding to T02Name
Set the Format String to Business Process: {0}
The Data Binding has been set for the BusinessProcess Name.
4.2.2 – Insert Report Header Band and Add Table of Contents
Right-click on an empty space inside a band and click Insert Band->Report Header
In the toolbar on the left, click on Table of Contents and click inside the Report Header Band
Rename the title of the Table of contents to “Table of Contents”
A preview of the table of contents.
4.3 – Insert Company Logo
A logo can be inserted into the report – ideally in the PageHeader ribbon.
The logo can be found in the Field List under Property->LogoUrl.
Drag the LogoUrl into the report PageHeader in order for it to appear at the top of every page in the report.
To find the logo, navigate to the folder: [QLM Installtion Folder]\Models\qishtml\QEP\Images
To change the logo replace the file _logo.png with a different image.
4.4 – Keep Together
If you have a group of information that cannot be contained in one page, the content will continue on the next page. This can be confusing in a report. Use the “Keep together” feature to force the report to keep all related content in the Details band together on one page.
Select the Details band, click on the > button and set a checkmark in “Keep together”.
Elements in a band can be kept on the same page via the Keep Together functionality.
4.5 – Adding Page Numbering
Numbering all the pages in the report can ease navigation for the printed report.
Page numbers can be inserted via the page info button in the toolbar on the left.
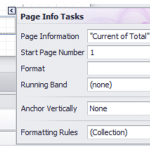
The page info can be further configured via the > option.
Page numbering can be inserted and configured via Page Info.