Creating Risk Heat Maps
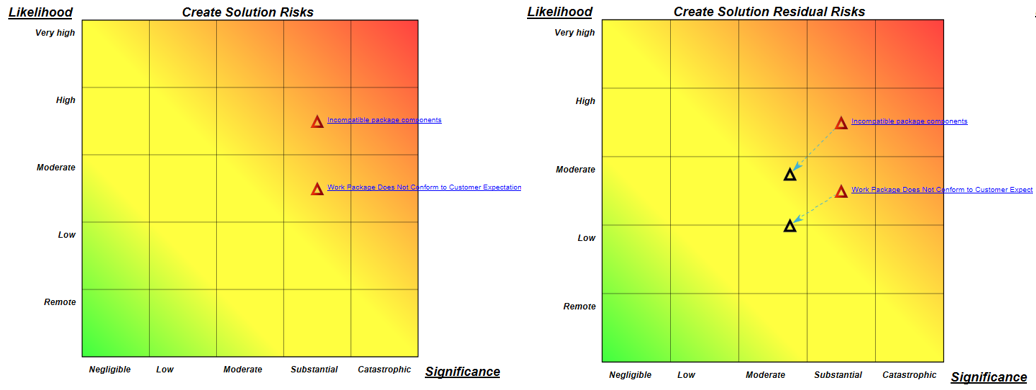
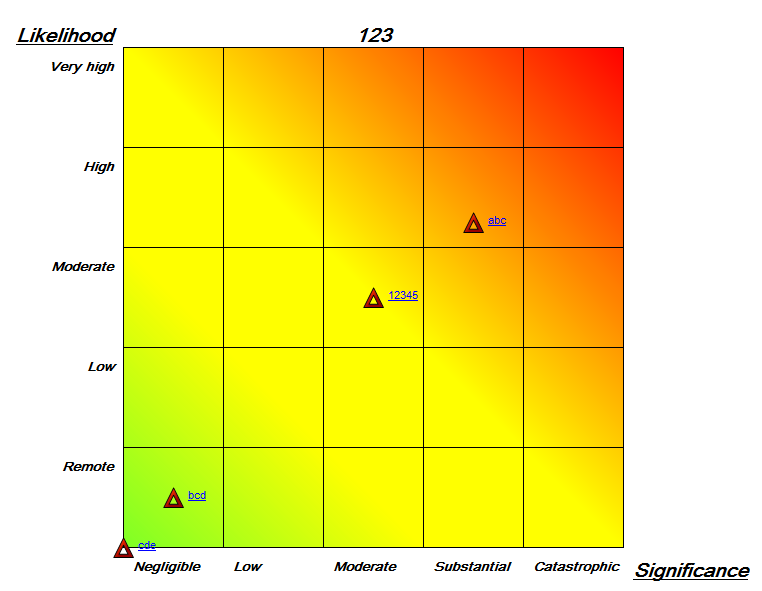
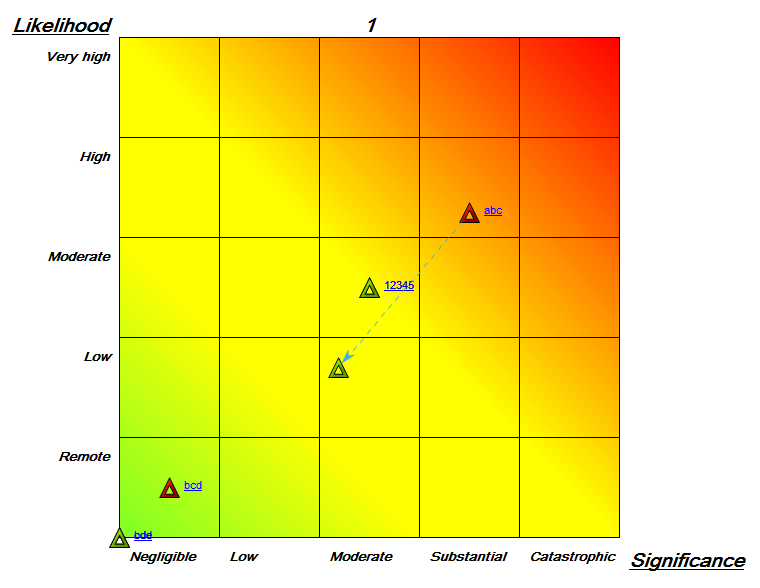
Risk Heat Maps can be used to graphically show how Risks are ranked from both an Likelihood and Significance point of view.
Example of Risk heat maps with and without residual risks:
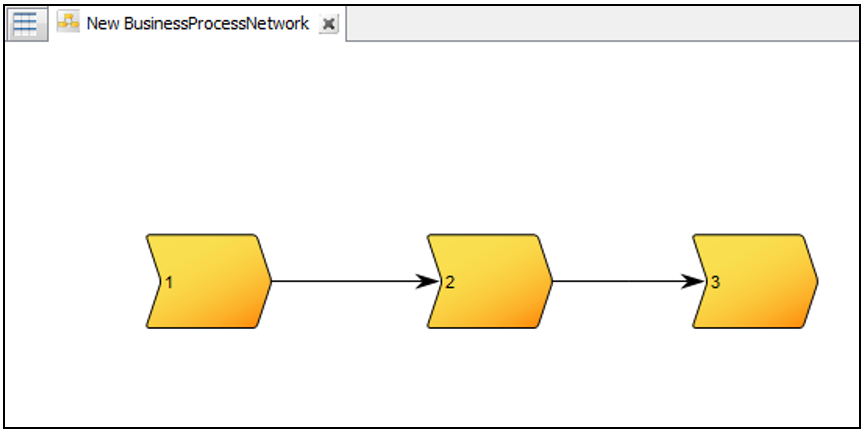
A Heat Map can be created for one or more objects within a diagram – for example a Workflow Diagram or a Business Process Network.
Example of a Business Process Network:
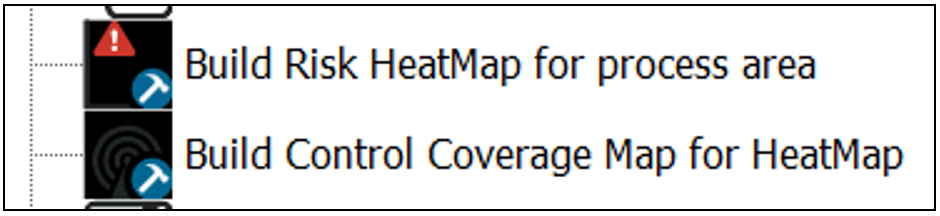
You can select one of the objects or all of the objects on the model. By then using the Actions tab you can select one of two Risk Management related toolbars:
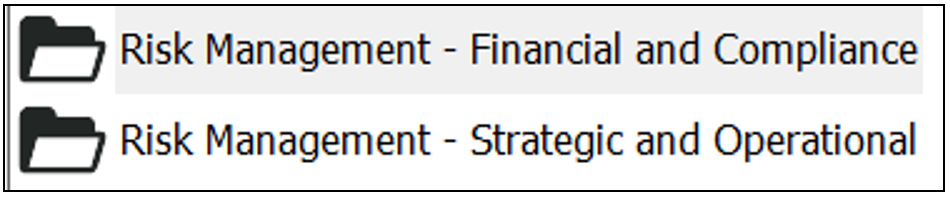
Action menus from the Actions tab can be found on the right-hand side of a Diagram in QLM.
If you are dealing with Financial and Compliance related (e.g., SOX), the first choice would be what you would use. Alternatively, if you are dealing with Strategic and Operational Risk Management, then the second selection is appropriate, albeit the Risk Heat Map button is on both of the toolbars and will work regarding of your Risk Management focus. Below, you can see an example of a Business Process Network where all objects are selected:
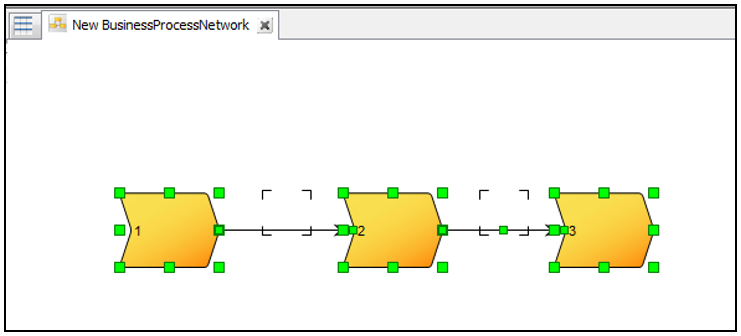
Select one or more objects on the model. Select the “Create Risk Heat Map for process area button”:
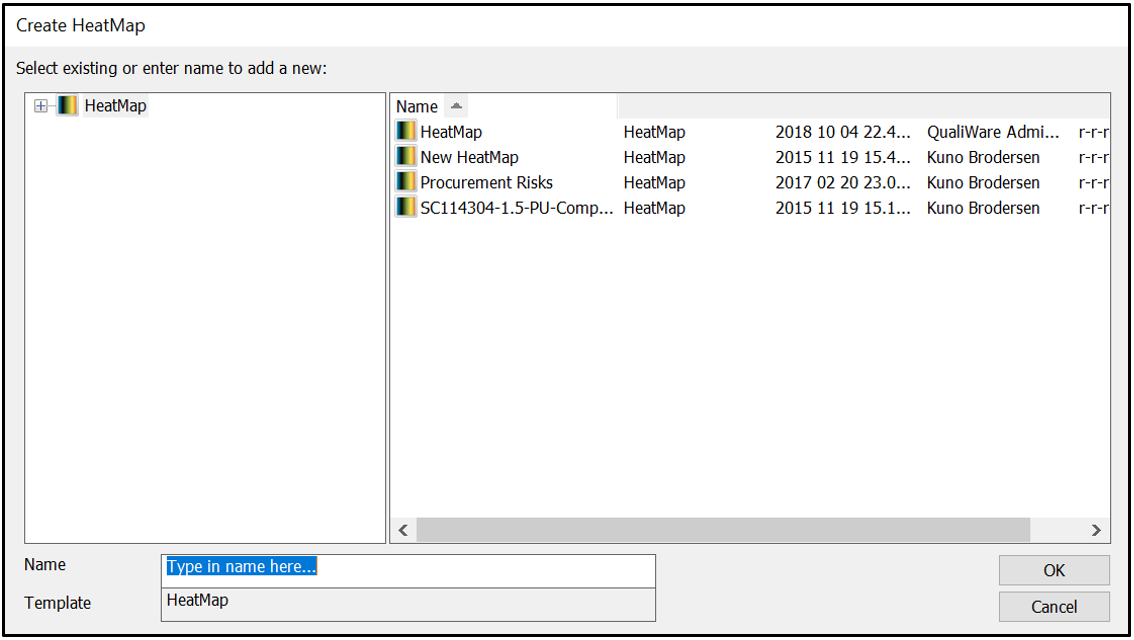
The user is then presented with the option to create and name a new Risk Heat Map, or to reuse an existing Heat Map:
Next, the “set criteria” dialog for creating the Heat Map in QLM will appear:
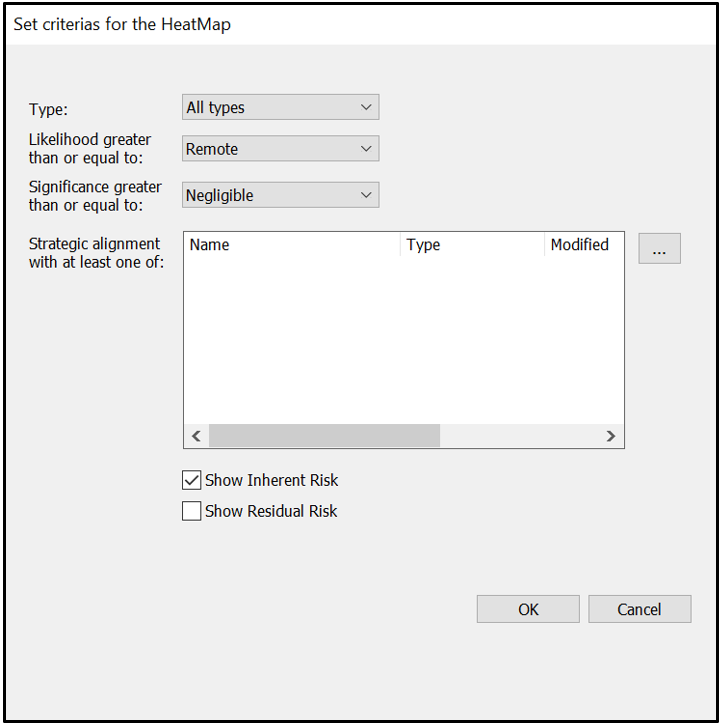
The dialog permits the user to define what is shown on the Heat Map, including Inherent as well as Residual Risk. The resulting Heat Map will appear after the user selects OK:
When creating an Activity in an operational process model that is labeled as a Control or Key Control, the user also has the option to link to a ControlCoverage on the Coverage tab of the Activity. The ControlCoverage template permits the user to describe what level of coverage the Activity provides to mitigate the Risk, assuming that there may only be partial coverage, thereby leaving “Residual Risk”. On the ControlCoverage template the user is able to specify the coverage level. And, when a Heat Map is generated also displaying the Residual Risk, the user can see the Likelihood and Significance of the Risk at its Inherent and Residual levels:
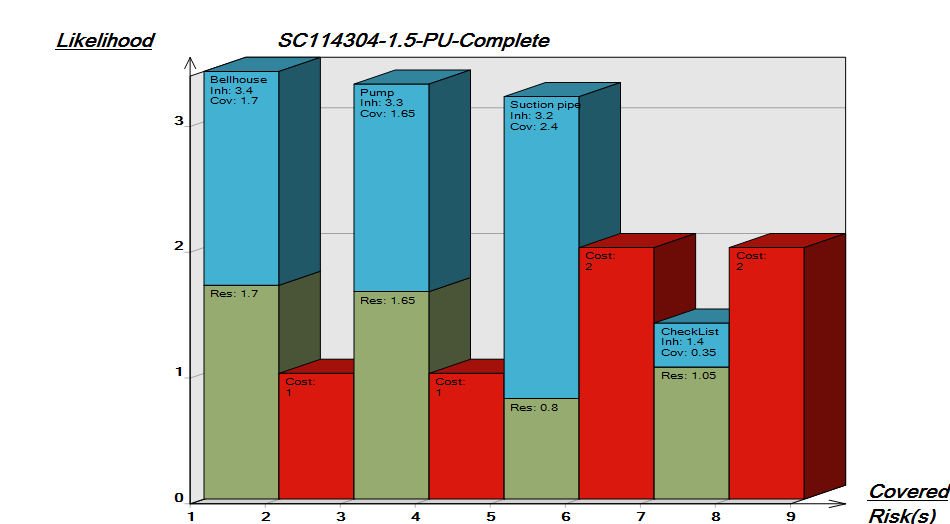
Creating Control Coverage Maps
With the ControlCoverage template the user is also able to define the Cost Level; see the CostLevel tab on the ControlCoverage template. With the CoverageLevel and CostLevel completed for the ControlCoverage object and having this object linked to Risk(s), the user is also able to create what is referred to as a Control Coverage Map. With the Heat Map open and displayed on the QLM user interface, using the button on the Risk related toolbar a Control Coverage Map is created:

On this map each Risk is displayed with its Inherent (Blue) and Residual (Green) risk levels and the Cost (Red) is also displayed:
Other buttons on the Risk Management related toolbars include unique template views via the Repository Explorer, Matrices, Reports, etc. and each of the toolbar buttons can be explored but will not be addressed in this user documentation.