Balanced Scorecard Diagram

Purpose: The purpose of the Balanced Scorecard Diagram is to model Balanced Scorecards, as described by Robert Kaplan and David Norton in 1992.

Core concern: Usually, a Balanced Scorecard Diagram template measures the state of the enterprise via Key Performance Indicators that are categorized into four different perspectives using Business Scopes. Aside from this, the template enables you to model general concepts and cause/effect.

Below, you can see an example of a Balanced Scorecard Diagram:
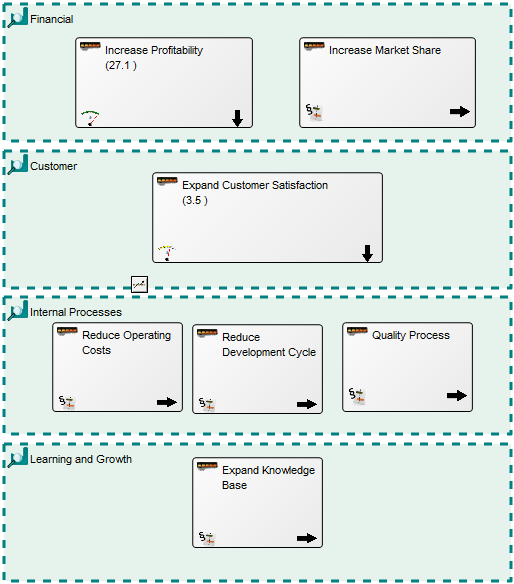
BalancedScoracardDiagram_1

Relation to other templates: The Balanced Scorecard Diagram can be used to create a Performance Evaluation Model or a Strategic Management Diagram the Key Performance Indicators it contains can be broken down into Performance Diagrams offering a detailed view of how the organization performs. If CXO dashboards are to be created, the Strategy Model should be used instead.

Properties and metadata: The Balanced Scorecard Diagram can for example retain the following information:

  • A description of the diagram
  • Link to the owner of the diagram
  • Link to the one responsible for the diagram
  • Audits (auto generated information regarding its current state and access rights)
  • Associated documents, diagrams and other objects
  • Inherent Risk detailing risk considerations
  • Governance information detailing information about the published diagram and who has been involved in the approval of the diagram.
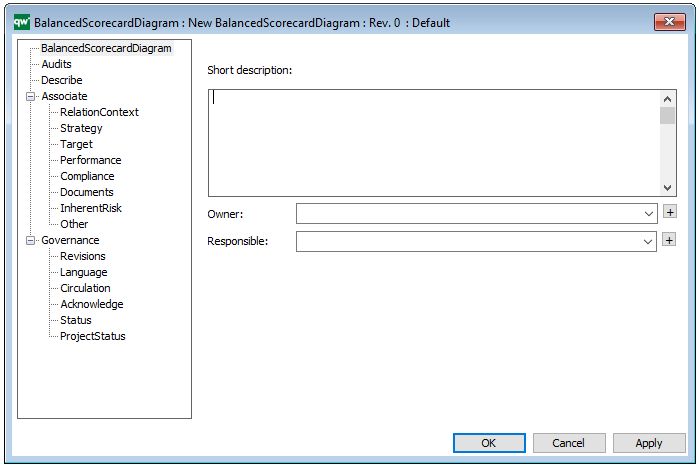
The above picture shows the properties dialogue window for the Balanced Scorecard Diagram, where you can view and edit the diagram’s properties in QualiWare Lifecycle Manager.

Application Functionality Context

Purpose: The purpose of the Application Functionality Context template is to document the in which Activities and/or Business Processes a given Application Functionality is used.

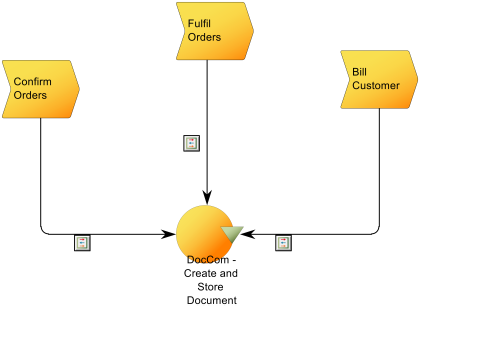
Core concerns: The Application Functionality Context template can be used to create graphical views showing where Application Functionalities are used. The template enables you to model Application Functionalities, Activities and Business Processes. The Business Processes and Activities are connected to Application Functionalities using Functionality Usage.

Below, you can see an example of an Application functionality contest diagram, where the context for the DocCom – Create and Store Document functionality is shown:

The diagram shows which Business Processes use the Application Functionality as well as which Information System delivers it.

Relation to other templates: To map applications hardware, the Application Architecture Diagram or Infrastructure Diagram template should be used. The Application Functionality Context template graphically connects functionalities of Information Systems to the Processes and Activities in which they are used. It offers an additional view to Application Architecture Diagrams, Workflow Diagrams, Business Process Diagrams and Business Process Networks.

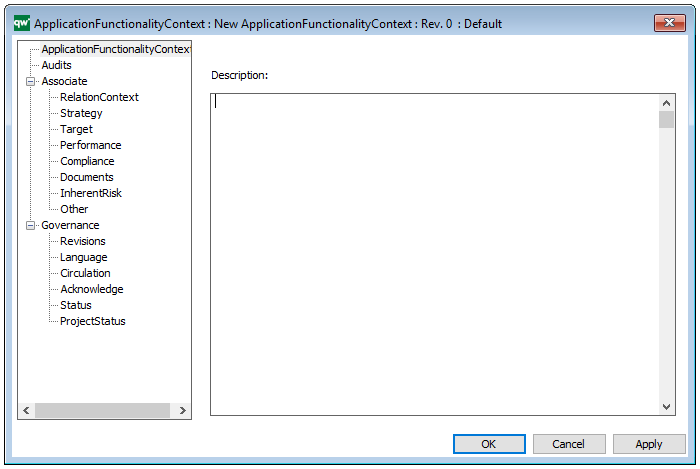
Properties and metadata: The Application Functionality Context template ­­­­can for example retain the following information:

  • A description of the diagram
  • Audits (auto generated information regarding its current state and access rights)
  • Associated documents, diagrams and other objects
  • Inherent Risk detailing risk considerations
  • Governance information detailing information about the published diagram and who has been involved in the approval of the diagram

The above picture shows the properties dialogue window for the Application Functionality Context template where you can view and edit the diagram’s properties in QualiWare Lifecycle Manager.
Stakeholder Viewpoint : Archimate

Concerns: Architecture mission and strategy, motivation
Purpose: Designing, deciding, informing
Scope: Motivation

The stakeholder viewpoint allows the analyst to model the stakeholders, the internal and external drivers for change, and the assessments (in terms of strengths, weaknesses, opportunities, and threats) of these drivers. Also, the links to the initial (high-level) goals that address these concerns and assessments may be described. These goals form the basis for the requirements engineering process, including goal refinement, contribution and conflict analysis, and the derivation of requirements that realize the goals.

Goal Realization Viewpoint: Archimate

Concerns: Architecture mission, strategy and tactics, motivation
Purpose: Designing, deciding
Scope: Motivation

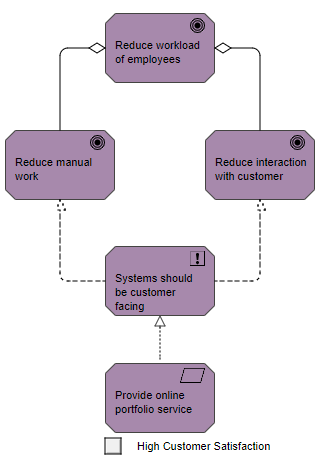
The goal realization viewpoint allows a designer to model the refinement of (high-level) goals into more tangible goals, and the refinement of tangible goals into requirements or constraints that describe the properties that are needed to realize the goals. The refinement of goals into sub-goals is modeled using the aggregation relationship. The refinement of goals into requirements is modeled using the realization relationship.

In addition, the principles may be modeled that guide the refinement of goals into requirements.

Requirements Realization Viewpoint : Archimate

Concerns: Architecture strategy and tactics, motivation
Purpose: Designing, deciding, informing
Scope: Motivation

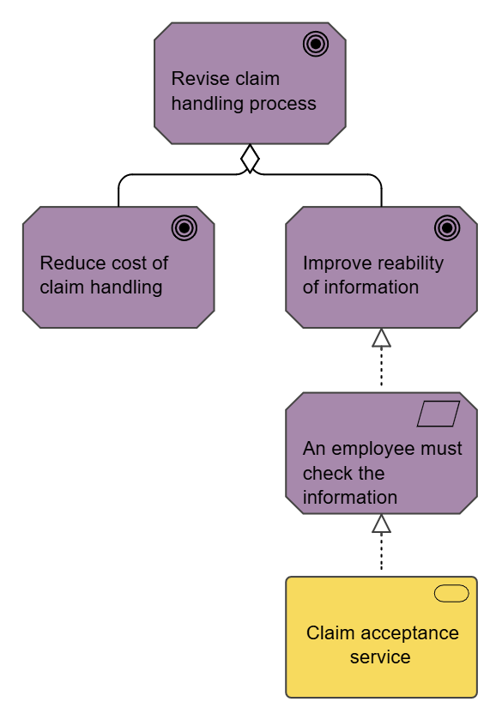
The requirements realization viewpoint allows the designer to model the realization of requirements by the core elements, such as business actors, business services, business processes, application services, application components, etc. Typically, the requirements result from the goal refinement viewpoint.

In addition, this viewpoint can be used to refine requirements into more detailed requirements. The aggregation relationship is used for this purpose.

Motivation Viewpoint : Archimate

Concerns: Architecture strategy and tactics, motivation
Purpose: Designing, deciding, informing
Scope: Motivation

The motivation viewpoint allows the designer or analyst to model the motivation aspect, without focusing on certain elements within this aspect. For example, this viewpoint can be used to present a complete or partial overview of the motivation aspect by relating stakeholders, their primary goals, the principles that are applied, and the main requirements on services, processes, applications, and objects.