Business Process Diagram

ea3-business

The Business Process area spans one of the most diverse modeling fields in practice. Many tool vendors use proprietary modeling methods and notations, and the international standards in the field are weak.

  • IDEF0 Business Process Diagram
  • BPMN Business Process Diagram
  • Swim Lane Process Diagram

IDEF0 Business Process Diagram

A Business Process Diagram shows a detailed breakdown of an activity, including how each step in the activity relates to the others.

idef0
IDEF0 example

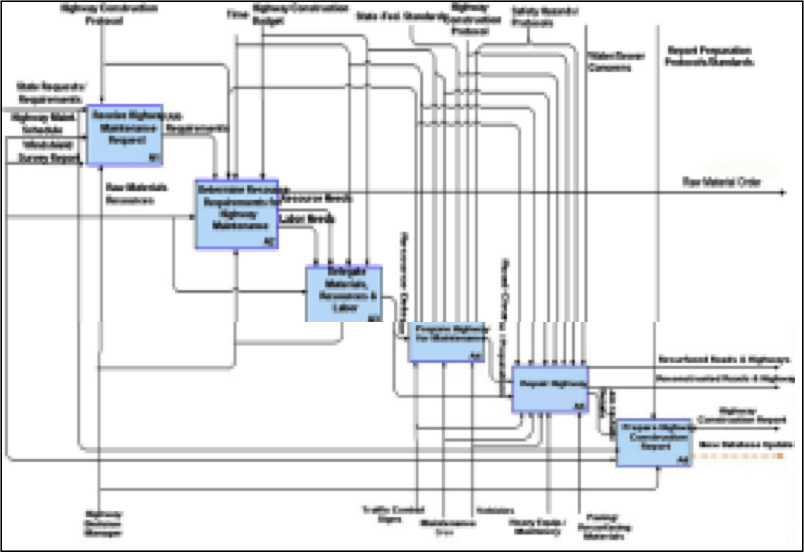
The diagram follows the IDEF-0 modeling technique to show what the inputs, controls, outputs, and mechanisms are for each step in the process. This method for modeling business processes is known as the Integration Definition for Function (IDEF) technique.  Developed in the mid-1970’s for modeling complex military projects,

IDEF-0 activity modeling is suitable for business process documentation in that it provides both high level context views, and more detailed views of each step in the activity in a format that can be further decomposed and interrelated with other processes to show linkages. This type of diagram is useful in showing linkages between steps and internal/external influences, but may not indicate a time sequence.

IDEF-O Activity Modeling

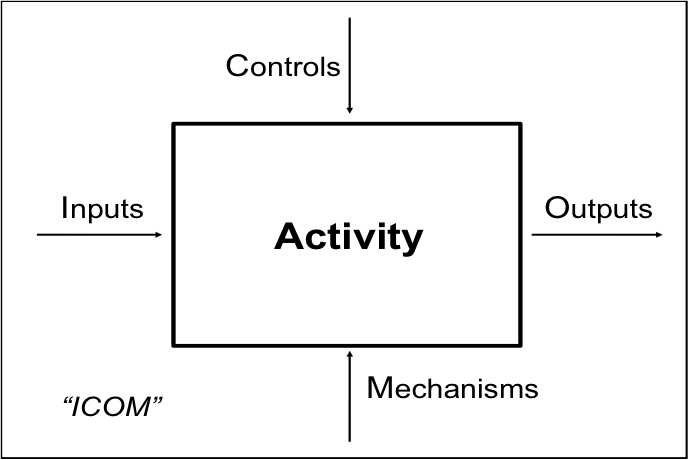
IDEF-0 uses Inputs, Outputs, Controls and Mechanisms (ICOM) to show the parts of an activity within an enterprise.:

  • Inputs: Items that initiate/trigger the activity and are transformed, consumed, or become part.
  • Controls: Guide or regulate the activity; usually indicate when/ how a process will be performed.
  • Outputs: The results produced by the activity; the reason for which the process was performed.
  • Mechanisms: Systems, people, and equipment used to perform the activity.

BPMN Business Process Diagram

bpmn
BPMN example from OMG.

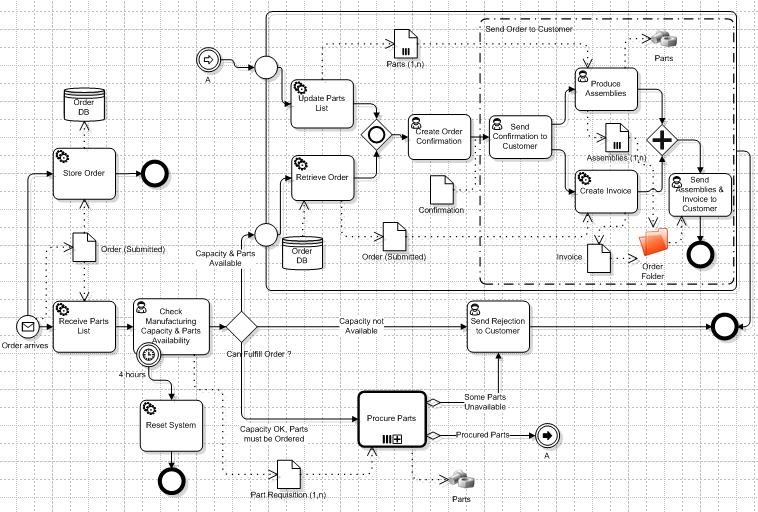
Business Process Model and Notation (BPMN) is a graphical representation for specifying business processes in a business process model. It was previously known as Business Process Modeling Notation. Business Process Management Initiative (BPMI) developed BPMN, which has been maintained by the Object Management Group (OMG) since the two organizations merged in 2005. As of March 2011, the current version of BPMN is 2.0.

The Danish government earlier strongly promoted BPMN and made BPMN 1.1 an officially recommended standard in 2009. The Danish Local Government Association (KL) invested heavily in process diagraming work and sharing via Arbejdsgangsbanken, but decided to close / freeze it last Winter.

Recommendation: Use “BPMN Light”.

Swim Lane Process Diagram

Figure 7-3: Example "Swim Lane" Diagram of a Process
Example “Swim Lane” Diagram of a Process

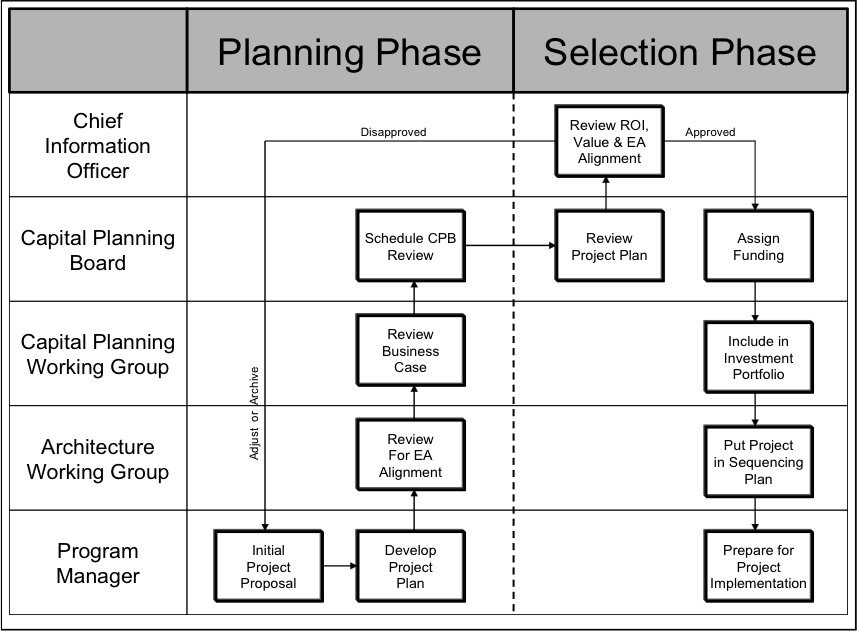
A Stakeholder Activity Diagram shows which stakeholders (those with a vested interest in the enterprise) are involved with line of business processes, and the timing of that interaction. The diagram uses the format of ‘swim lanes’ to arrange stakeholders by row, and timeframes by column, then overlaying activities with flowchart symbology.

Performance Measures Scorecard

ea3-strategy
The Balanced Scorecard™ goes beyond financial measures of success for an enterprise and establishes goals and measures in four key business views: Customer;, Financial; Internal Business Processes; and Learning and Growth.

Description

“The Balanced Scorecard™ suggests that people should view the enterprise from four perspectives, (not just a money perspective) and should develop metrics, collect data, and analyze the enterprise relative to each of these perspectives, as is shown in the figure to the right.”

balanced
“The Balanced Scorecard™ is a management and measurement system that enables enterprises to clarify their vision and strategy and translate them into action. The scorecard provides feedback around both the internal business processes and external outcomes in order to continuously improve strategic performance and results. When fully deployed, the balanced scorecard transforms strategic planning from an academic exercise into the nerve center of an enterprise.”

SWOT Analysis

ea3-strategy
EA3 artifact S-4: Strength, Weakness, Opportunity, Threat (SWOT) Analysis.

This analysis looks at the enterprise by identifying internal and external factors which when mapped can reveal areas for improvement and focus.

The Strength, Weakness, Opportunity, and Threat (SWOT) Analysis takes a holistic look at the enterprise by identifying internal and external factors which when mapped can reveal areas for improvement and focus.

Example

One of the earliest activities the enterprise performs in developing a strategic plan is a ‘Strength, Weakness, Opportunity, Threat’ (SWOT) Analysis. This analysis looks at internal and external factors to determine areas that the enterprise should focus on to increase its survivability and success, as well as areas that the enterprise should avoid, or decrease its exposure to. The results of the SWOT Analysis should be summarized in the Strategic Plan along with the matrix table illustrated below, and the full SWOT Analysis is archived in the EA Repository as a separate primitive artifact (S-2). The following is an example of a way to summarize a SWOT Analysis.

Figure 6-3: Example ofa SWOT Analysis Summary Table

From the identification of Internal Strengths (S), Internal Weaknesses (W), External Opportunities (O), and External Threats (T) for the enterprise, a matrix arrangement like the example above can help to reveal internal and external areas to focus on. This SWOT Analysis is also used to help enterprise architects and strategic planners to develop Concept of Operations (CONOPS) scenarios that detail current and future operating environments.

Concept of Operations Scenarios

ea3-strategy
EA3 artifact S-3: CONOPS Scenario and Diagram

A Concept of Operations Scenario is a narrative document that describes how the enterprise operates currently or will operate several years in the future given certain stated internal and external factors identified in the SWOT Analysis. The scenario is footnoted with planning assumptions.

Example

Planning Assumptions
1. New Video Teleconferencing capability.
2. Product roll-outs at National conferences.
3. Need to hold detailed product discussions on short notice, globally.
4. 24×7 work availability.
5. Increased suburban commuting and telecommuting.
6. Tracking of Govt. reports to anticipate product needs.
7. Changing population demographics, driving new product development.
8. Increased cost benefit of solar powered lighting.
9. Additional product features to attract customers
10. Global use of PDAs for employee communication.
11. Integration of sales, marketing, and production information.
12. Accurate customer quotes on the fly.
Jeff Linder, Vice President of Industrial Sales for Danforth Manufacturing Company (DMC) had just finished a presentation at the 2008 National Highway Safety Conference along with Richard Danforth, DMC’s CEO, who had teleconferenced in on the big display screen behind the podium.1 As Jeff was leaving the main conference room, Andrea Newman, Director of Safety and Transportation for the State of Tennessee, asked Jeff if they could talk about the new line of solar-powered highway lights he had just given a presentation on. 2, 3

“Thanks for taking a minute to talk Jeff. I want to tell you about a situation we have in Tennessee and see if your new product line can help” said Andrea as they found a table in the refreshment area.4 “No problem, thanks for asking” Jeff said. Andrea pulled up a document on her tablet computer and said “Jeff, here is a report that shows an increasing number of serious accidents in rural areas of Tennessee involving passenger cars and agricultural equipment or commercial trucks. We’ve attributed it to the growth of suburban communities further out in the countryside that then depend on two-lane country roads for commuting into the city.5 When you put slow tractors and trucks together with cars that are in a hurry at all hours to get somewhere, you have a recipe for disaster.” “Isn’t this problem being seen in other places around the country?” asked Jeff. “Yes, and one of the contributing factors that is consistently coming out of investigations of the night-time accidents is the lack of good lighting on these country roads.6 I am thinking that your highway grade solar lighting can help us provide more night visibility on high-risk rural roads without needing electrical infrastructure.” 7, 8

Jeff thought for a minute before responding. “You know, the new line of highway lights has options to incorporate 911 emergency call boxes and Global Positioning System (GPS) equipment that can connect to both State and local level first responders.9 This might be useful in also improving response times should an accident occur in spite of the improved lighting.” Andrea nodded and said, “Yes, I doubt that better lighting will solve the entire problem, but it will help people see each other better, and these other options can improve accident response times. What is the pricing on these units?”

Jeff pulled his Personal Digital Assistant (PDA)10 out of his pocket and connected to DMC’s marketing and sales database at headquarters via a satellite Internet link.11 “Andrea, these units are $11,300 each, including the GPS and 911 features.” Andrea took notes and responded, “If I can get permission to conduct a pilot test in a couple of months can you provide the lights?” Jeff asked “How many miles of road?” “About four miles in the particular area I’m thinking of” said Andrea. “Ok, the suggested density for the new unit is 18 per mile, so that would be 72 units total. I can give you our 10 percent early-adopter discount, so the total would be $732,240. Let me check what the shipping time would be.”

Jeff sent a high priority email to Bob Green, Vice President of Manufacturing. Bob was in the factory when he received Jeff’s email on his PDA, and after checking the DMC Production Scheduling System, responded two minutes later that a special order for 72 units could be completed and shipped 35 days from when the order is received. Jim relayed this information to Andrea, who said, “Wow, that’s fast. I have all the information I need to propose the project, I’ll get back to you next week” 12

Concept of Operations Diagram

A Concept of Operations (CONOPS) diagram is a high-level graphical depiction of the how the enterprise functions, either overall, or in a particular area of interest.

Example Diagram

conops
This CONOPS Diagram shows at a high level how a fictitious system called the ‘Hurricane Warning System’ would conduct its primary mission of providing a coordinated weather surveillance and reporting capability using land-based, sea-based, airborne, and space-based resources.

Here is another example:
conops-fra

Strategic Plan

ea3-strategyEA3 artifact S2: Strategic Plan

A Strategic Plan is a high-level policy and planning document that an enterprise uses to document its direction, competitive strategy, most important goals, and the enabling programs and projects (strategic initiatives). The Strategic Plan covers a future period, usually 3-5 years.

Description

A Strategic Plan is a composite EA artifact that should guide the enterprise’s direction over a 3-5 year period in the future by providing the following items, each of which are primitive (basic) EA artifacts. Full versions of abbreviated primitive artifacts are separate artifacts.

  • Provide a Mission Statement and a Vision Statement that succinctly captures the purpose and direction of the enterprise.
  • Develop a Statement of Strategic Direction that fits the enterprise’s purpose, ensures survivability, allows for flexibility, and promotes competitive success. This statement is a detailed description of where the enterprise intends to go.
  • Summarize the results of a SWOT Analysis that is based on the statement of strategic direction and which identifies the enterprise’s strengths, weaknesses, opportunities, and threats. The full SWOT analysis is artifact S-2.
  • Summarize the situation and planning assumptions for several ‘Concept of Operations’ CONOPS Scenarios that support the enterprise’s strategic direction. This summary should include one current scenario that describes at a high-level the coordination of ongoing activities in each line of business, as well as several future scenarios that account for different combinations of internal and external drivers identified through the SWOT Analysis. The complete scenarios are artifact S-3.
  • Develop a CONOPS Diagram that in a single picture captures the essence of and participants in the current operating scenario. This graphic is artifact S-4.
  • Develop a General Competitive Strategy for the enterprise that incorporates the current and future CONOPS scenarios and moves the enterprise in the intended strategic direction in a way that and address internal/external drivers such as culture, line of business requirements, market conditions, competitor strategies, and risk.
  • Identify Strategic Goals that will accomplish the competitive strategy, and specify the executive sponsors who are responsible for achieving each goal. Identify Strategic Initiatives and resource sponsors for the initiatives, which are the ongoing programs or development projects that will accomplish each Strategic Goal.
  • Summarize Outcome Measures for each Strategic Goal and Initiative, using the Balanced Scorecard™ or similar approach. The full scorecard is artifact S-5.

Mission Statement
An enterprise’s Mission Statement succinctly describes the purpose and direction of the enterprise.  This statement should be long enough to get the point across but provide no detail (1-2 sentences is recommended).  The Mission Statement answers the “who are we” question at the level of the entire enterprise.

Mission Statement Example – Business:
“The Acme Insurance Company provides high-quality,    affordable business insurance to small business owners and farmers.”

Mission Statement Example – Government:
“The Orange County Highway Department provides safe and efficient roadways and bridges for pedestrian and vehicle traffic.”

Vision Statement
An enterprise’s Vision Statement describes in abbreviated form the competitive strategy of the enterprise. This statement should be short and memorable. The Vision Statement answers the “how are we getting there?” question at the level of the entire enterprise. The following are examples:

Vision Statement Example – Business:
“In offering unbeatable value and service, the Acme Insurance Company will be the insurance provider of choice for small business owners and farmers.”

Vision Statement Example – Government:
“State-of-the art planning, execution, and responsiveness will make Orange County’s roads and bridges the safest and most efficient in the State.”

Vision statements are more than advertising slogans, they are meant to help members of the enterprise understand the primary direction that is being pursued, and then be able to communicate that inside and outside of the enterprise.

Strategic Plan – Mapping Goals, Initiatives, Metrics
The Strategic Plan documents the primary purpose, goals, initiatives, and key outcome measures of an enterprise.

Figure 6-2: Relationship of Strategic Level Artifacts

Strategic Plan – Mapping Projects and Goals
The Strategic Plan also documents the alignment of programs and resources with the goals of the enterprise.
fig1-5

Concept Overview Diagram

ea3-strategyEA3 artifact S1: Concept Overview Diagram

A Concept Overview Diagram is a high-level model/diagram with core processes, systems and infrastructure.

Core Diagram
deltaSome organizations choose to use an MIT core diagram (Ross, Weill and Robertson, 2006). This example (to the right) is from Delta Airlines.

EA³ Artifacts

EA3 and Common Approach mapping

 Strategy
S-1 Concept Overview
S-2 Strategic Plan
S-3 Concept of Operations Scenarios
S-4 SWOT Analysis
S-5 Performance Measures Scorecard
Business
B-1 Business Process Diagram (core)
B-1.1 Business Process/Product Matrix
B-2 Business Operating Plan
B-2.1 Node Connectivity Diagram
B-3 Business Service Catalog
B-4 Organization Chart
B-5 Use Case Narrative and Diagram
B-6 Business Case / Alternatives Analysis
 Information and Data
D-1 Logical Data Model (core)
D-2 Knowledge Management Plan*
D-3 Data Quality Plan
D-1.1 Information Exchange Matrix
D-4 Data Flow Diagram
D-5 Physical Data Model
D-6 CRUD Matrix
D-7 State-Transition Diagram
D-8 Event Sequence Diagram
D-9 Data Dictionary
D-10 Object Library
 Systems and Applications
A-1 Application Interface Diagram (core)
A-2 Application Communication Diagram
A-2.1 System Data Flow Diagram
A-2.2 System/Operations Matrix
A-3 Application Interface Matrix
A-4 Application Data Exchange Matrix
A-5 Application Service Matrix
A-6 Application Performance Matrix
A-7 System/Application Evolution Diagram
A-8 Enterprise Service Bus Diagram
A-9 Application Maintenance Procedure
A-10 Application Inventory
A-11 Software License Inventory
 Infrastructure
I-1 Network Diagram (core)
I-2 Hosting Concept of Operations
I-3 Technical Standards Profile
I-4 Technology Forecast
I-5 Cable Plant Diagram
I-6 Wireless Connectivity Diagram
I-7 Rack Elevation Diagrams (front and back)
I-8 Data Center/Server Room Diagram
I-9 Wiring Closet Diagram
I-10 Point of Presence Diagram
I-11 Asset Inventory
I-12 Facility Blueprints
 Security
SP-1 Security Controls Catalog (core)
SP-2 Security and Privacy Plan
SP-3 Certification & Accreditation Documentation
SP-4 Continuous Monitoring Procedures
SP-5 Disaster Recovery Plan
SP-6 Continuity of Operations Plan