Data Quality Plan

ea3-info
EA3 artifact D-3: Data Quality Plan

The Data Quality Plan addresses the processes and internal controls implemented over spending information, including data quality control procedures.

A Data Quality Plan is mandatory in the US Federal government to support the Open Government objective of creating and sustaining transparency across Government over data related to Federal spending information and improving the quality and integrity of such information.

Knowledge Management Plan

ea3-info
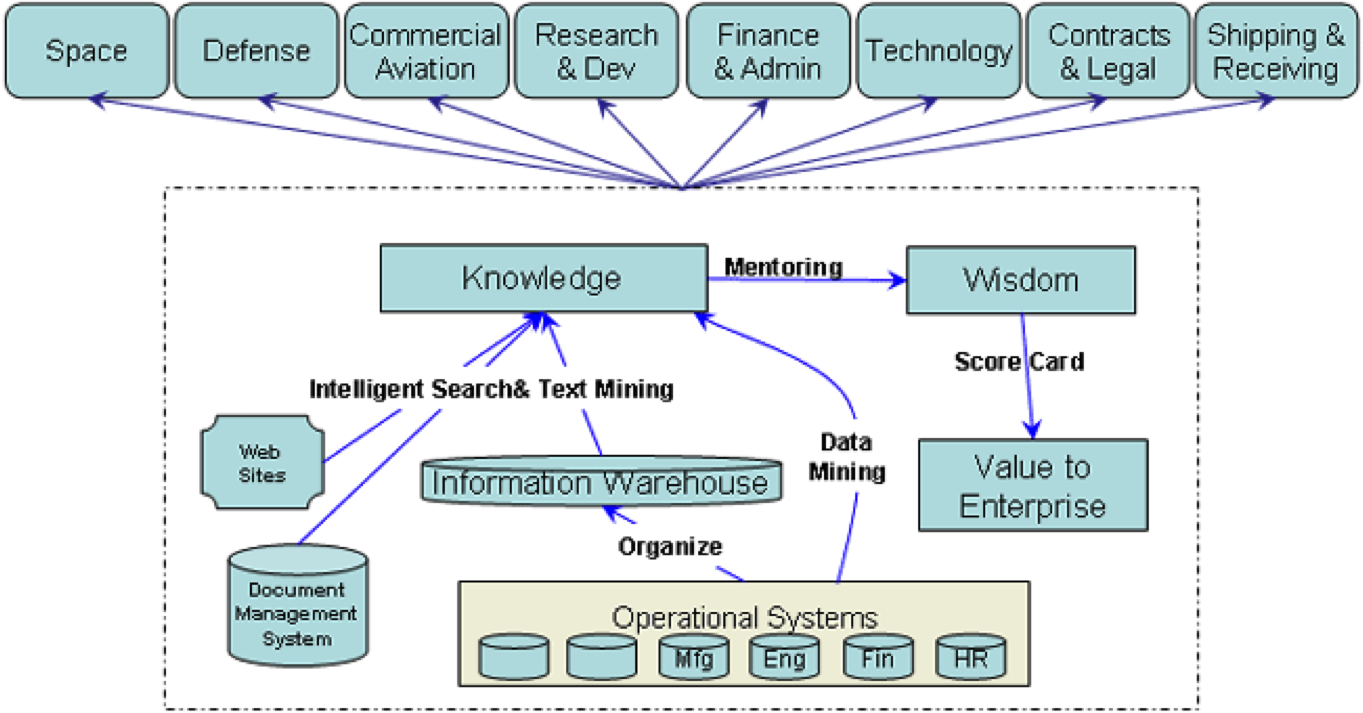
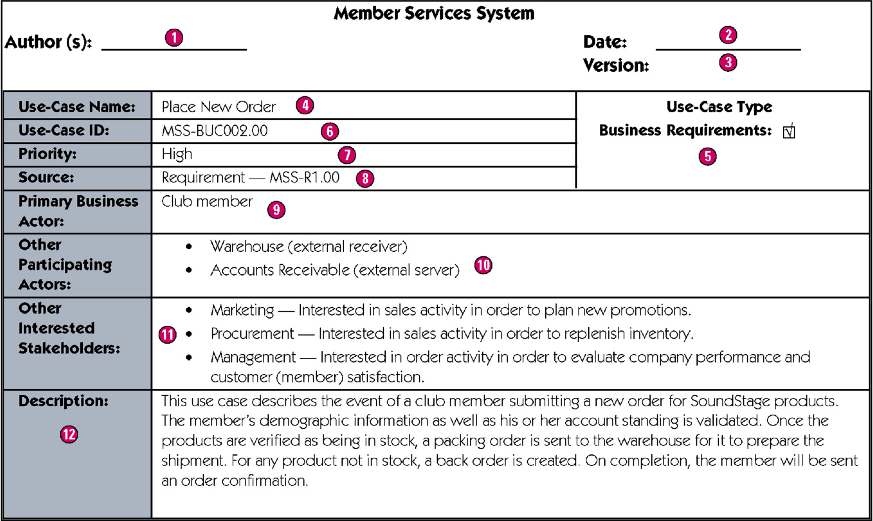
EA3 artifact D-2: The Knowledge Management Plan

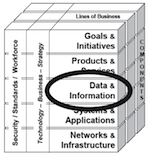
The Knowledge Management (KM) Plan provides a detailed description of how knowledge, information, and data are shared across the enterprise. The KM Plan includes descriptions and diagrams of information sharing between systems, applications, knowledge warehouses, and databases. The KM Plan includes:

  • The approach to managing data, information, knowledge across the enterprise
  • How data and information-sharing support the Business Plan
  • Data and information-sharing strategies and diagrams for each line of business
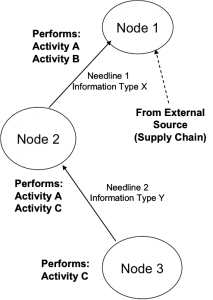
  • Data/information sharing strategies w/ external partners & customers
  • Which types of data in the enterprise require extra protection
  • The lifecycle for data and information that is key to the success of the enterprise (data creation, sharing, updating, storage, retrieval, and deletion)
  • A high-level Concept of Operations graphic to depict the KM strategy
A KM plan involves a survey of corporate goals and a close examination of the tools, both traditional and technical, that are required for addressing the needs of the company. The challenge is to select or build software that fits the context of the overall plan and encourage employees to share information.
A KM plan should focus on enabling and improving LOB workflows and processes that involve information exchanges.

The KM plan should support EA standards for business process reengineering, improvement,  and management.

This major process… Includes these activities….
Gathering
• Data entry
• OCR and scanning
• Voice input
• Pulling information from various sources
• Searching for information to include
Organizing
• Cataloging
• Indexing
• Filtering
• Linking
Refining
• Contextualizing
• Collaborating
• Compacting
• Projecting
• Mining
Disseminating
• Flow
• Sharing
• Alert
• Push

knowledgemgtplan

Logical Data Model

ea3-infoEA3 artifact D-1 Logical Data Model (core)

A semantic data model can be developed using traditional structured methods and symbology (Entity Relationship Diagram), or one can use the object-oriented method and symbology of the Unified Modeling Language (UML), which produces a Class Diagram or Object Diagram (Entity Relationship Diagram).

classdiagram

erdiagram

Business Case / Alternatives Analysis

ea3-business

An Investment Business Case uses a standard format to describe the value, risk, and return on investments made in technology and other resources. The Business Case also contains an alternatives analysis, program performance tracking metrics, architecture information, and security status information. It should include:

  • New Requirement Description
  • Existing Solution Check
  • New Solution Business Case
  • New Solution Evaluation
  • New Solution Approval
  • New Solution Implementation -> Benefit Realization

Example
1. New Requirement. A new requirement for resource(s) or support is identified in a line of business (LOB), which is brought to the EA and capital planning teams for evaluation.
2. Existing Solution Check. The EA and capital planning teams determine that an existing EA component cannot meet the requirement.
3. New Solution Business Case. The sponsoring LOB determines that the requirement is of sufficient importance to merit the cost of developing a business case:

  • Business Need. Describe the requirement in terms of the gap in operational or administrative performance it represents to the LOB and the enterprise.
  • Impact if Not Resolved. Describe the impact to the enterprise if the performance gap is not resolved, including strategic, business, and technology impact.
  • Alternatives Analysis. Identify 3 or more viable alternative solutions (if 3 exist).
  • Cost-Benefit Analysis. Quantify the direct and indirect costs and benefits for each alternative on a lifecycle basis, including qualitative items.
  • Return on Investment. Do a ROI calculation for each alternative.
  • Net Present Value Adjustment. Do a NPV adjustment for each ROI calculation to account for anticipated cost increases over the investment’s lifecycle.

4. Business Case Evaluation. The business case’s alternatives are evaluated by the Architecture Working Group (AWG) for the correctness of the analysis, and alignment with the EA at each level of the framework. The Capital Planning Working Group (CPWG) then reviews the business case for the correctness of the financial analysis. A coordinated recommendation is made to the executive-level Capital Planning Board (CPB) as to whether the business case should be approved or disapproved.
5. Business Case Approval. The CPB reviews and approves/disapproves the business case in the context of the enterprise’s overall investment portfolio using criteria that identify value from a strategic, business, and technology perspective:
6. Implementation. If the business case is “selected” (approved) for funding by the CPB, the proposed solution becomes an implementation project that is managed by the sponsoring LOB. The project is reviewed by the CPB at key milestones and/or periodically as part of the capital planning process’ oversight of all projects.

Use Case Narrative and Diagram

ea3-business

A Use Case narrative follows the Unified Modeling Language (UML) format for identifying business requirements, their context, stakeholders, and business rules for their interaction with systems, services, and applications that are identified as technology solutions requiring development.

Use_case

usecase-narrative

Organization Chart

ea3-business

The Organization Chart shows how positions and personnel are organized in hierarchical diagrams or matrix formats. Organization Charts help to show lines of authority, working relationships, as well as ownership of resources, products, and processes.

orgchart

Business Service Catalog

ea3-business

ITIL defines a business service as

a service that is delivered to business customers by business units. For example, delivery of financial services to customers of a bank, or goods to the customers of a retail store. Successful delivery of business services often depends on one or more IT services. A business service may consist almost entirely of an IT service – for example, an online banking service or an external website where product orders can be placed by business customers.

Capability Mapping uses a broader concept.


Node Connectivity Diagram

ea3-business

The Node Connectivity Diagram shows the operational nodes, activities performed at each node, node-to-node relationships, and information exchanges. The purpose of this diagram is to show, at a high level, who are the operating groups in the enterprise (lines of business) and how they share information.

nodeconnect

Business Operating Plan

ea3-business
EA3 artifact B-2 Business Operating Plan

The Business Plan provides a high-level description of the key line of business functions, and financial strategy that will accomplish the strategic goals and initiatives.

Description

The following items are often found in a Business Plan:

1. Business Overview

2. Executive Team Profile

3. Relationship of Business Activities to Strategic Goals

4. Organizational Structure

5. Market Outlook and Competitive Strategy

6. Business Cycles

7. Capitalization Summary

8. Financial Strategy

9. Current Financial Status Summary

10. Business Partnerships and Alliances

Business Process/Product Matrix

ea3-businessActivity/Product Matrix

The Business Activity & Product Matrix maps the lifecycle of revenue-producing products to various lines of business throughout the enterprise. This matrix highlights who owns business processes and products, as well as the extent of supply chains.

Example

The Activity/Product Matrix maps the lifecycle of each revenue-producing product that the enterprise produces to the line(s) of business that support one or more phases of the product lifecycle. This matrix allows the enterprise to see where the vertical and horizontal (cross-cutting) business product activities are located, as well as to help define ownership of those processes. The B-5 Activity/Product Matrix can then be used with various Data & Information level artifacts (e.g. D-7 Activity/Entity Matrix) to further map the product lifecycle to requirements for data across the enterprise.

businessact-product

The product lifecycle illustrated in this example has five sequential stages (research and development, manufacturing, warehouse storage, sales/distribution, and servicing) and two parallel administrative functions (financials and legal). Product lifecycles are different within most enterprises, and adjustments to the B-5 matrix should be made accordingly.