Report definition is used to generate reports for e.g. a diagram type, and make them available on the web.
There is a set of standard reports included in the standard configuration, click here to see more about the standard reports.
Reports are designed via the template ReportDefinition.
Reports are always generated dynamically based on the content where they are executed. For example, if you click on the report button on a diagram, it will use the objects and their information contained on the diagram. To make this possible it is necessary to define what variables the ReportDefinition should gather and where it should place them in the report.
Designing a report consists of four stages: Designing the queries, arranging the attributes in the main report, designing sub-reports and finally applying advanced formatting.
- In the design phase it is necessary to structure the data for the report. This is done via SQL. To remove the need of learning SQL QualiWare has introduced a Query Designer that helps users build SQL scripts and tables automatically based on a graphical diagram.
- The queries are then used as input for the ReportDefinition where the individual attributes can be re-arranged graphically.
- When designing a Query that needs to read the attributes of objects that are referenced in a multi-link field it is necessary to create sub-queries and sub-reports. Sub-reports gather and organize the attributes for the underlying objects and then are themselves inserted into the main report, just like the other attributes.
- When the data has been defined, organized and arranged in the report it is necessary to apply advanced formatting to the report for aesthetic reasons.
See this detailed guide for more.
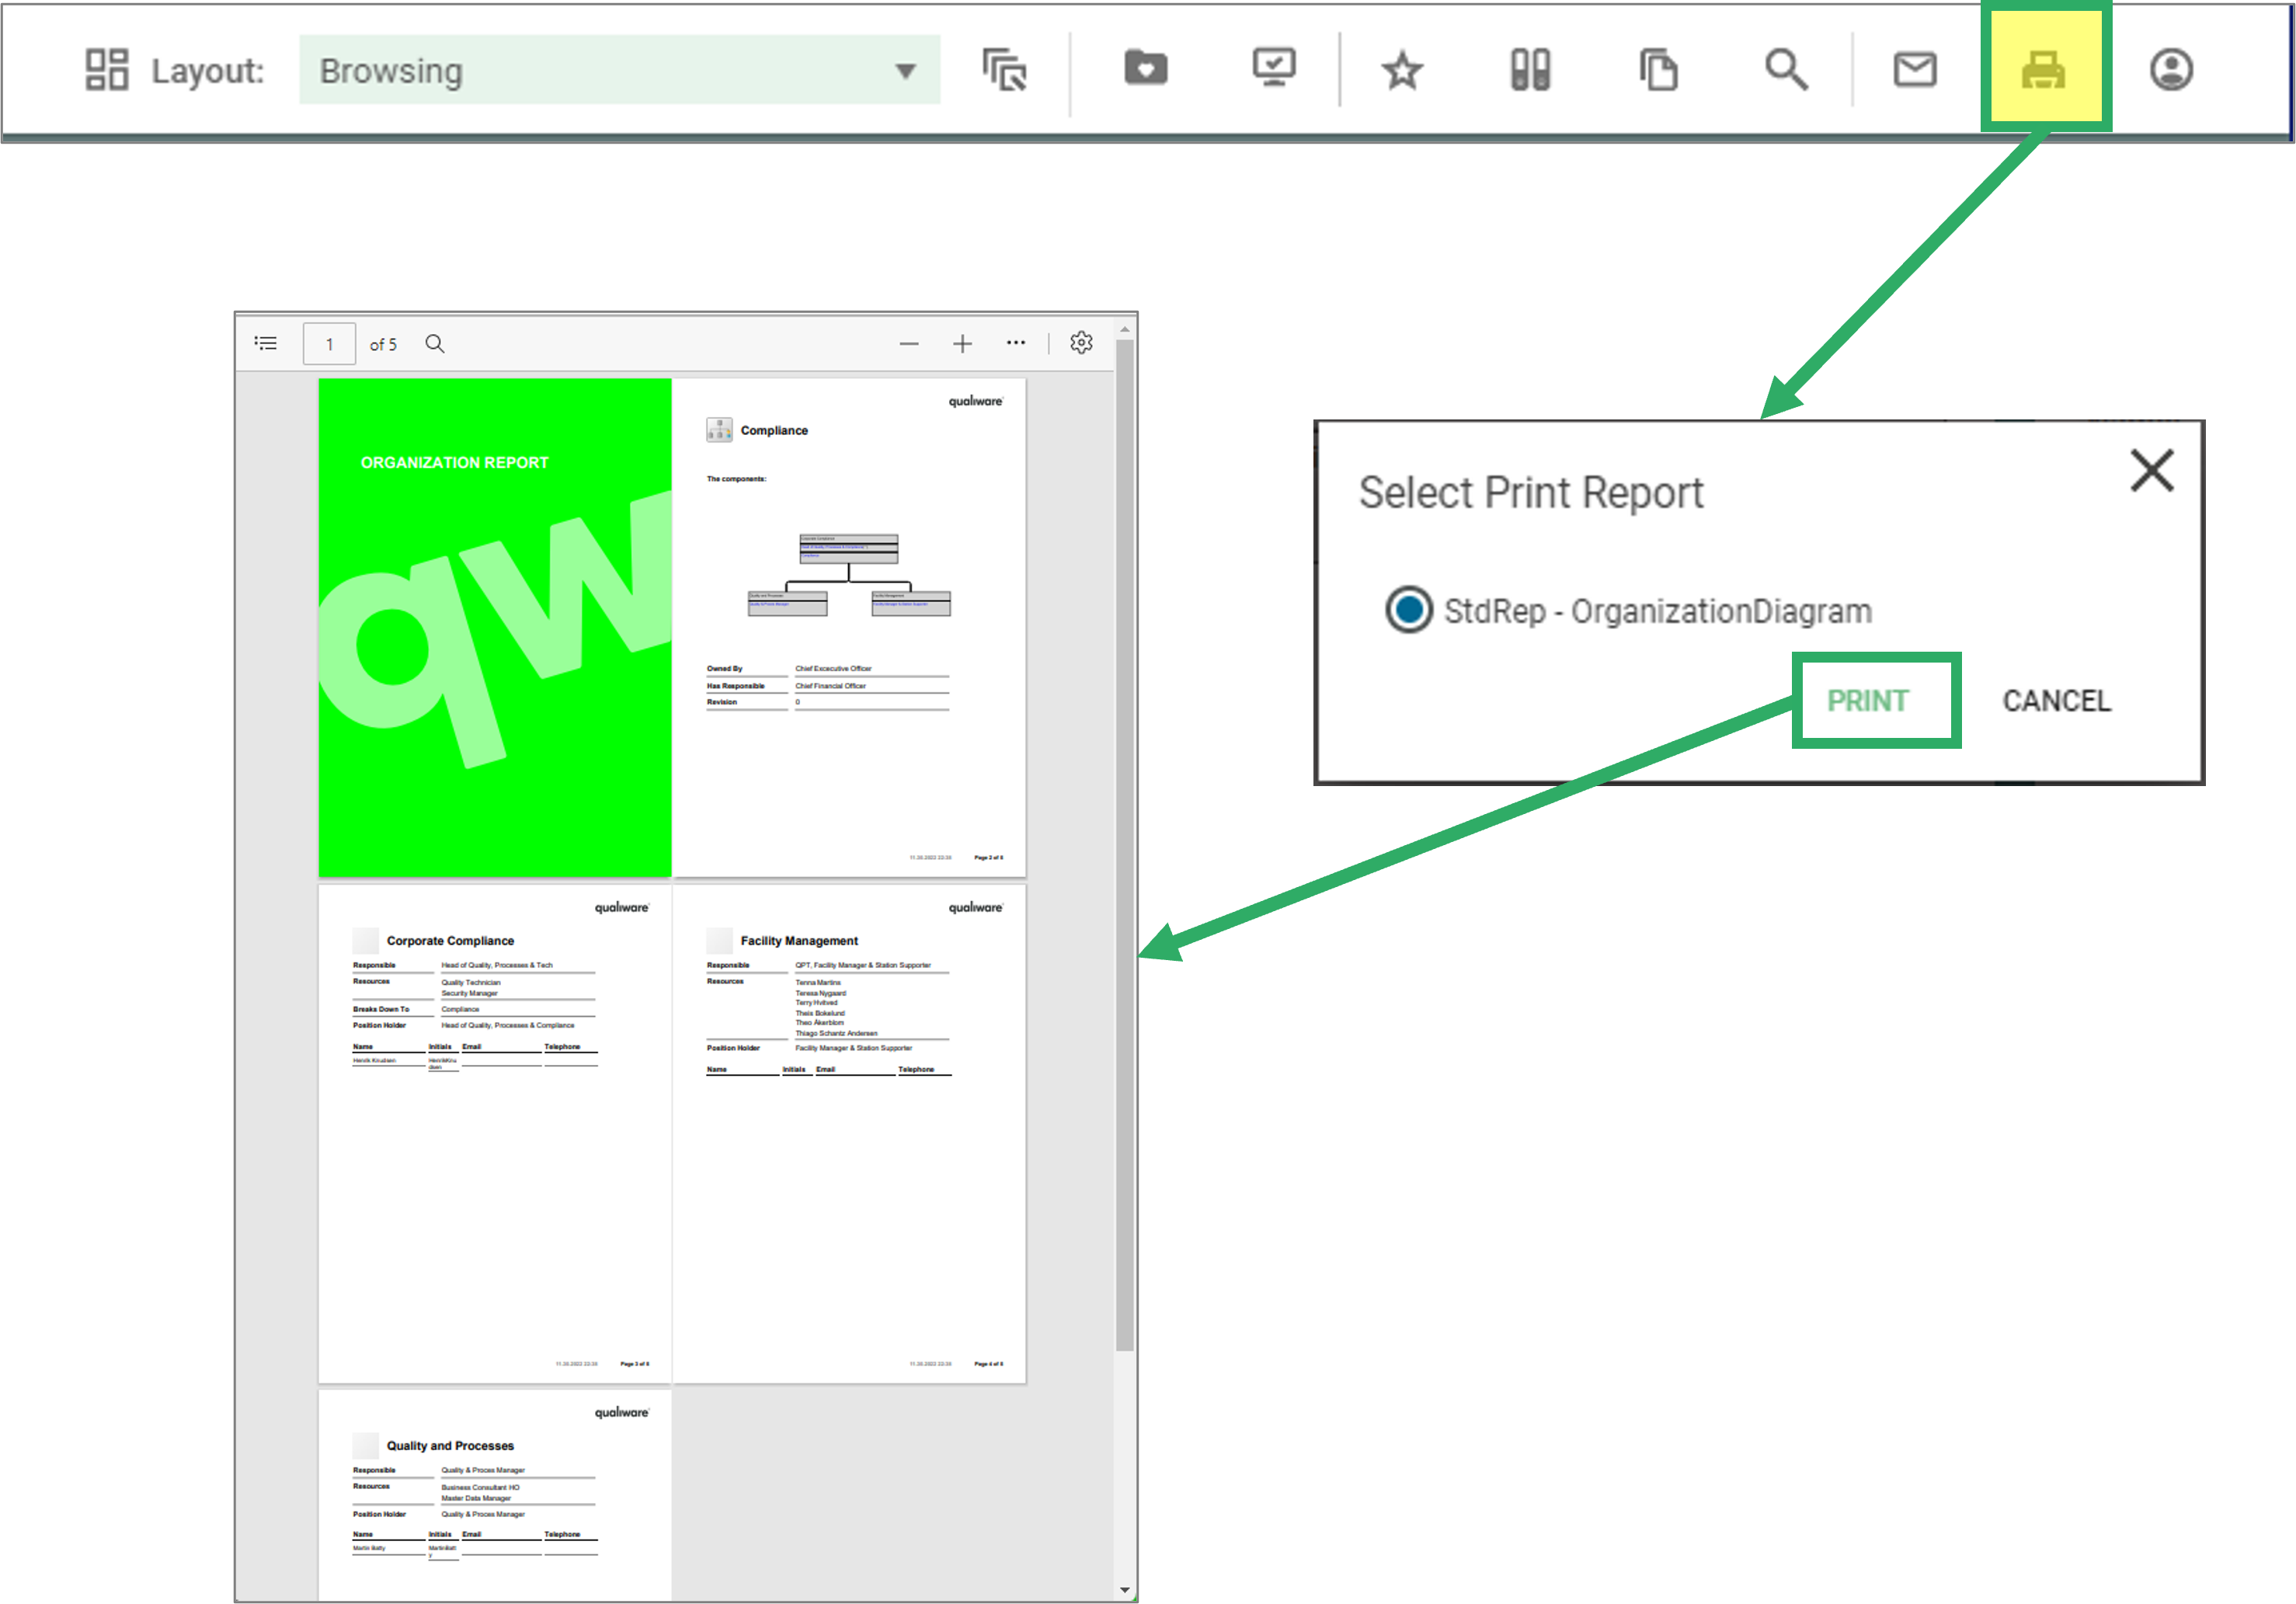
Once created the report can be added to the relevant template in the Template Definition, to make them available on the web, via the “Print icon” in the Toolbar.