Summary
QualiWares Social Behavior Warehouse combines social analytics with Enterprise Architecture and Business Process Management. Social Behavior Warehouse captures the behavior of the organization by registering all activities performed on knowledge stored in the enterprise repository.
With Social Behavior Warehouse an organization can assess business outcomes and provide diagnostic information. Using this technology, businesses can make sure that their organization is using the EA to create a competitive advantage. Social Behavior Warehouse is an essential tool in management’s decision-making process.
Enabling positive change requires a strong focus on Collaboration in decision making and a high degree of de-centralized maintenance and sharing of corporate knowledge. Successful implementation of corporate strategy and the required business transformations is essential for businesses operating in a global dynamic market; the ability to react rapidly to such market dynamics may mean life or death to the business. With Social Behavior Warehouse top management can uncover threats to business agility and identify actions needed to correct the weak spots in the organization.
The Social Behavior Warehouse will provide management with answers to questions such as:
- What parts of the Management System / EA knowledge are used by the organization?
- Are EA deliverables made operational, actionable, and measurable?
- How active are different parts of the organization?
- How often do employees use core process models to guide them in day-to-day operations?
- What is our organization’s agility?
- How much time is needed from approval of the business model until it has penetrated the business?
- And many more.
Social Behavior Warehouse integrates with the Governance Workflow Engine and other QualiWare modules where content is viewed or changed. It scales to form a complete intelligent collaboration platform for large enterprises operating in a global environment.
Standard SBW Radar Tiles
On the QualiWare standard there are 4 tiles on the My Desktop available, addressing repository content and SBW data about how it is used on a company, team and personal level.

The axes on the radar diagrams (Strategy, Process, Application, Information, Organization and Technology) represents the dimension in the QualiWare EA Framework, and the associated object templates (typical diagrams).
QualiWare EA Framework

Each of the FrameWorkCells in the EA Framework is related to a set of model(s) and other templates, and the radar diagram reflects:
- Repository Content
- This diagram counts the number of objects of each template in the whole repository mapped to each of the columns in the QualiWare EA Framework
- Company use of content Radar
- This diagram counts the number of clicks all users have on each of the objects of the mapped template types in each Column in the EA Framework.
- My teams use of content
- This radar diagram counts the number of hits for the user and the users in the same organisational unit in QualiWare.
- My use of content
- The last radar diagram counts the current user’s clicks in the repository
Top 20 list over most viewed objects and templates
In addition to the Radar diagrams, there are 2 tiles on the standard My Desktop, showing the most viewed objects and template types in the repository the last 30 days.

Social Behavior data on diagrams and models
In addition to the more generic radar-diagrams addressing the whole repository, you can also access analytics data related to a specific diagram.
When viewing a diagram on the web in the classic diagram workspace, an analytics action button becomes available in the top right in the action buttons.
When viewing a diagram in a Dashboard view the analytics data are available from the dedicated tiles on the dashboard.

Once the analytics is selected a set of tabs becomes available.
Depending on the diagram type a set of analytics tabs becomes available. In the following each of the tabs are described shortly.
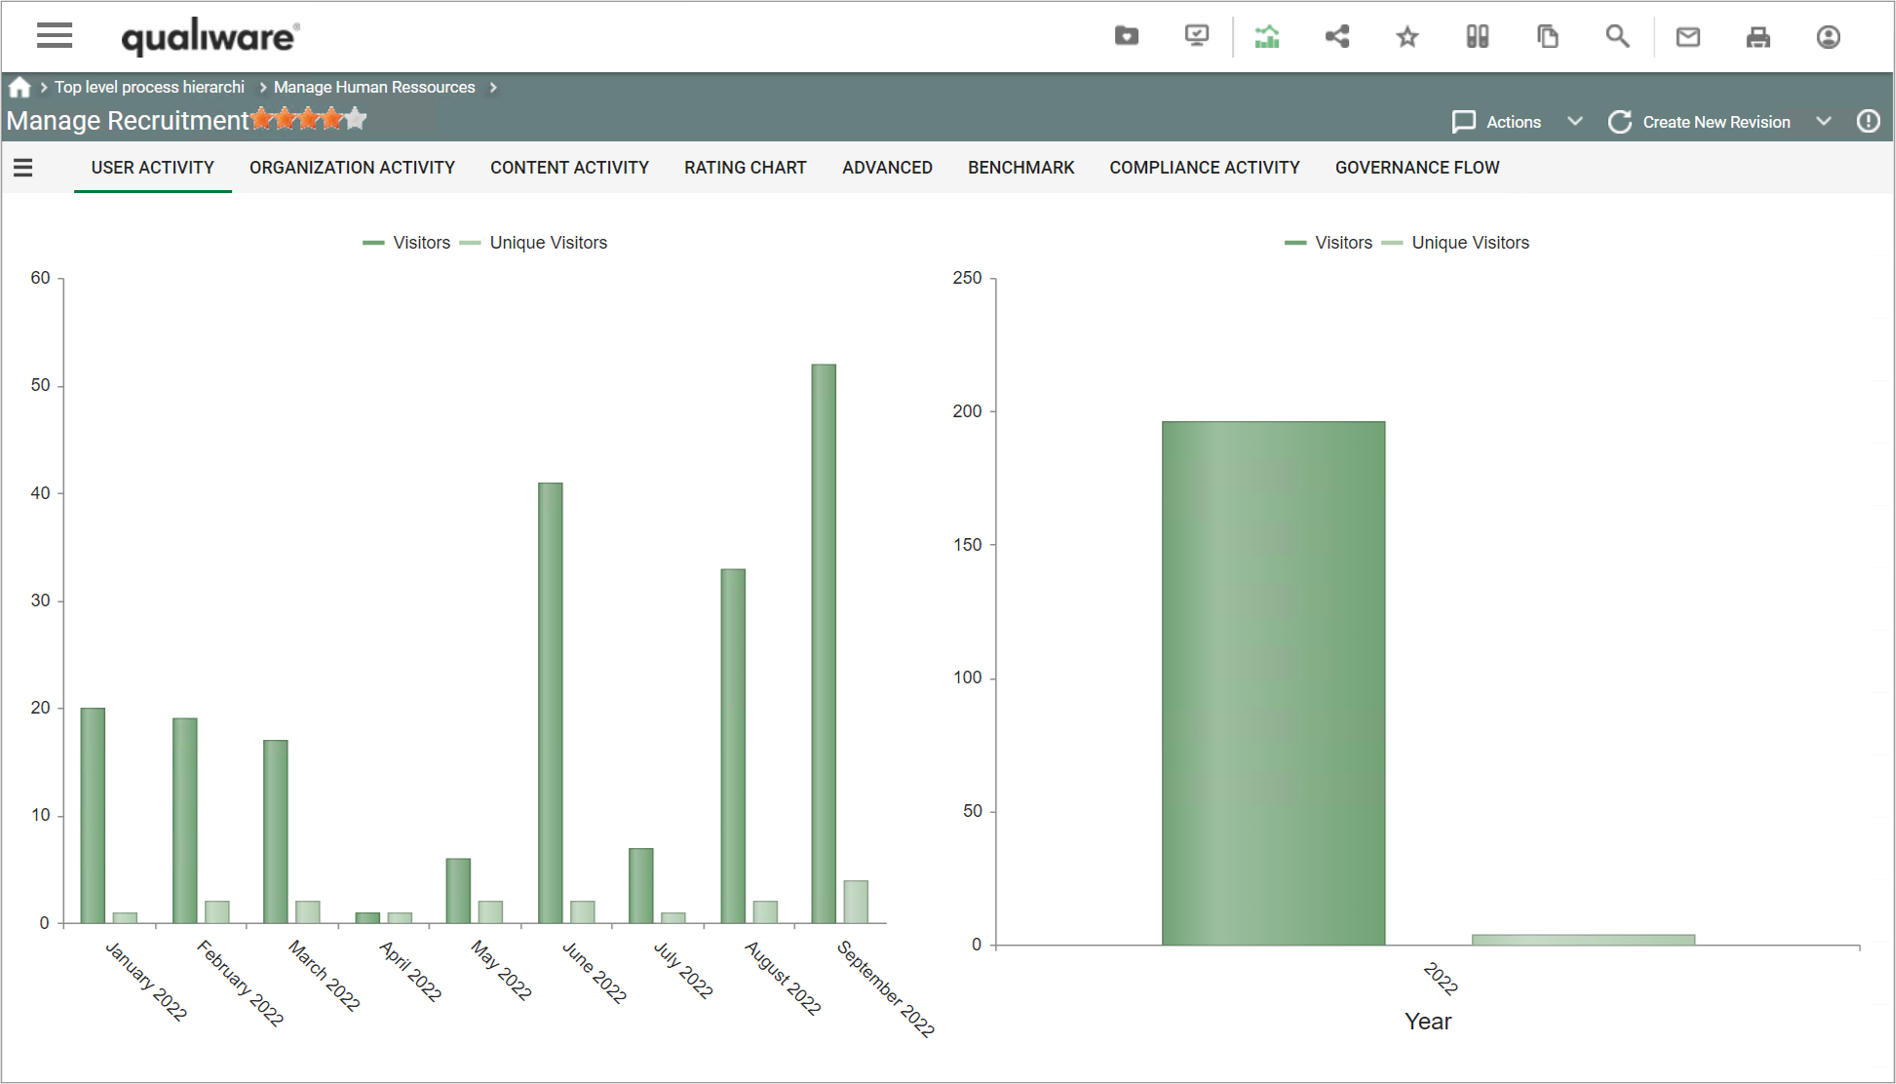
User Activity
This tab shows number and page visits (visitors) and unique visitors pr month and pr year.


Organization Activity
This tab shows number and page visits (visitors) and unique visitors pr month for each organization unit.
This activity view is based upon the users (persons) asscociation the organization units in the repository.


Content Activity
This tab shows the total number off hits (clicks) for each object on the diagram.


Rating Chart
This tab shows the number of ratings and the average rating for each revision of the diagram.

Advanced
This tab show a (subset) of the diagrams in the repository and the organization activity for the selected diagrams. In the left frame you can select the content using the pivot like format.

Benchmark
This tab benchmark the object properties with the average values of the other objects in the repository.


Compliance Activity
This tab shows diagrams for the compliance activity related to the diagram. The 3 charts to the left show the number of new registrations and closure of change requests, corrective actions and non conformances related to the diagram. The 3 charts to the right depict the number of open items for the 3 types.


Governance Flow
This tab shows a Gantt chart and dates for the governance states for the diagram.

For Administrators
SBW Configuration
Below is the main administrator steps for setting up SBW shown.
The Social Behavior Warehouse (SBW) has to be set up in the QEF Admin console for it to work.
In QEF Console, there is a tab called Access Log, which allows for the creation and maintenance of the Access Log database.
This database contains the raw data for system access across all repositories. This data is eventually processed by SBW, on a per-repository basis.
As this single database is used by all repositories, it is important that it is stand-alone, and that the access logs are not a schema within another existing database.

For each repository that requires SBW, you must enter Repository Administrator and navigate to the Addons tab.
The first tab within Addons is “Access Log”, click on Edit and check the “is enabled” checkbox.
This will tell QEF to start logging access data for this repository.

The next step is to navigate to the “Social Behavior Warehouse” tab and clicking on Edit.
From there, you can create the SBW Data Storage.
NOTE: The “SBW Cube Data Storage” tab and “Cube Sync” tab are deprecated. These tabs do not need to be set up and can safely be ignored for QualiWare 10.5 or newer.

After the creation of the SBW Data Storage, two sync tasks must be setup:
- Access Log Sync, which reads from the QEF Access Logs into the specific repository’s access log including all clicks
- Repository Sync, which transforms the raw Access Logs data into the SBW data including all objects

After the creation of the SBW Data Storage, configuration of Access Log and Repository Sync, the SBW Addon screen should look like this.

SBW tabs on models
The Analytics tabs are configured in each HTMLTemplateDefinition, for example, see the out-of-the-box configuration of the BusinessProcessNetwork template definition.

For details see the QualiWare – Guide for SBW