Business Chart

Purpose: The purpose of the Business Chart template is to create different graphs and charts using information from other diagrams and templates. The Business charts can then either be published on a Dashboard and/or stored.

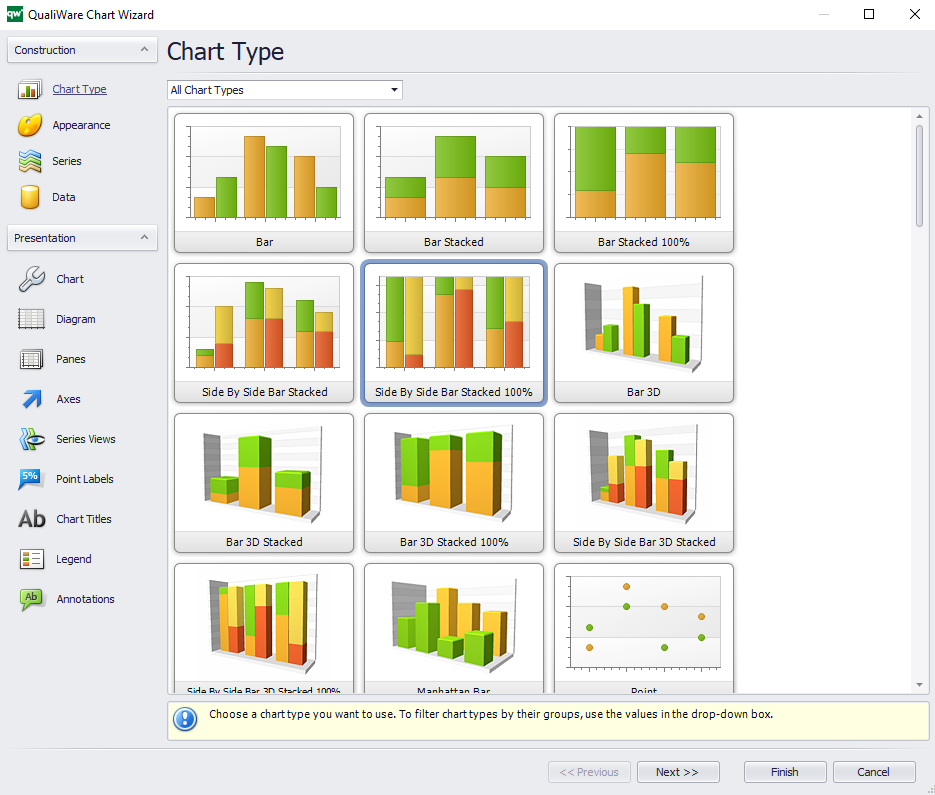
Core concerns: The Business Chart template is concerned with analyzing other templates and models. Therefore, it is not modelled like a typical template, but created using the Chart Wizard found in the template’s property window:

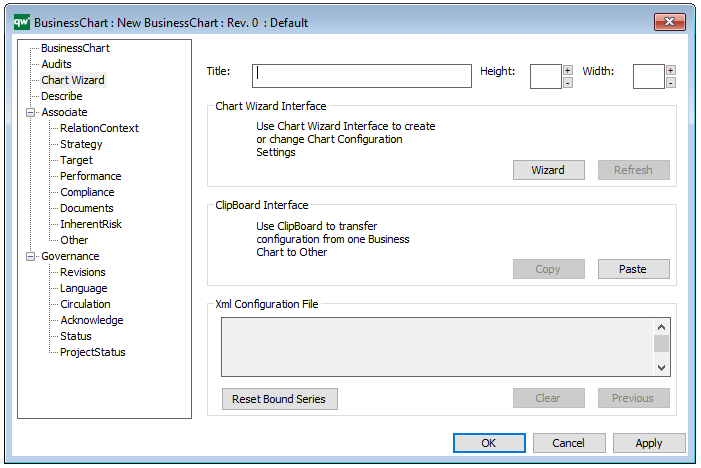
Below, you can see the Chart Wizard that helps you create your Business Chart:

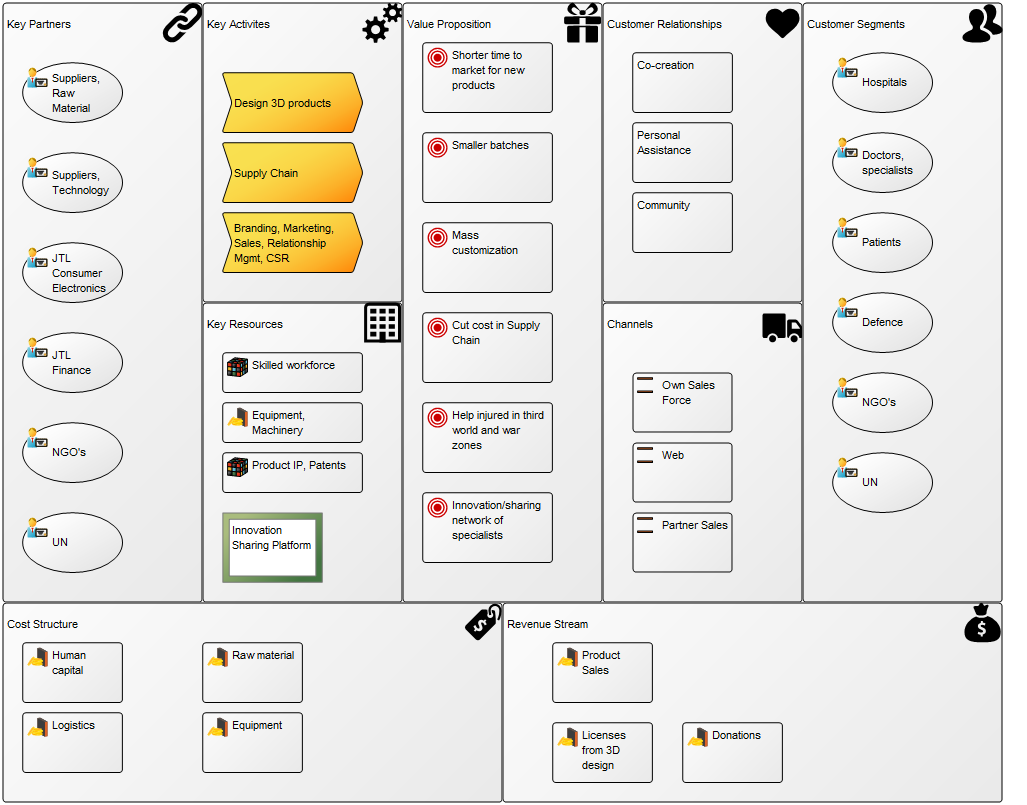
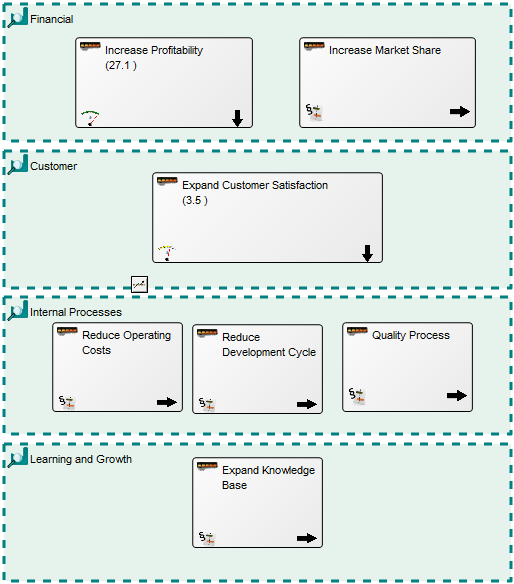
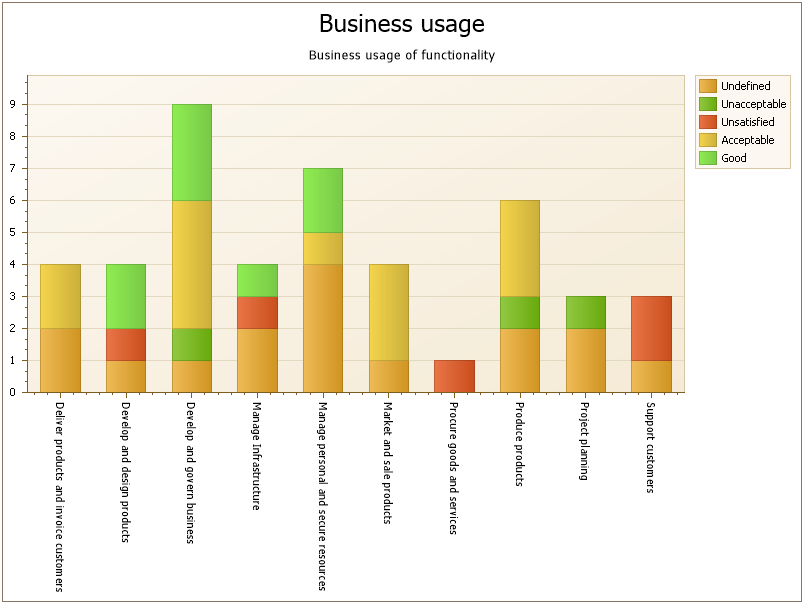
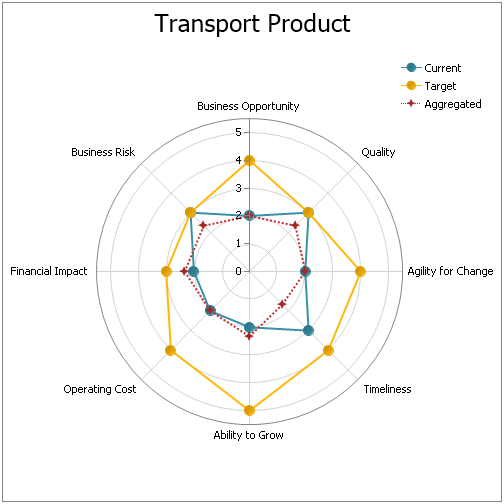
The Business Chart template can for example be used to generate a chart over how the capabilities or Key Performance Indicators of an enterprise are performing over time or compared to desired values. Additionally, Business Charts can be used to analyze static data entered in a Matrix model. You choose the input to your Business Chart as a ‘Data Source’ in the templates metadata (see figure under Metadata).

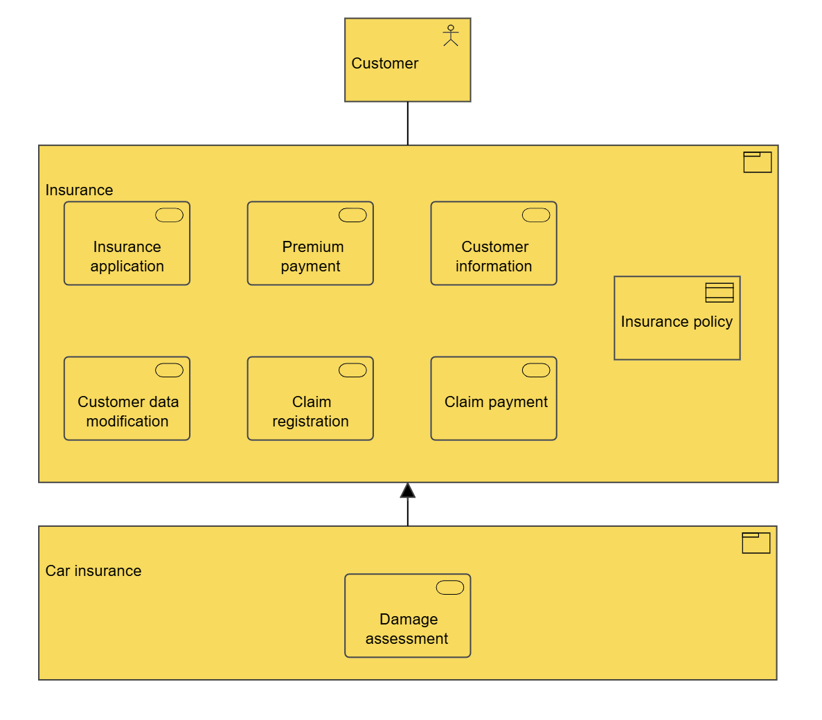
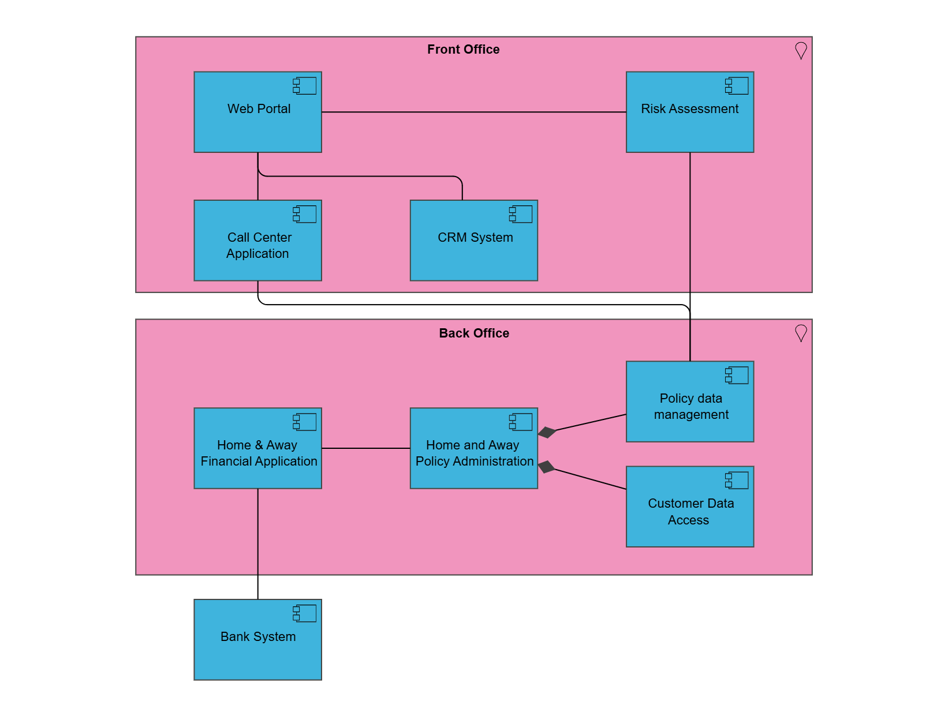
Below, you can see two very different examples of business charts:

BusinessChart_2


BusinessChart_1

Relation to other templates: The Business Charts are published using the Dashboard template.

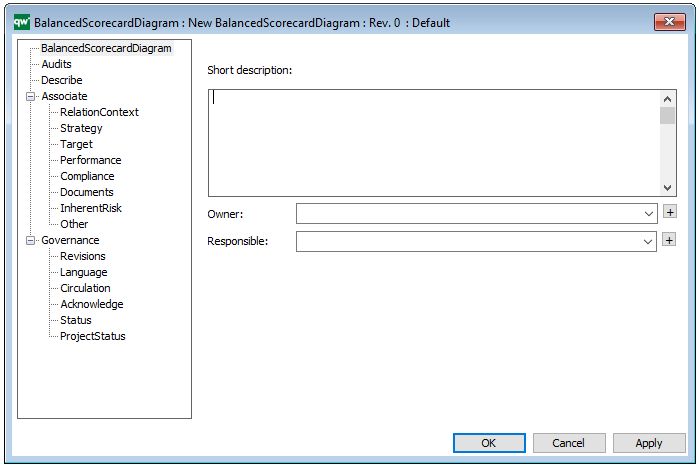
 Properties and metadata: The Business Chart template can for example retain the following information:

  • A description of the diagram
  • Link to the owner of the business chart
  • Link to the one responsible for the business chart
  • Link to data source
  • Audits (auto generated information regarding its current state and access rights)
  • Associated documents, diagrams and other objects
  • Inherent Risk detailing risk considerations
  • Governance information detailing information about the published diagram and who has been involved in the approval of the diagram

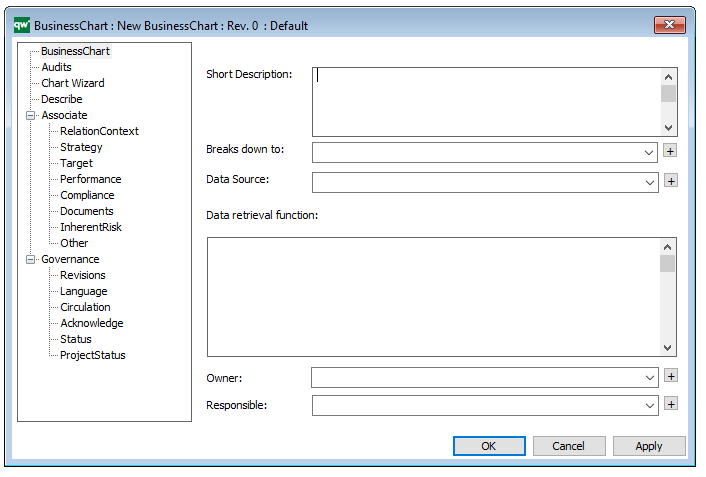
The above picture shows the properties dialogue window for the Business Chart Template where you can view and edit the diagram’s properties in QualiWare Lifecycle Manager.

Business Canvas

Purpose: The Business Canvas, is a strategic management and entrepreneurial template. It allows you to describe, design, challenge, invent, and pivot your business model.

Core Concerns: The core elements of the business canvas are framework cells that define a strategic or organizational entities and, if needed, connections between them. The Business Model can be structured any way you wish. The most well know structure of a business model is Alexander Osterwalder’s Business Model Canvas.

BusinessCanvas_1

The above picture shows a blank Business Model Canvas where each area is represented by a framework cell.

The strategic or organizational entities can then be enriched with an extended portfolio of strategic symbols such as vision, mission, goals, stakeholders, information systems and business processes.

Full content list of the extended portfolio:

  • Vision
  • Mission
  • Business Object
  • Market
  • Competitive Advantage
  • Technology
  • Competence
  • Capability
  • Performance Indicator
  • Business Function
  • Business Process
  • Organization Unit
  • Stakeholder
  • Information System
  • External Entity
  • Location
  • Channel
  • Goal
  • Opportunity
  • Threat
  • Trend
  • Material Asset
  • Intellectual Capital Asset
  • Business Rule
  • Key Performance Indicator


The picture below shows a Business Model Canvas that is filled out with symbols from the extended portfolio.

BusinessCanvas_2

Relation to other templates: The Business Canvas can link to multiple related templates detailing the businesses capabilities, business processes, strategy and more.

Properties and metadata: The Business Canvas Diagram can for example retain the following information:

  • A description of the diagram
  • Link to the owner of the application architecture
  • Link to the one responsible for the application architecture
  • Audits (auto generated information regarding its current state and access rights)
  • Associated documents, diagrams and other objects
  • Inherent Risk detailing risk considerations
  • Governance information detailing information about the published diagram and who has been involved in the approval of the diagram


Balanced Scorecard Diagram

Purpose: The purpose of the Balanced Scorecard Diagram is to model Balanced Scorecards, as described by Robert Kaplan and David Norton in 1992.

Core concern: Usually, a Balanced Scorecard Diagram template measures the state of the enterprise via Key Performance Indicators that are categorized into four different perspectives using Business Scopes. Aside from this, the template enables you to model general concepts and cause/effect.

Below, you can see an example of a Balanced Scorecard Diagram:

BalancedScoracardDiagram_1

Relation to other templates: The Balanced Scorecard Diagram can be used to create a Performance Evaluation Model or a Strategic Management Diagram the Key Performance Indicators it contains can be broken down into Performance Diagrams offering a detailed view of how the organization performs. If CXO dashboards are to be created, the Strategy Model should be used instead.

Properties and metadata: The Balanced Scorecard Diagram can for example retain the following information:

  • A description of the diagram
  • Link to the owner of the diagram
  • Link to the one responsible for the diagram
  • Audits (auto generated information regarding its current state and access rights)
  • Associated documents, diagrams and other objects
  • Inherent Risk detailing risk considerations
  • Governance information detailing information about the published diagram and who has been involved in the approval of the diagram.

The above picture shows the properties dialogue window for the Balanced Scorecard Diagram, where you can view and edit the diagram’s properties in QualiWare Lifecycle Manager.

Organization Viewpoint : Archimate

Concerns: Identification of competencies, authority, and responsibilities
Purpose: Designing, deciding, informing
Scope: Single layer/Single aspect

The organization viewpoint focuses on the (internal) organization of a company, department, network of companies, or of another organizational entity. It is possible to present models in this viewpoint as nested block diagrams, but also in a more traditional way, such as organizational charts. The organization viewpoint is very useful in identifying competencies, authority, and responsibilities in an organization.


Product Viewpoint : Archimate

Concerns: Product development, value offered by the products of the enterprise
Purpose: Designing, deciding
Scope: Multiple layer/Multiple aspect

The product viewpoint depicts the value that these products offer to the customers or other external parties involved and shows the composition of one or more products in terms of the constituting (business, application, or technology) services, and the associated contract(s) or other agreements. It may also be used to show the interfaces (channels) through which this product is offered, and the events associated with the product. A product viewpoint is typically used in product development to design a product by composing existing services or by identifying which new services have to be created for this product, given the value a customer expects from it. It may then serve as input for business process architects and others that need to design the processes and ICT realizing these products.


Application Cooperation Viewpoint : Archimate

Concerns: Relationships and dependencies between applications, orchestration/choreography of services, consistency and completeness, reduction of complexity
Purpose: Designing
Scope: Multiple layer/Multiple aspect

The application cooperation viewpoint describes the relationships between applications components in terms of the information flows between them, or in terms of the services they offer and use. This viewpoint is typically used to create an overview of the application landscape of an organization. This viewpoint is also used to express the (internal) cooperation or orchestration of services that together support the execution of a business process.

Abstraction Level
Coherence, details

Layer
Application layer

Aspects
Behavior, active structure, passive structure

ApplicationCoopViewpoint