Performance Diagram

Purpose: The purpose of the Performance Diagram is to provide a view over an organization’s performance in reaching their strategic goals.

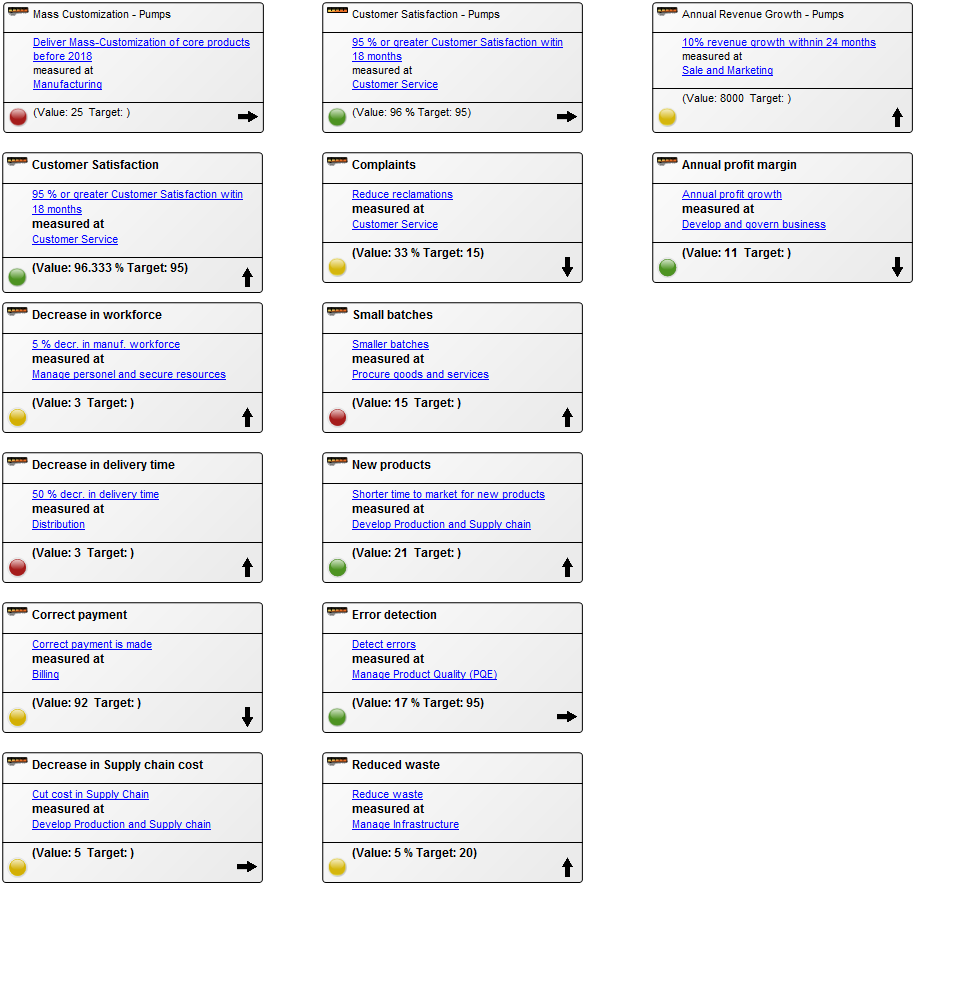
Core concerns: The Performance Diagram enables you to model Key Performance Indicators – which can be related to strategic goals, derivative Performance Indicators and Derivation Rules. You can create a Performance Diagram as a decomposition of a Key Performance Indicator and model a hierarchy of performance diagrams. The model below shows an overview of an organizations Key Performance Indicators and their status:
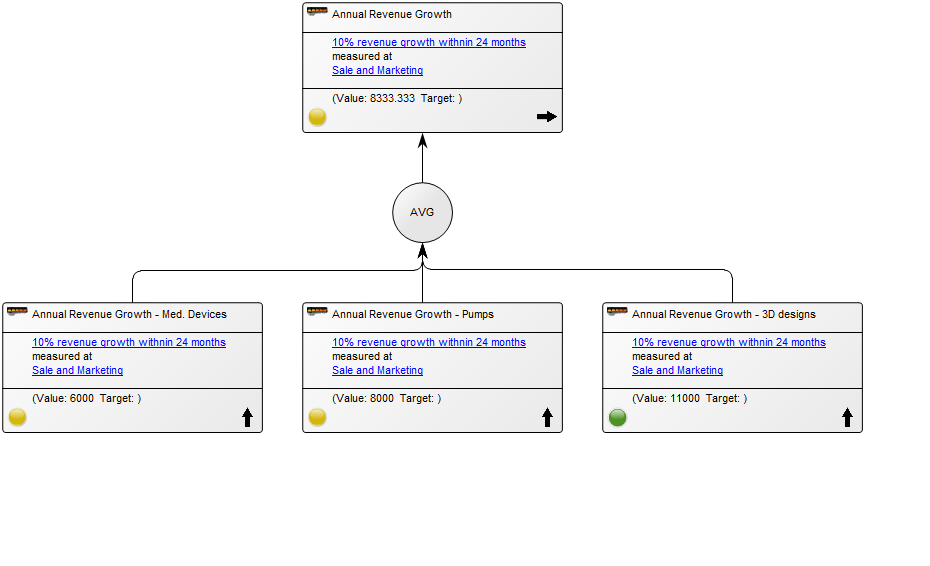
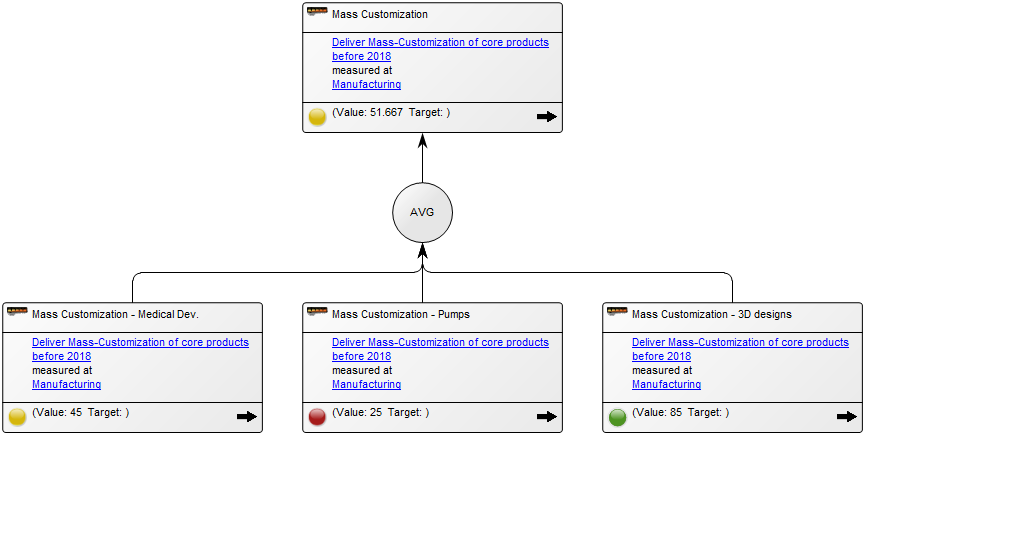
In the following model the Key Performance Indicator has been enriched with derivative performance indicators explaining in more details the status of the performance and how it is measured:
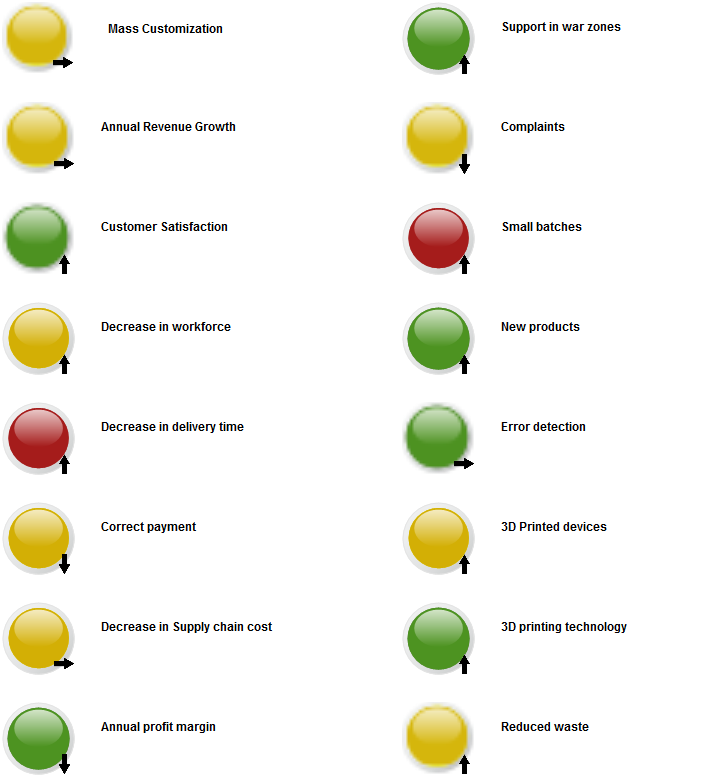
The overview of the Key Performance Indicators can also be presented with a simplistic view, highlighting their status using color coded icons:
Relation to other templates: The Performance Diagram is a Strategic template and can be decomposed from Key Performance indicators contained in, for example, a Balanced Scorecard Diagram or Dashboard.


Properties and metadata: The Performance Diagram can for example retain the following information:

  • A description of the diagram
  • Link to the owner of the diagram
  • Link to the one responsible for the diagram
  • Audits (auto generated information regarding its current state and access rights)
  • Associated documents, diagrams and other objects
  • Inherent Risk detailing risk considerations
  • Governance information detailing information about the published diagram and who has been involved in the approval of the diagram
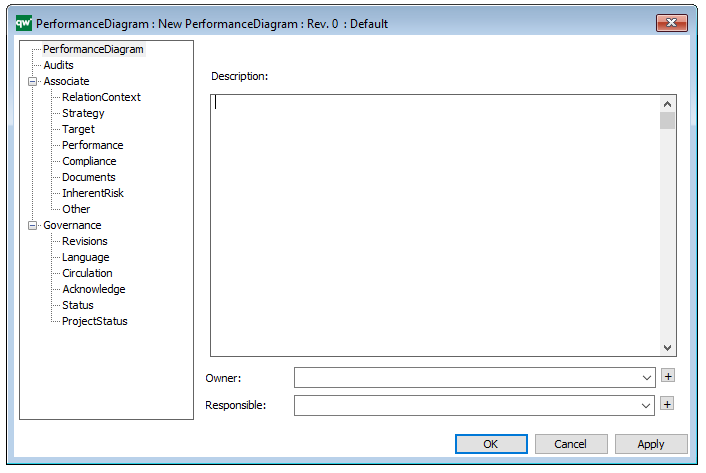
The above picture shows the properties dialogue window for the Performance Diagram where you can view and edit the diagram’s properties in QualiWare Lifecycle Manager.
Business Operating Model

Purpose: The purpose of the Business Operating Model is to visualize how an organization functions and delivers value to its customers. The model presents a ‘one-page-overview’ of the organization and offers a quick way to communicate an organization’s value structure to different types of stakeholders.

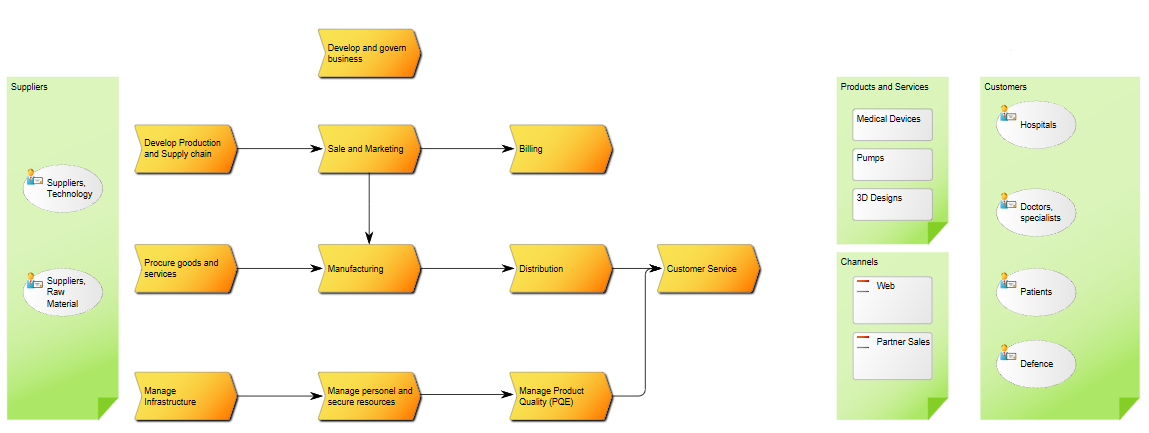
Core concerns: The Business Operating Model can be put together in numerous ways including information on Stakeholders, Business Processes, Products, Projects, Channels, Key Performance Indicators and more. This enables you to create a Business Operating Model that reflects your organization’s specific value chain in detail. Below is an example of a Business Operating Model that shows a business’s suppliers, high-level processes, products & services, channels and customer segments:

Relation to other templates: The Business Operating Model is a strategic model that can be supplied with more detailed models such as a Business Capability Model, Requirement Models, Stakeholder Models and the Business Ecosystem Model.

Properties and metadata: The Business Operating Model can for example retain the following information:

  • A description of the diagram
  • Link to the owner of the diagram
  • Link to the one responsible for the accuracy of the diagram
  • Audits (auto generated information regarding its current state and access rights)
  • Associated documents, diagrams and other objects
  • Inherent Risk detailing risk considerations
  • Governance information detailing information about the published diagram and who has been involved in the approval of the diagram
  • Project status: information about budgeted and actual man-hours spent, percentage completed and the latest milestone, result and quality control of a change process.

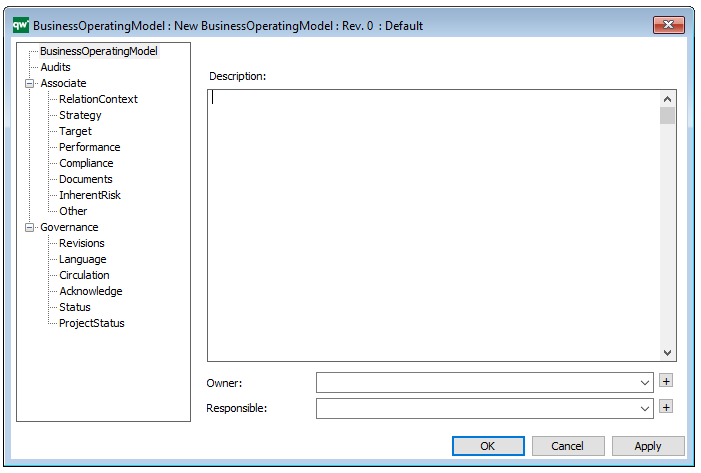
In the picture below you can see the Business Operating Model’s properties dialogue window, where the information can be viewed and edited:

Work Model

Purpose: The purpose of the Work Model template is to document development methods or project models.

Core concerns: The Work Model template enables you to model Project Activities, Milestones, Results, Quality Controls, Document Structures and Business Scopes. These objects are joined by Connections indicating a flow.

The Work Model template can, for example, be used by Enterprise Architects to document the Enterprise Architecture process from start to finish while covering all the project activities, milestones, and results. The Work Model helps ensure a standardized approach.

Below, you can see a few examples of Work Models utilizing a variety of the available objects:


The above model shows a simple project flow enriched with mile stones, results and a quality control.

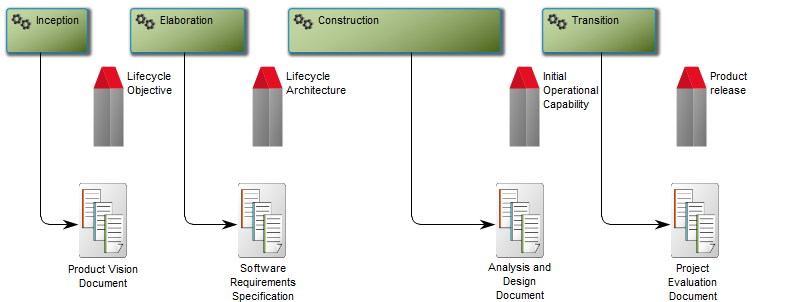
The above model illustrates another generic model for a software development project – this example has more milestones inserted as well as added document structures containing project deliverable templates.

Relation to other templates: The Work Model template should be used to document project activities – to document business processes and workflows should be documented in Business Process Networks, Workflow Diagrams or Business Process Diagrams.

For a more detailed view of the structure of a project’s results and resources, a Work Breakdown Structure template should be used.


Properties and metadata: The Work Model can for example retain the following information:

  • A description of the diagram
  • Link to the owner of the model
  • Link to the one responsible for the model
  • Audits (auto generated information regarding its current state and access rights)
  • Associated documents, diagrams and other objects
  • Inherent Risk detailing risk considerations
  • Governance information detailing information about the published diagram and who has been involved in the approval of the diagram

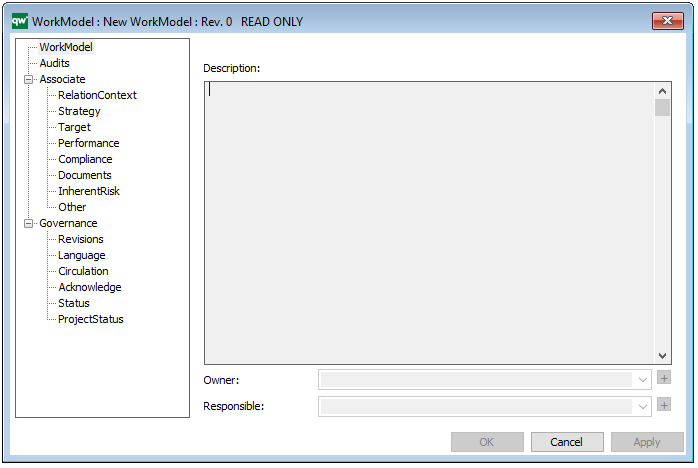
The above picture shows the properties dialogue window for the Work Model, where you can view and edit the diagram’s properties in QualiWare Lifecycle Manager.


Regulation Diagram

Purpose: The purpose of the Regulation Diagram template is to document those regulations the enterprise is subject to in detail, so it can be identified how the enterprise must adhere to them. Regulation diagrams is often used to document compliance by use of compliance matrices.

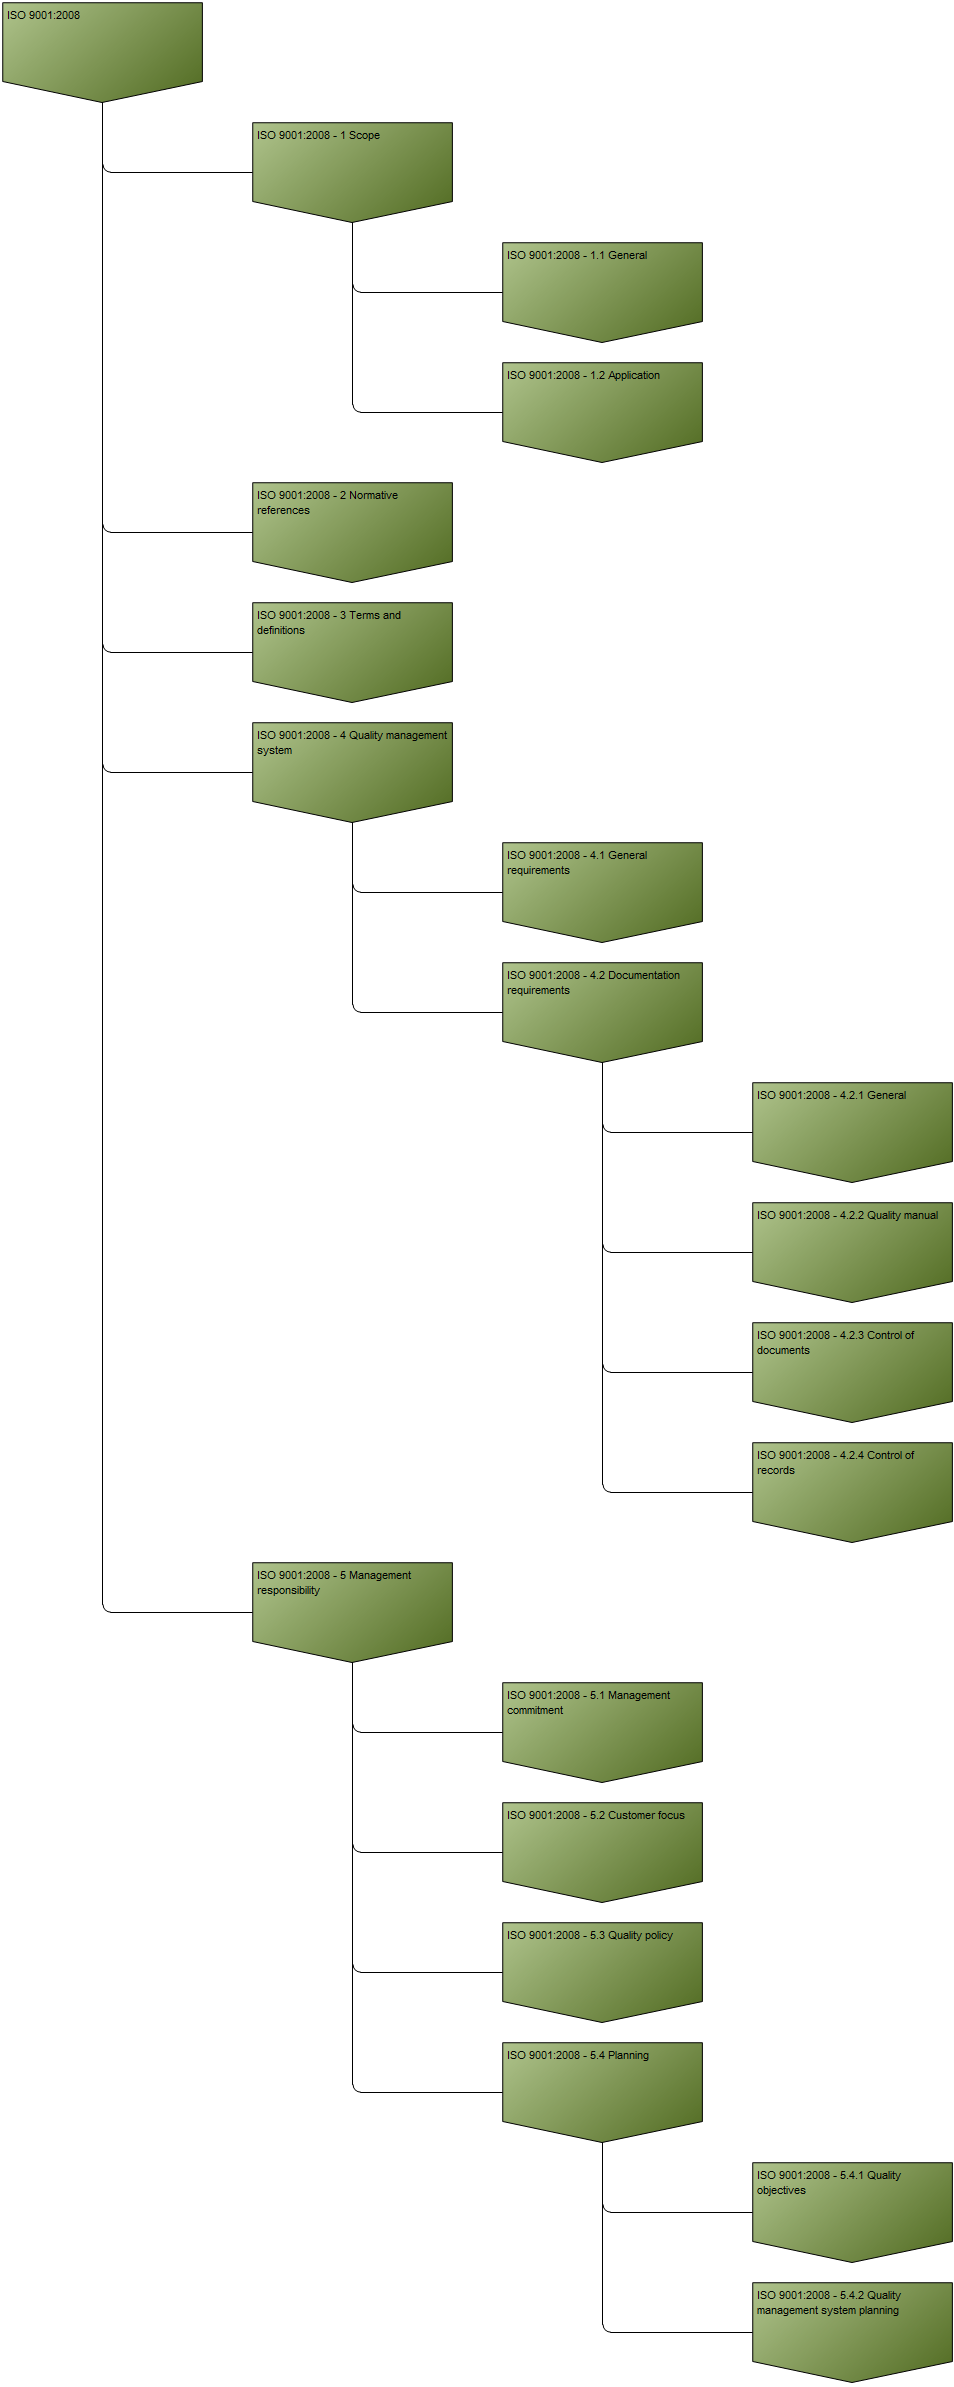
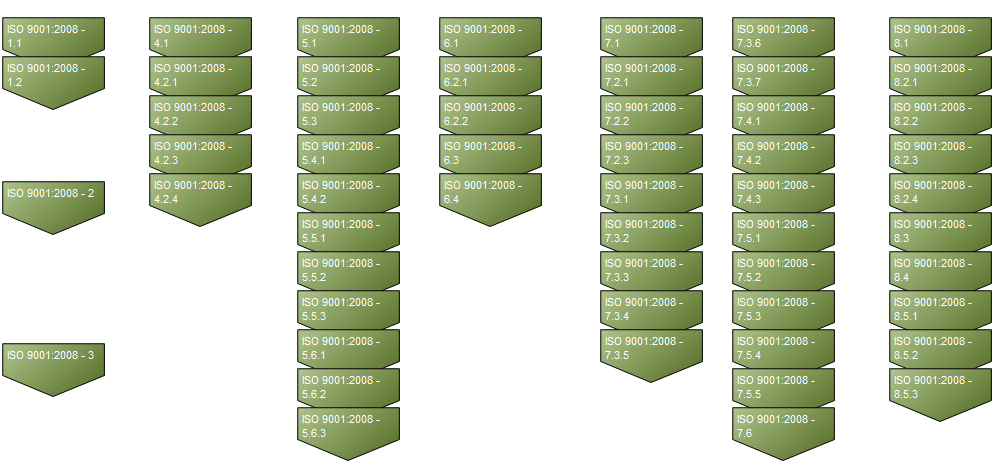
Core concerns: The Regulation Diagram template can model Regulations, Licenses, Business Scopes, Activities, Business Objects and their Connections. With this pallet of objects, you can model an overview of the regulations your organization must adhere to and break them down to more detailed diagrams describing their paragraphs. We recommend you keep it simple and link the regulations to the relevant Business Processes rather than modelling them in a complex diagram. Below, you can see two example of how you could model a Regulation Diagram for the ISO 9001:2008 standard:

RegulationDiagram_2

RegulationDiagram_1

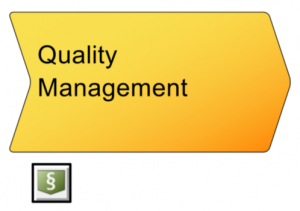
Relation to other templates: As mentioned, the regulations can be linked to the relevant Business Processes or Activities, that typically are detailed in a Workflow Diagram or Business Process Diagram. The Regulation could then be shown as a link below the relevant Business Process or Activity:

How the enterprise will live up to the requirements from the different regulations can also be modelled in a Requirement Model.

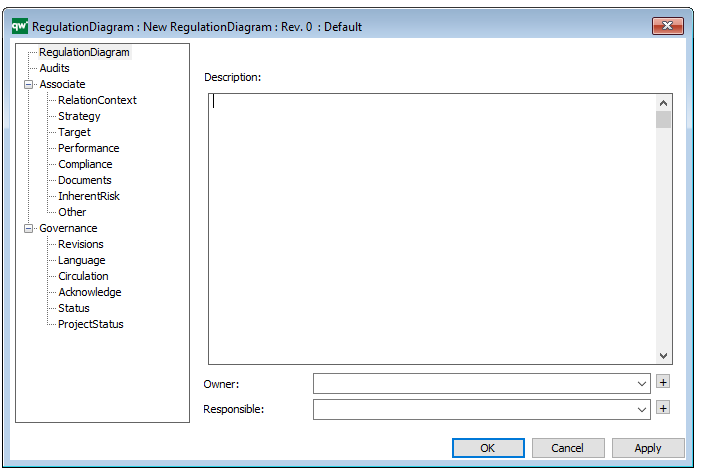
Properties and metadata: The Regulation Diagram can for example retain the following information:

  • A description of the diagram
  • Link to the owner of the diagram
  • Link to the one responsible for the accuracy of the diagram
  • Audits (auto generated information regarding its current state and access rights)
  • Associated documents, diagrams and other objects
  • Inherent Risk detailing risk considerations
  • Governance information detailing information about the published diagram and who has been involved in the approval of the diagram
  • Project status: information about budgeted and actual man-hours spent, percentage completed and the latest milestone, result and quality control of a change process.

In the picture below you can see the Regulation Diagram’s properties dialogue window, where the properties can be viewed and edited:

Product Rule Table

Purpose: The purpose of the Product Rule Table template is to document the rules pertaining to a specific product.

Core concerns: The Product Rule Table is used as an auxiliary template and functions like a matrix that contains Product Rules.

Below, you can see an example of a Product Rule Table for a balcony:

ProductRuleTable_1

Relation to other templates: The Product Rule Table is related to templates such as Manufacturing Routing Network, Product Architecture, and Product Variant Master.

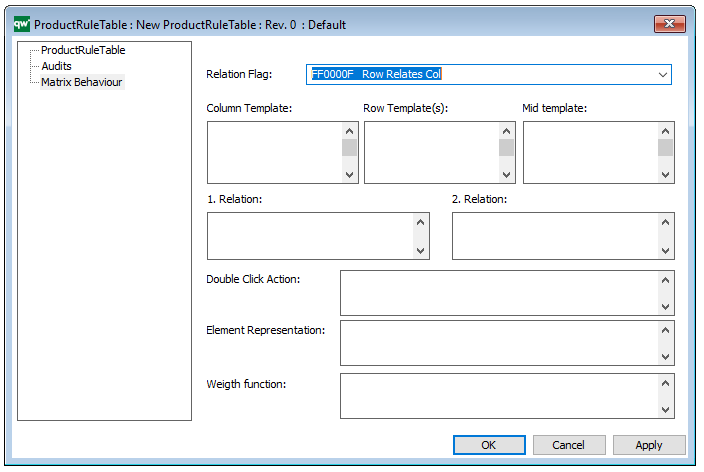
Properties and metadata: The Product Rule Table can for example retain the following information:

  • A description of the table
  • Audits (auto generated information regarding its current state and access rights)
  • Matrix Behavior

The above picture shows the properties dialogue window for the Product Rule Table where you can view and edit the diagram’s properties in QualiWare Lifecycle Manager.

Environmental Impact Diagram

Purpose: The purpose of the Environmental Impact Diagram template is to document the environmental aspects and impacts for an Activity or Business Process.

Core concerns: The Environmental Impact Diagram enables you to model Business Functions, Activities, Business Objects, Environmental Aspects (Environmental Aspect, Environmental Impact, Health and safety impact) and Business Scopes. These elements can then be connected by Impact Quantities.

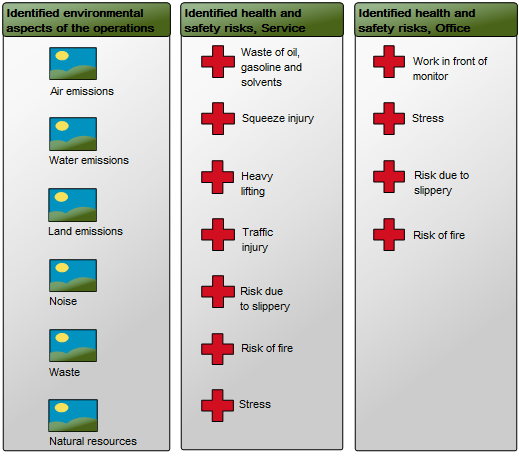
Below, you can see an example of an Environmental Impact Diagram, detailing the Environmental aspects and Health and safety impact:

EnvironmentalImpactDiagram_1

The diagram shows all identified aspects and modes of impact for one or more specific processes.

Relation to other templates: The Environmental Impact Diagram is related to the Lifecycle Assessment diagram as well as templates containing Activities, Business Functions, Lines of Business, and Logistical Flows. As such, it is related to, for example, Business Process Diagrams, Workflow Diagrams, Business Diagrams, and Strategy Models.

Properties and metadata: The Environmental Impact Diagram template ­­­­can for example retain the following information:

  • A description of the diagram
  • Link to the owner
  • Link to the responsible
  • Audits (auto generated information regarding its current state and access rights)
  • Associated documents, diagrams and other objects
  • Inherent Risk detailing risk considerations
  • Governance information detailing information about the published diagram and who has been involved in the approval of the diagram

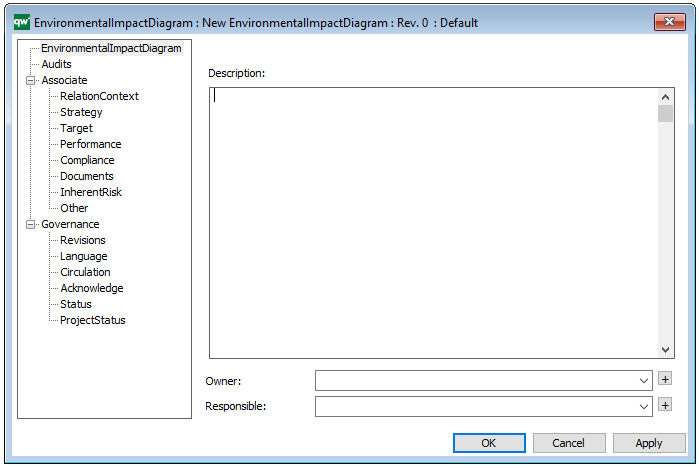
The above picture shows the properties dialogue window for the Environmental Impact Diagram, where you can view and edit the diagram’s properties in QualiWare Lifecycle Manager.
Decision Model

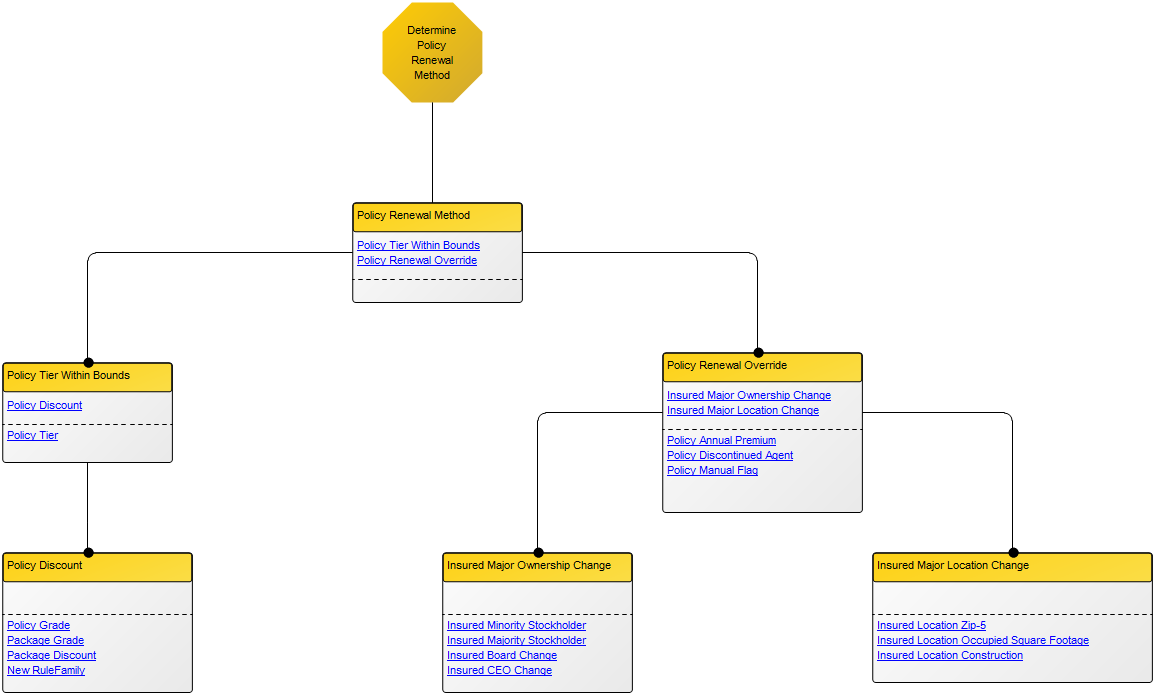
Purpose: The purpose of the Decision Model template is to document complex decisions by modelling decision trees that illustrates decision gates. Below you can see an example of a Decision Model:

DecisionModel_1

Core concerns: Complex decisions can be documented as decision trees. The model illustrates the Business Decision and its underlying Rule Families. The Rule Families can contain Rule Family Tables, that precisely describe the outcome of a given set of variables. Below you can see an example of a Rule Family Table:

DecisionModel_2

Relation to other templates: Where the Decision Model template illustrates the decision gates, the end to end process is described in either a Work Flow Diagram or a Business Process Diagram.

Properties and metadata: The Decision Model can for example retain the following information:

  • A description of the diagram
  • Link to the owner of the diagram
  • Link to the one responsible for the accuracy of the diagram
  • Audits (auto generated information regarding its current state and access rights)
  • Associated documents, diagrams and other objects
  • Inherent Risk detailing risk considerations
  • Governance information detailing information about the published diagram and who has been involved in the approval of the diagram
  • Project status: information about budgeted and actual man-hours spent, percentage completed and the latest milestone, result and quality control of a change process.

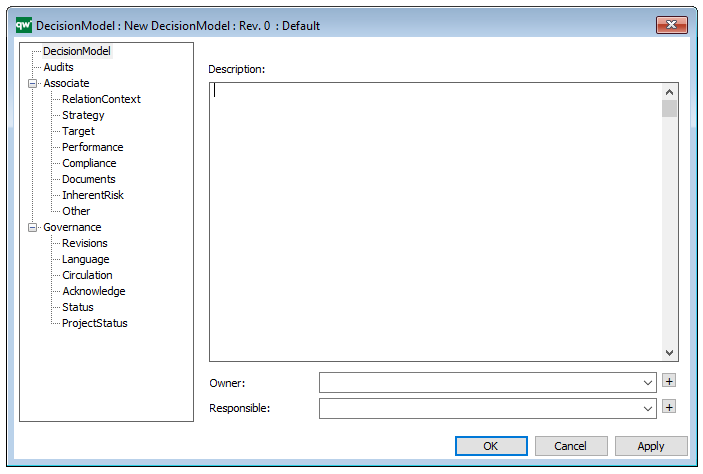
In the picture below you can see the Decision Model’s properties dialogue window, where the information can be viewed and edited:


Data Mapping Diagram

Purpose: The purpose of the Data Mapping Diagram is to map data’s sources.

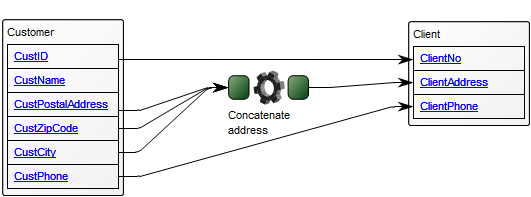
Core concerns: The Data Mapping Diagram template enables you to model Data Entities, Classes, Tables, Records and Mapping Algorithms. These are connected by Data Mappings. The Data Mapping Diagram is sometimes called Entity Mapping Diagram.

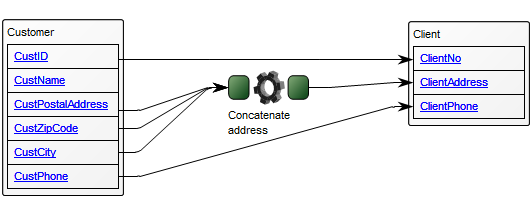
Below, you can see an example of a Data Mapping Diagram where data is moved from one table to another transforming from ‘customer data’ into ‘client data’:

DataMappingDiagram_1

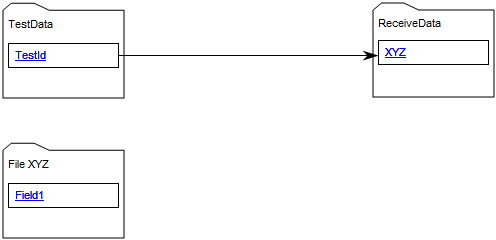
The following very simple diagram illustrates the relations between Records and their elements:

DataMappingDiagram_2

Relation to other templates: The Data Mapping Diagram is, through the object Data Transformation, related to the Data Replication Diagram. Data Transformation is contained in the Data Replication Diagram and has a mapping which is described in the Data Mapping Diagram.

Properties and metadata: The Data Mapping Diagram can for example retain the following information:

  • A description of the diagram
  • Audits (auto generated information regarding its current state and access rights)
  • Associated documents, diagrams and other objects
  • Inherent Risk detailing risk considerations
  • Governance information detailing information about the published diagram and who has been involved in the approval of the diagram

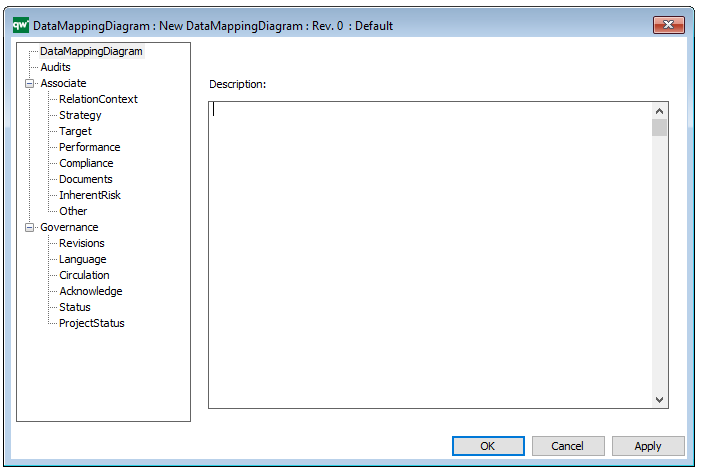
The above picture shows the properties dialogue window for the Data Mapping Diagram where you can view and edit the diagram’s properties in QualiWare Lifecycle Manager.


Business Object Model

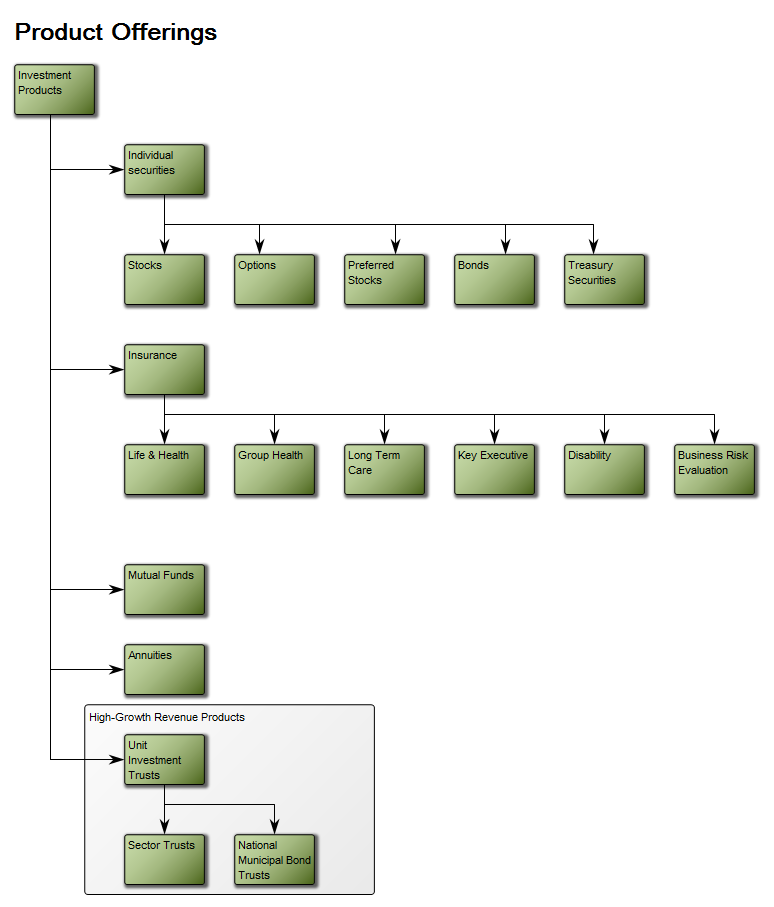
Purpose: The purpose of the Business Object Model is to present a structured view of an organization’s products and services.

Core concerns: The focus of this template is the Business Object that can be described through Decomposition, Generalization, Association and Dependency with other Business Objects. Notes can be used to group Business Objects, for example as High-Growth Revenue Products, as seen in the below model:

BusinessObjectModel

The modelling syntax can be extended to also include strategic elements such as: Requirements, Problems, Change Requests, Goals, Performance Indicators and policies. They can be connected to the Business Objects through Strategic Alignment.

Relation to other templates: The Business Object Model belongs to the Information domain where it offers a conceptual and logical view of an organizations products and services. As such, it is related to templates such as Product Canvas, Product Roadmap and Product Variant Master

Properties and metadata: The Business Object Model can for example retain the following information:

  • A description of the diagram
  • Link to the owner of the diagram
  • Link to the one responsible for the diagram
  • Audits (auto generated information regarding its current state and access rights)
  • Associated documents, diagrams and other objects
  • Inherent Risk detailing risk considerations
  • Governance information detailing information about the published diagram and who has been involved in the approval of the diagram

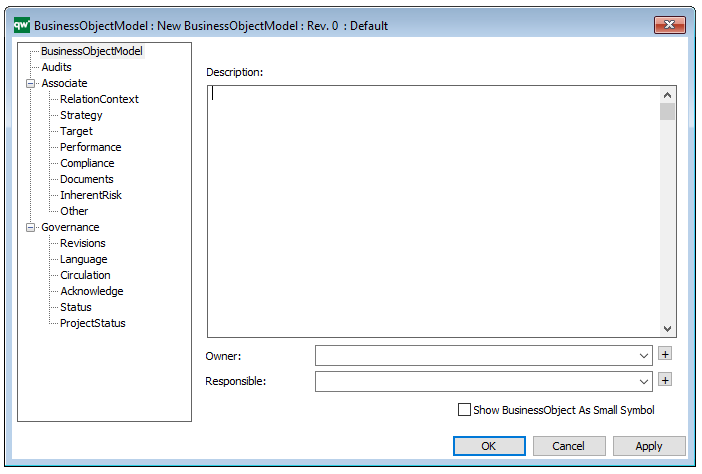
The above picture shows the properties dialogue window for the Business Object Model, where you can view and edit the diagram’s properties in QualiWare Lifecycle Manager.
Business Diagram

Purpose: The purpose of a Business Diagram is to show the functional structure and relationships of the whole or part of an organization.

Core concerns: The Business Diagram template enables you to model Business Functions, Information Systems, Inventory, Business Scope, Lines of Business, Information Flow and Logistical Flow. The diagram’s syntax can be extended to also include strategic elements such as Goals, Objectives, Stakeholders and Performance Indicators.

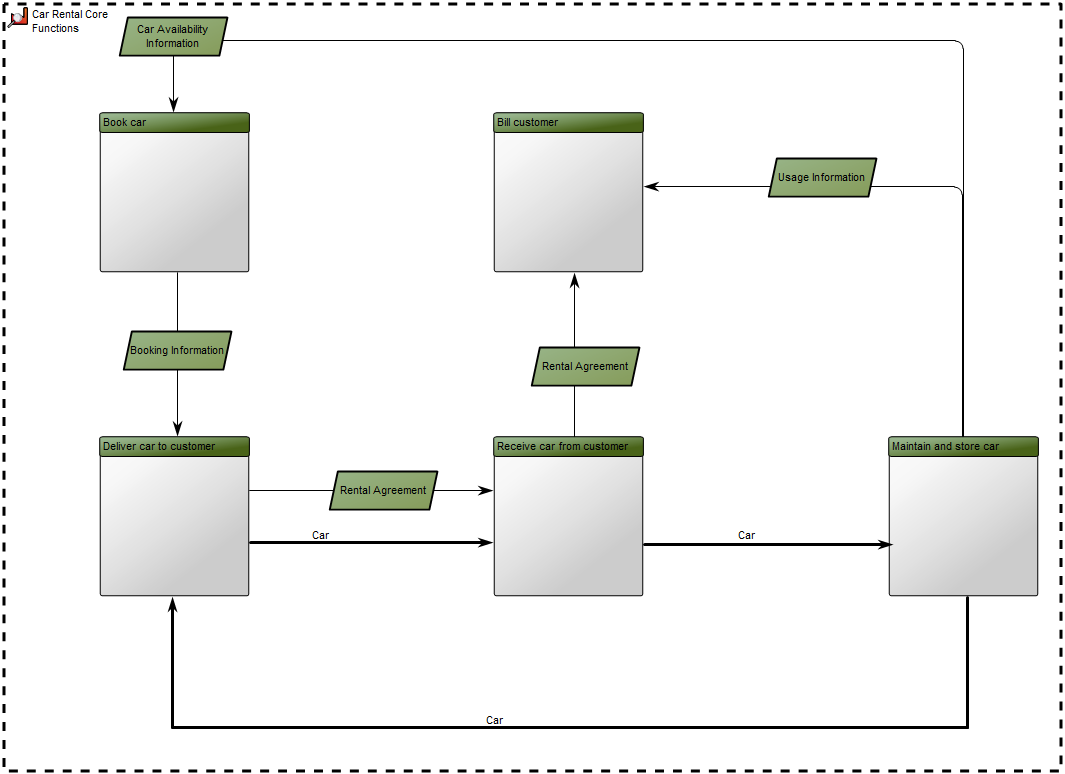
The Business Diagram should be broken down into several levels of recurring Business Diagram templates. In the model below, you can see an example of a high-level Business Diagram showing Business Functions and their Information Flows and Logistical Flows –  describing the flow of products and services – in this case for a car rental service.

The Business Functions are placed with the operational functions in the bottom together with the Logistical Flow and with management control at the top of the Business Diagram.

On lower levels (decompositions) of Business Diagrams, Information Systems are placed close to the Business Functions that are responsible for or own the Information Systems.

Relation to other templates: The Business Diagram can be used as an addition to a Business Process Network and Strategy Models, giving a practical view of how the organizations functions fit together, illuminating interdependencies.

Properties and metadata: The Business Diagram can for example retain the following information:

  • A description of the diagram
  • Link to the owner of the Diagram
  • Link to the one responsible for the Diagram
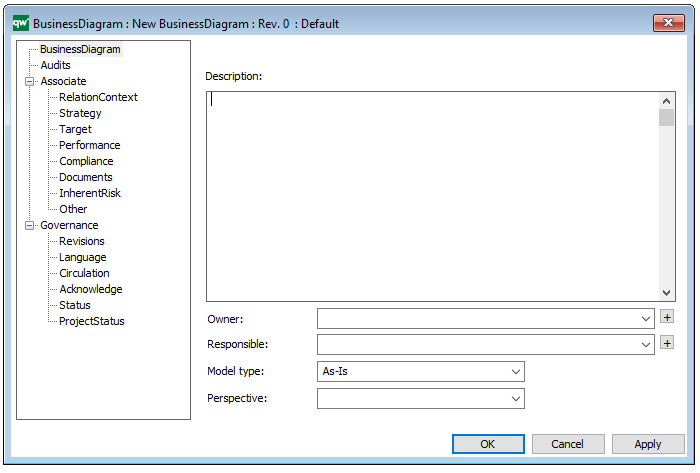
  • Indication of the diagram portrays an as-is situation or a to-be situation
  • The Perspective can be defined as either: Holistic, Sub-functional, Process, or IT Focused.
  • Audits (auto generated information regarding its current state and access rights)
  • Associated documents, diagrams and other objects
  • Inherent Risk detailing risk considerations
  • Governance information detailing information about the published diagram and who has been involved in the approval of the diagram

The above picture shows the properties dialogue window for the Business Diagram where you can view and edit the diagram’s properties in QualiWare Lifecycle Manager.