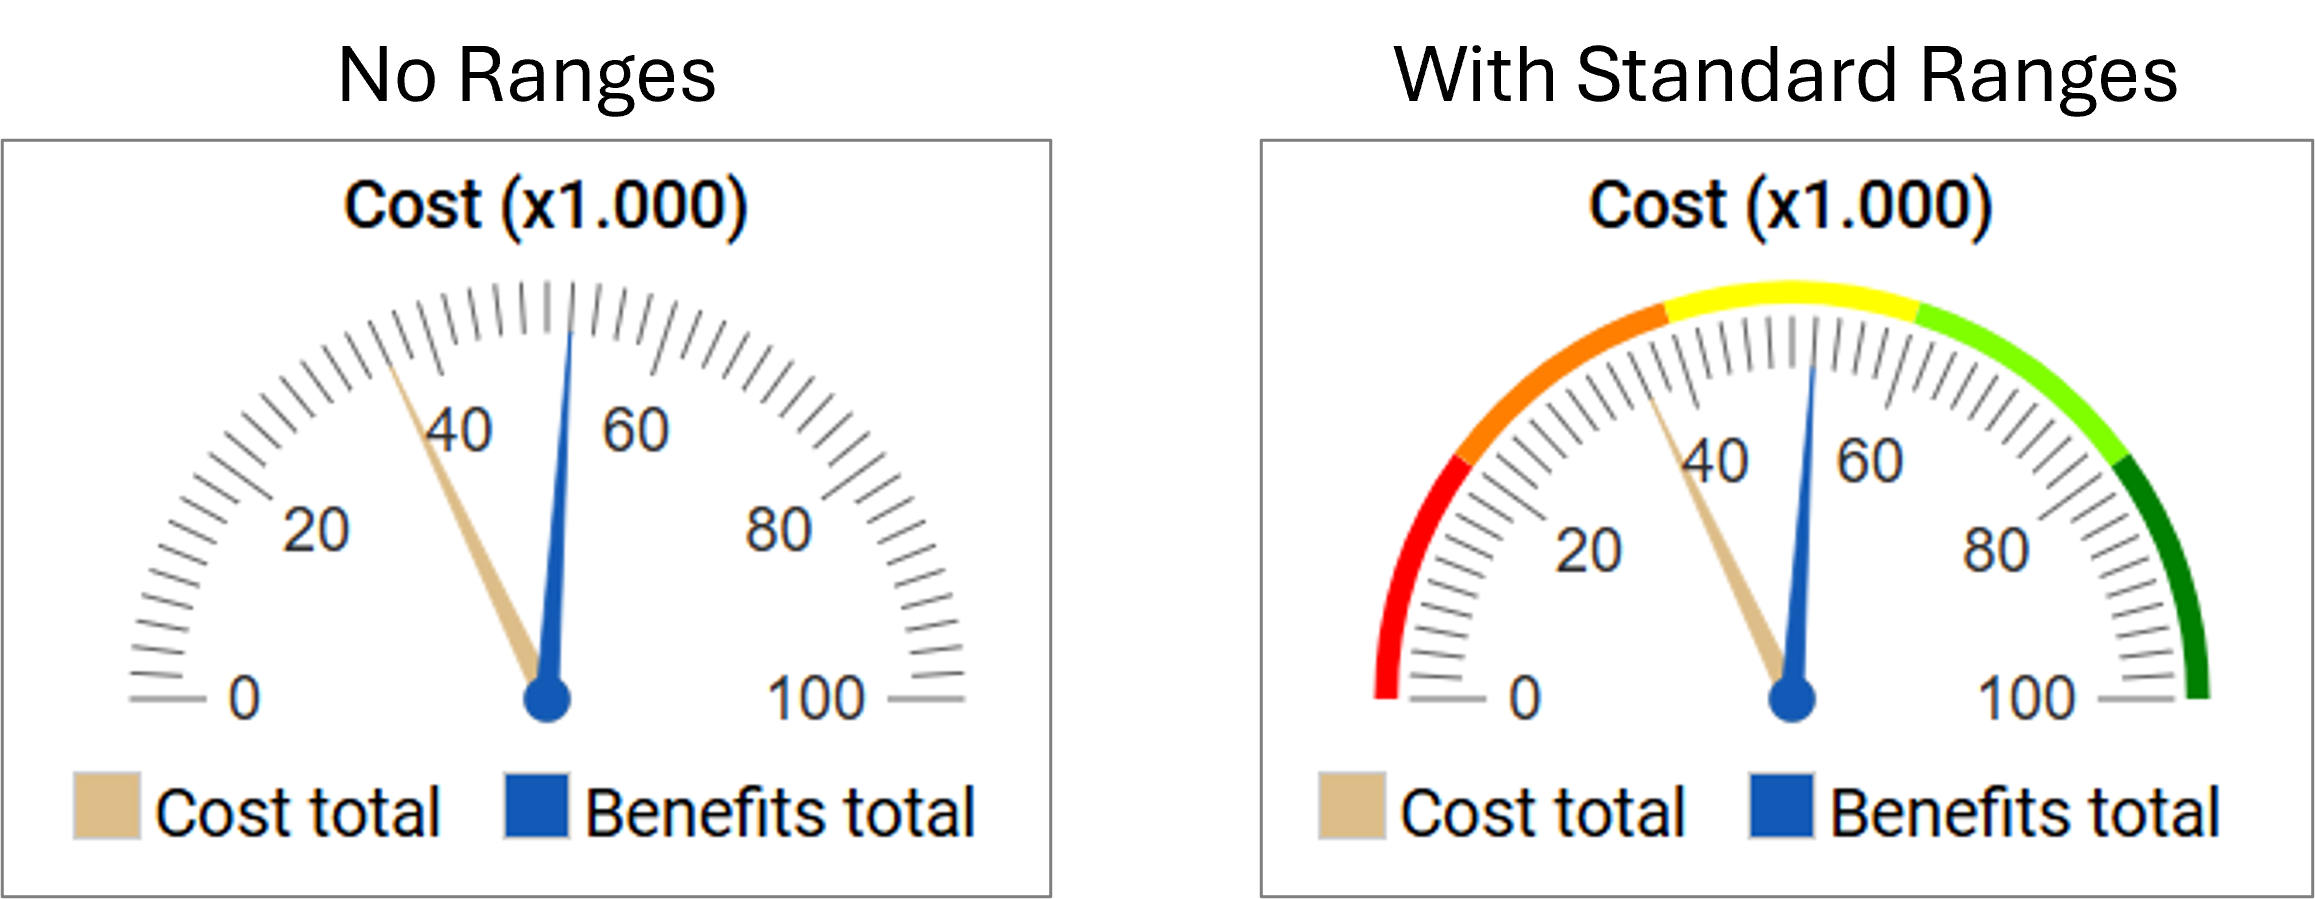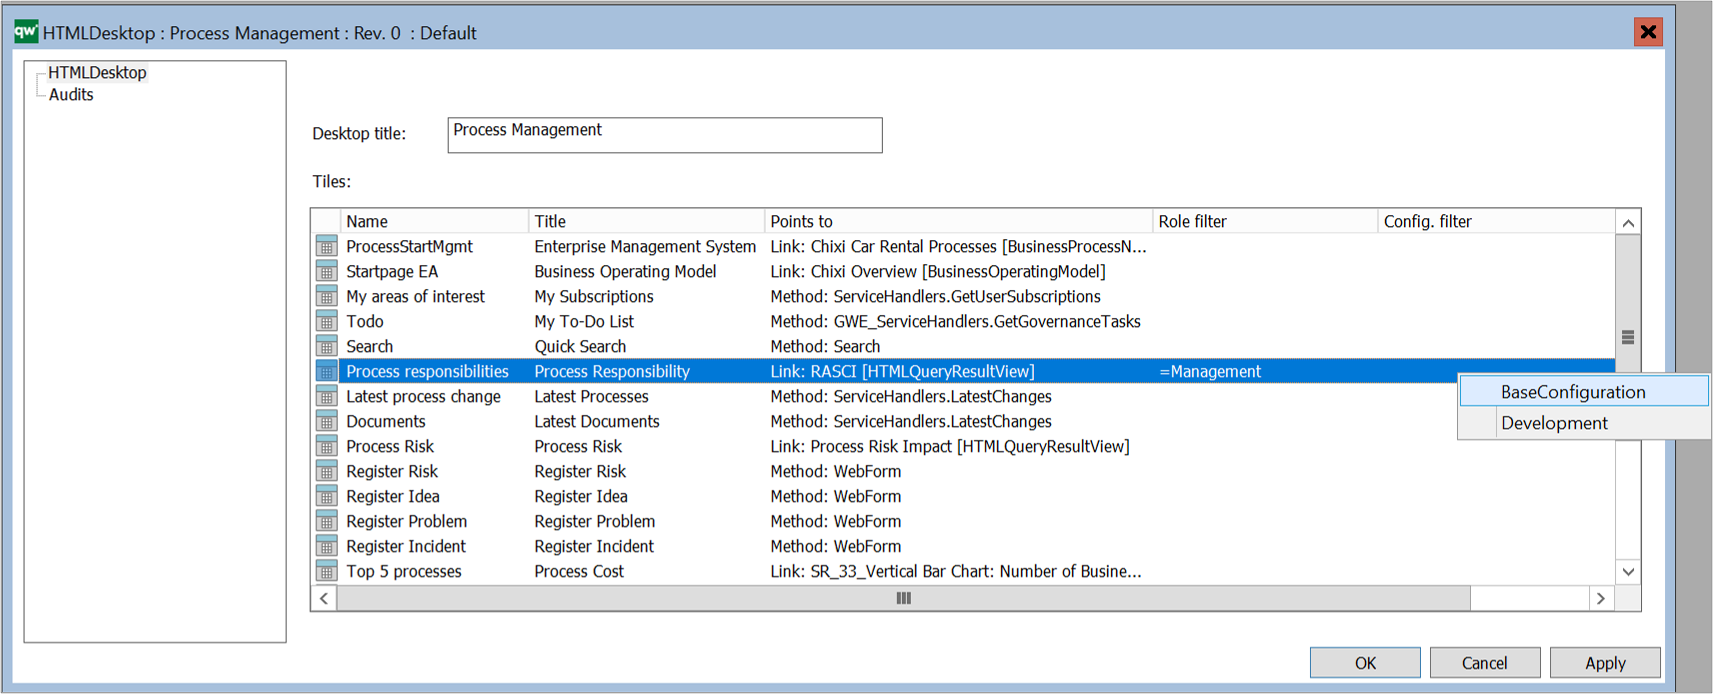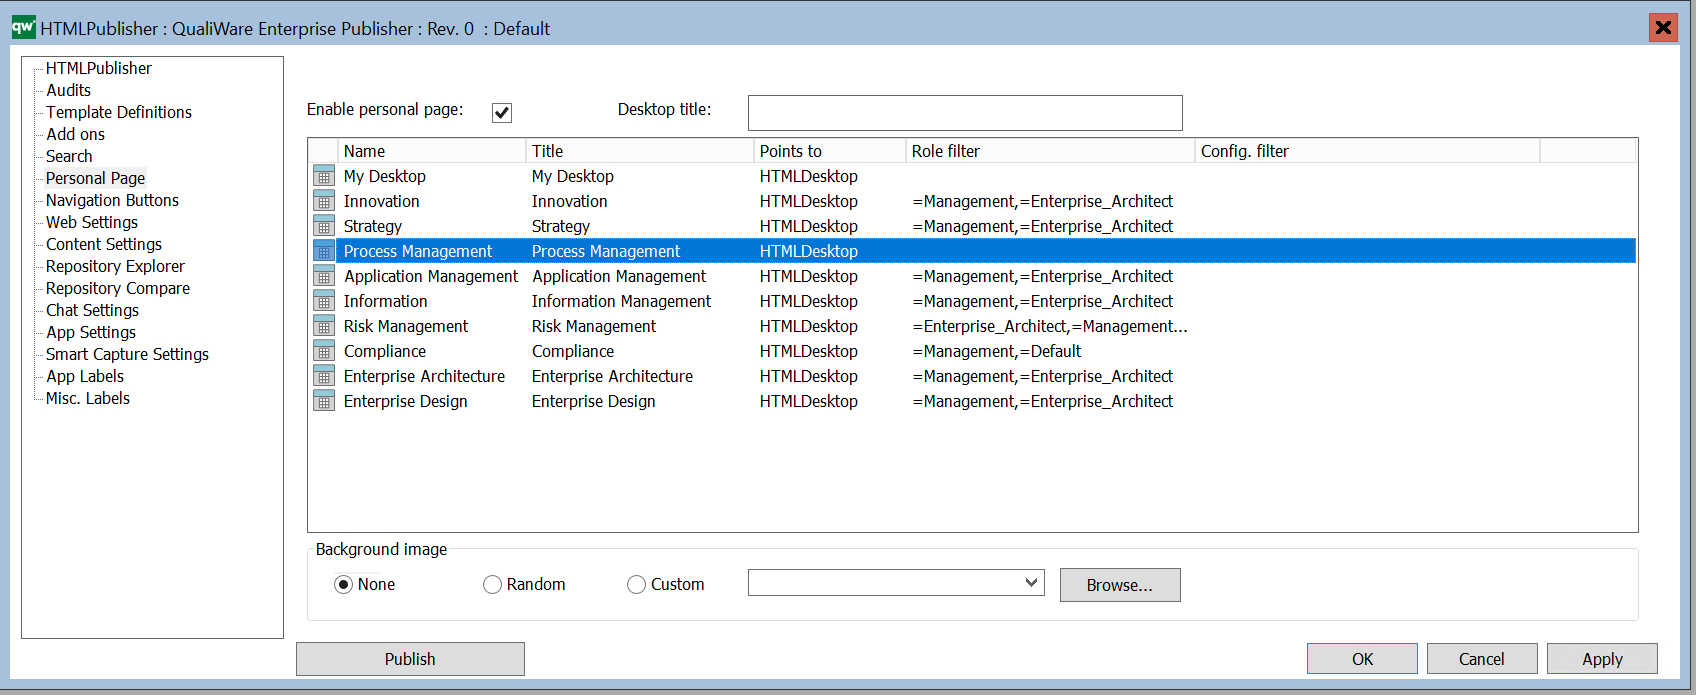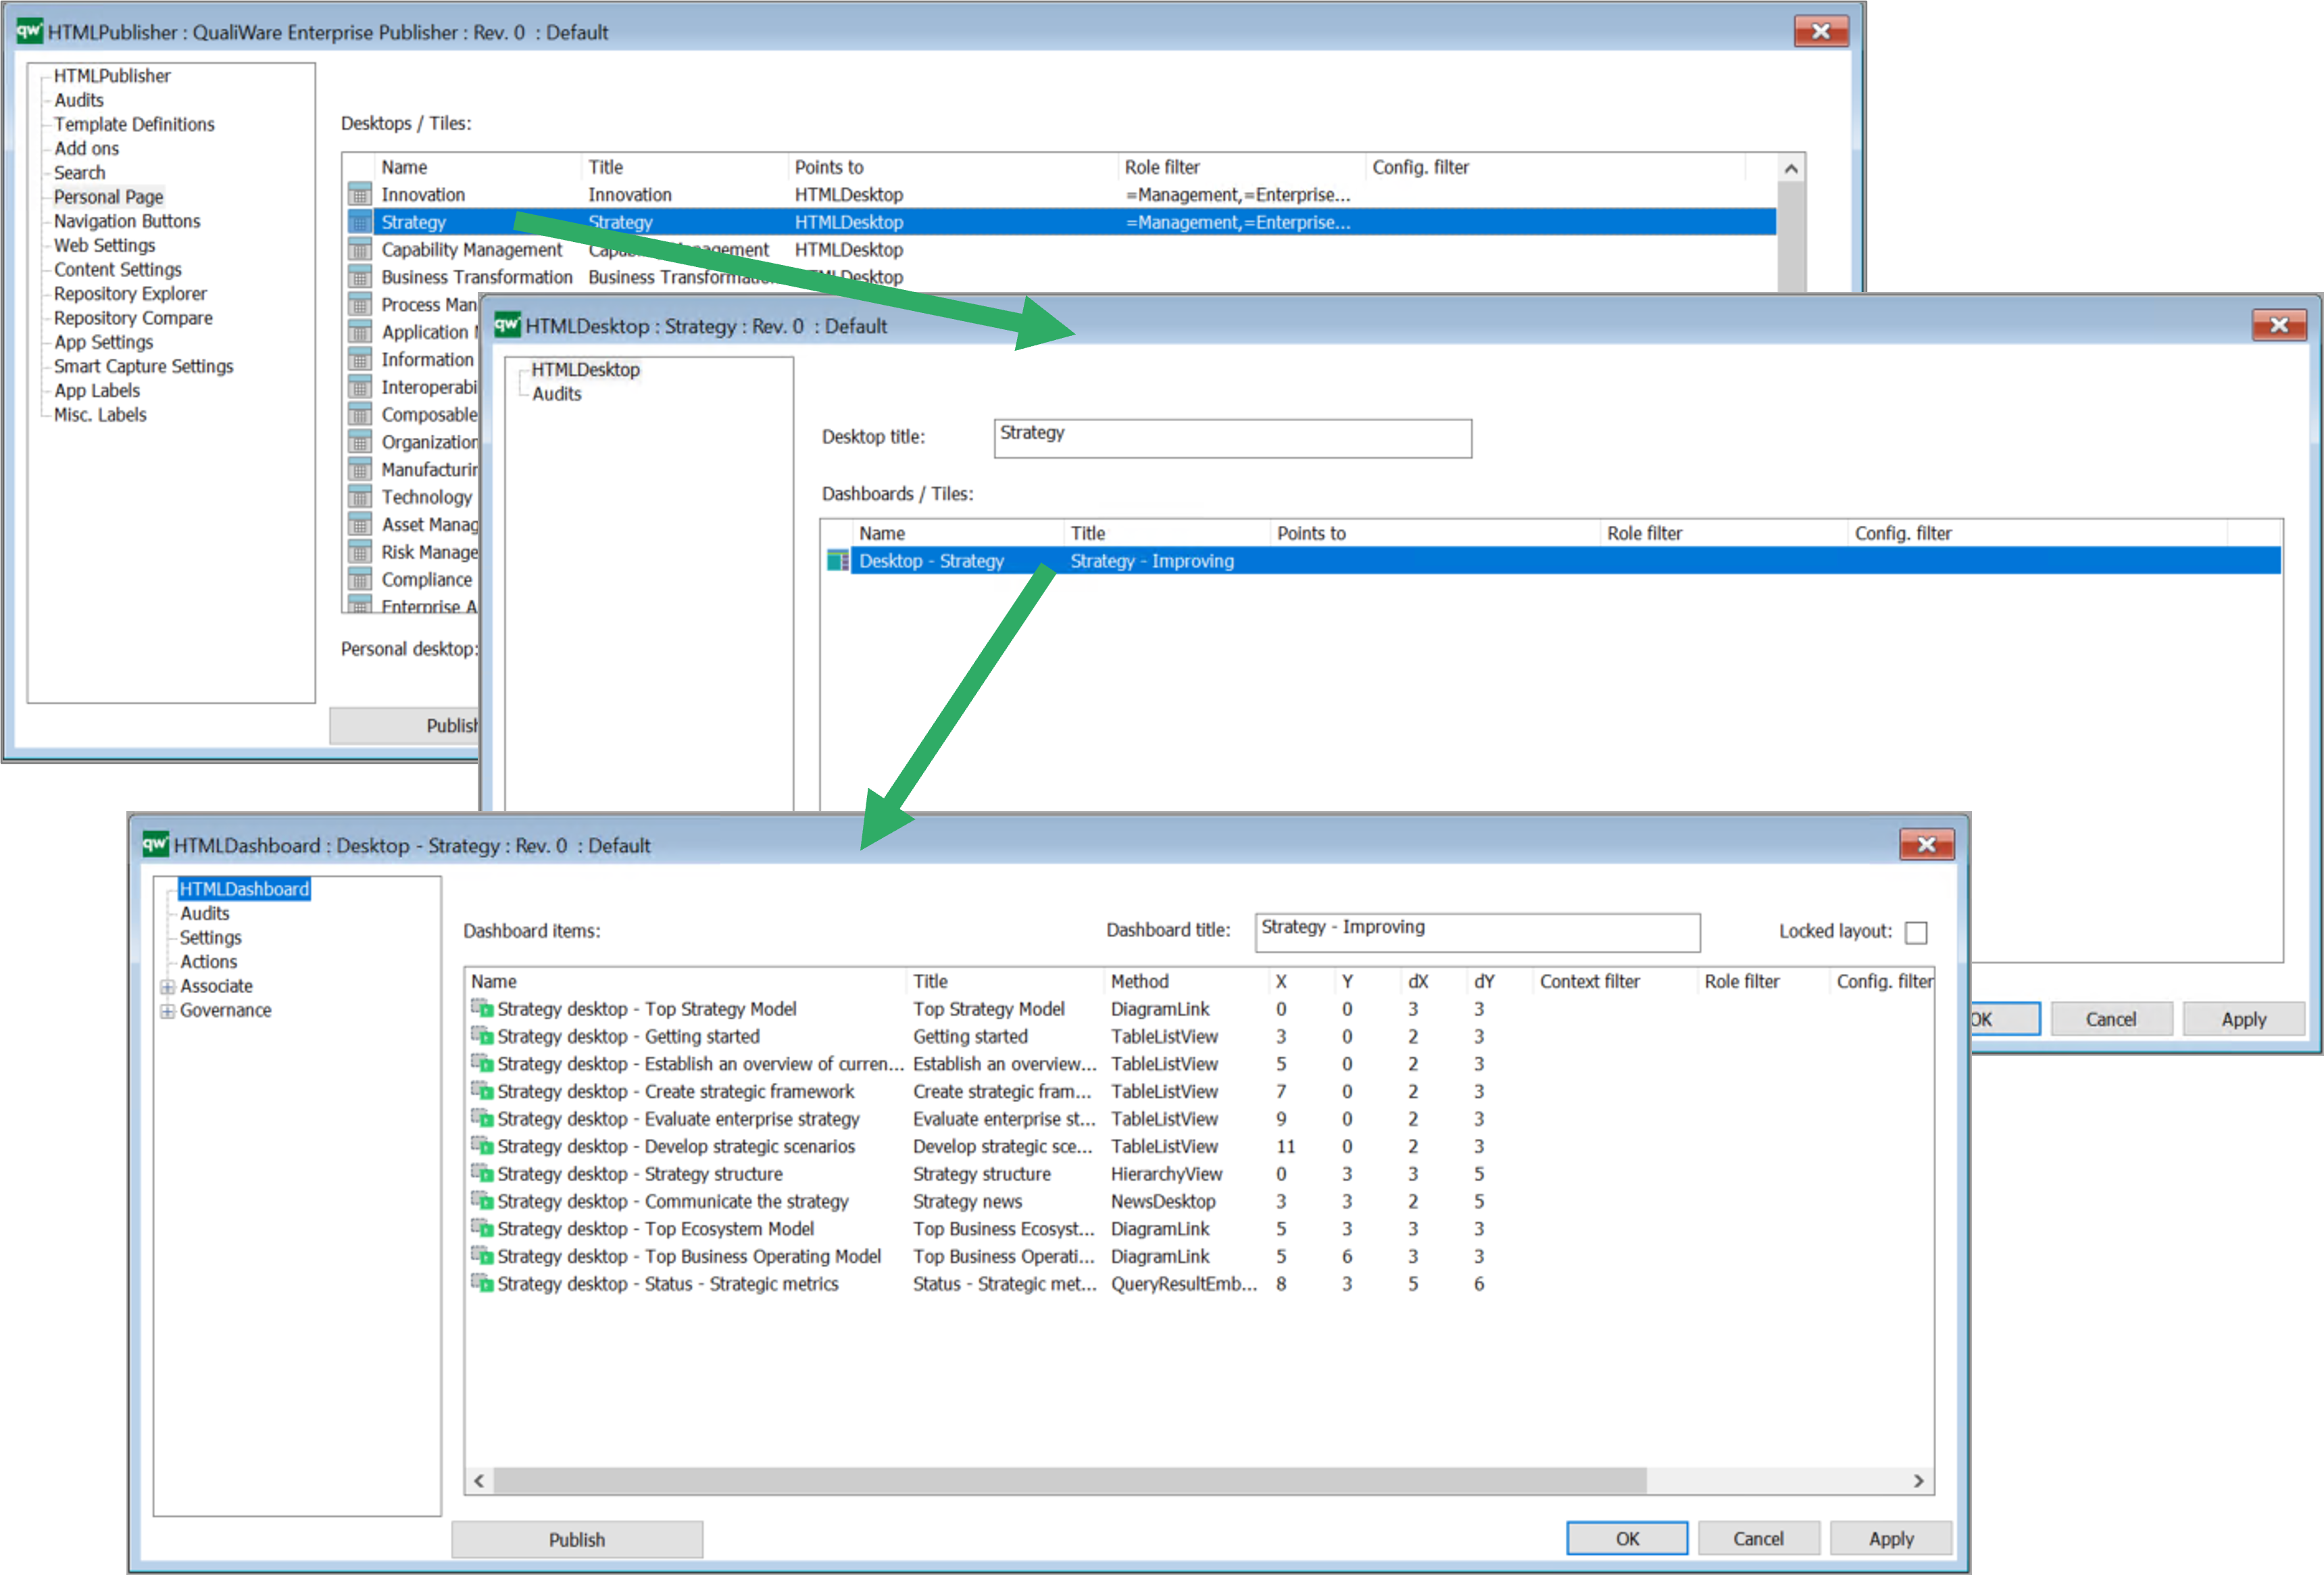
Gauges are a form of charts that can be used to in the web solution.
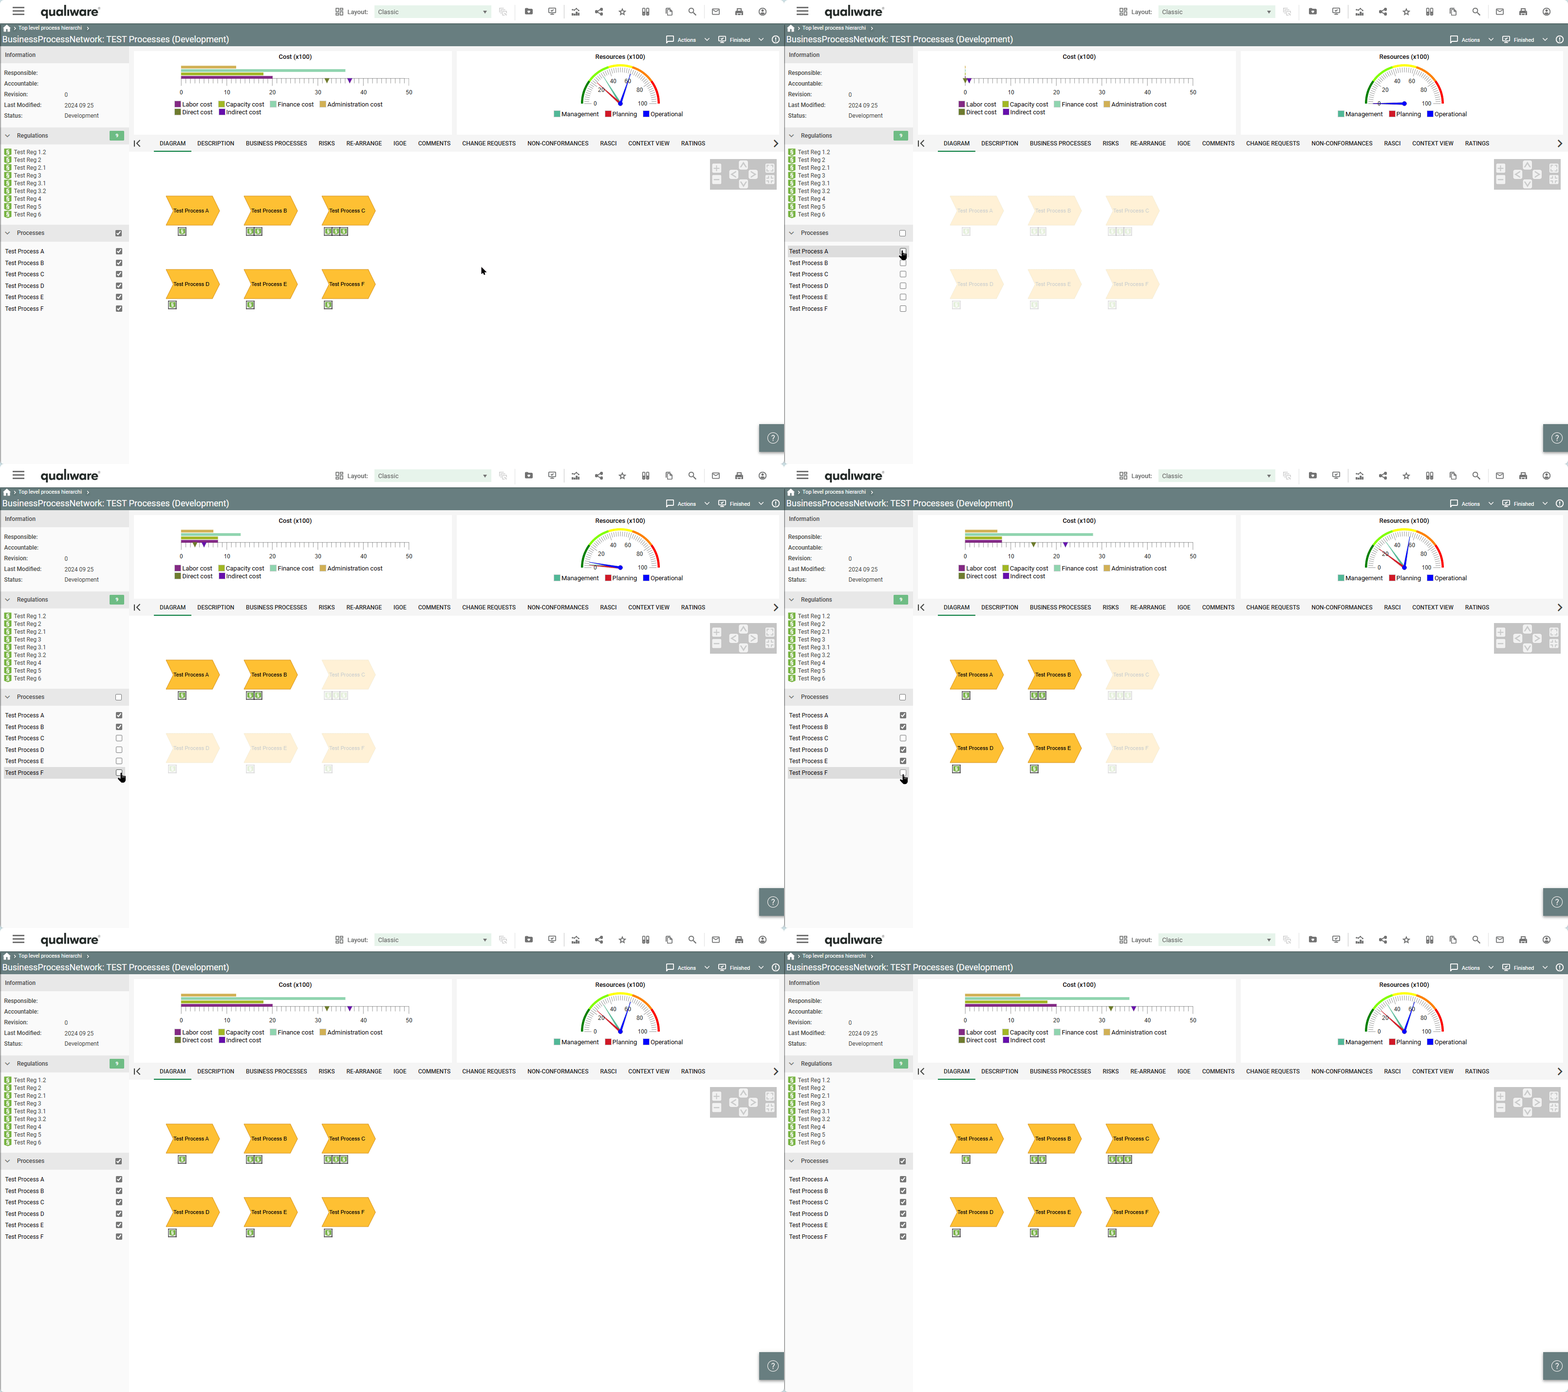
When used in relation to a contextbox with a checklist they aggregate based upon the checked selection.
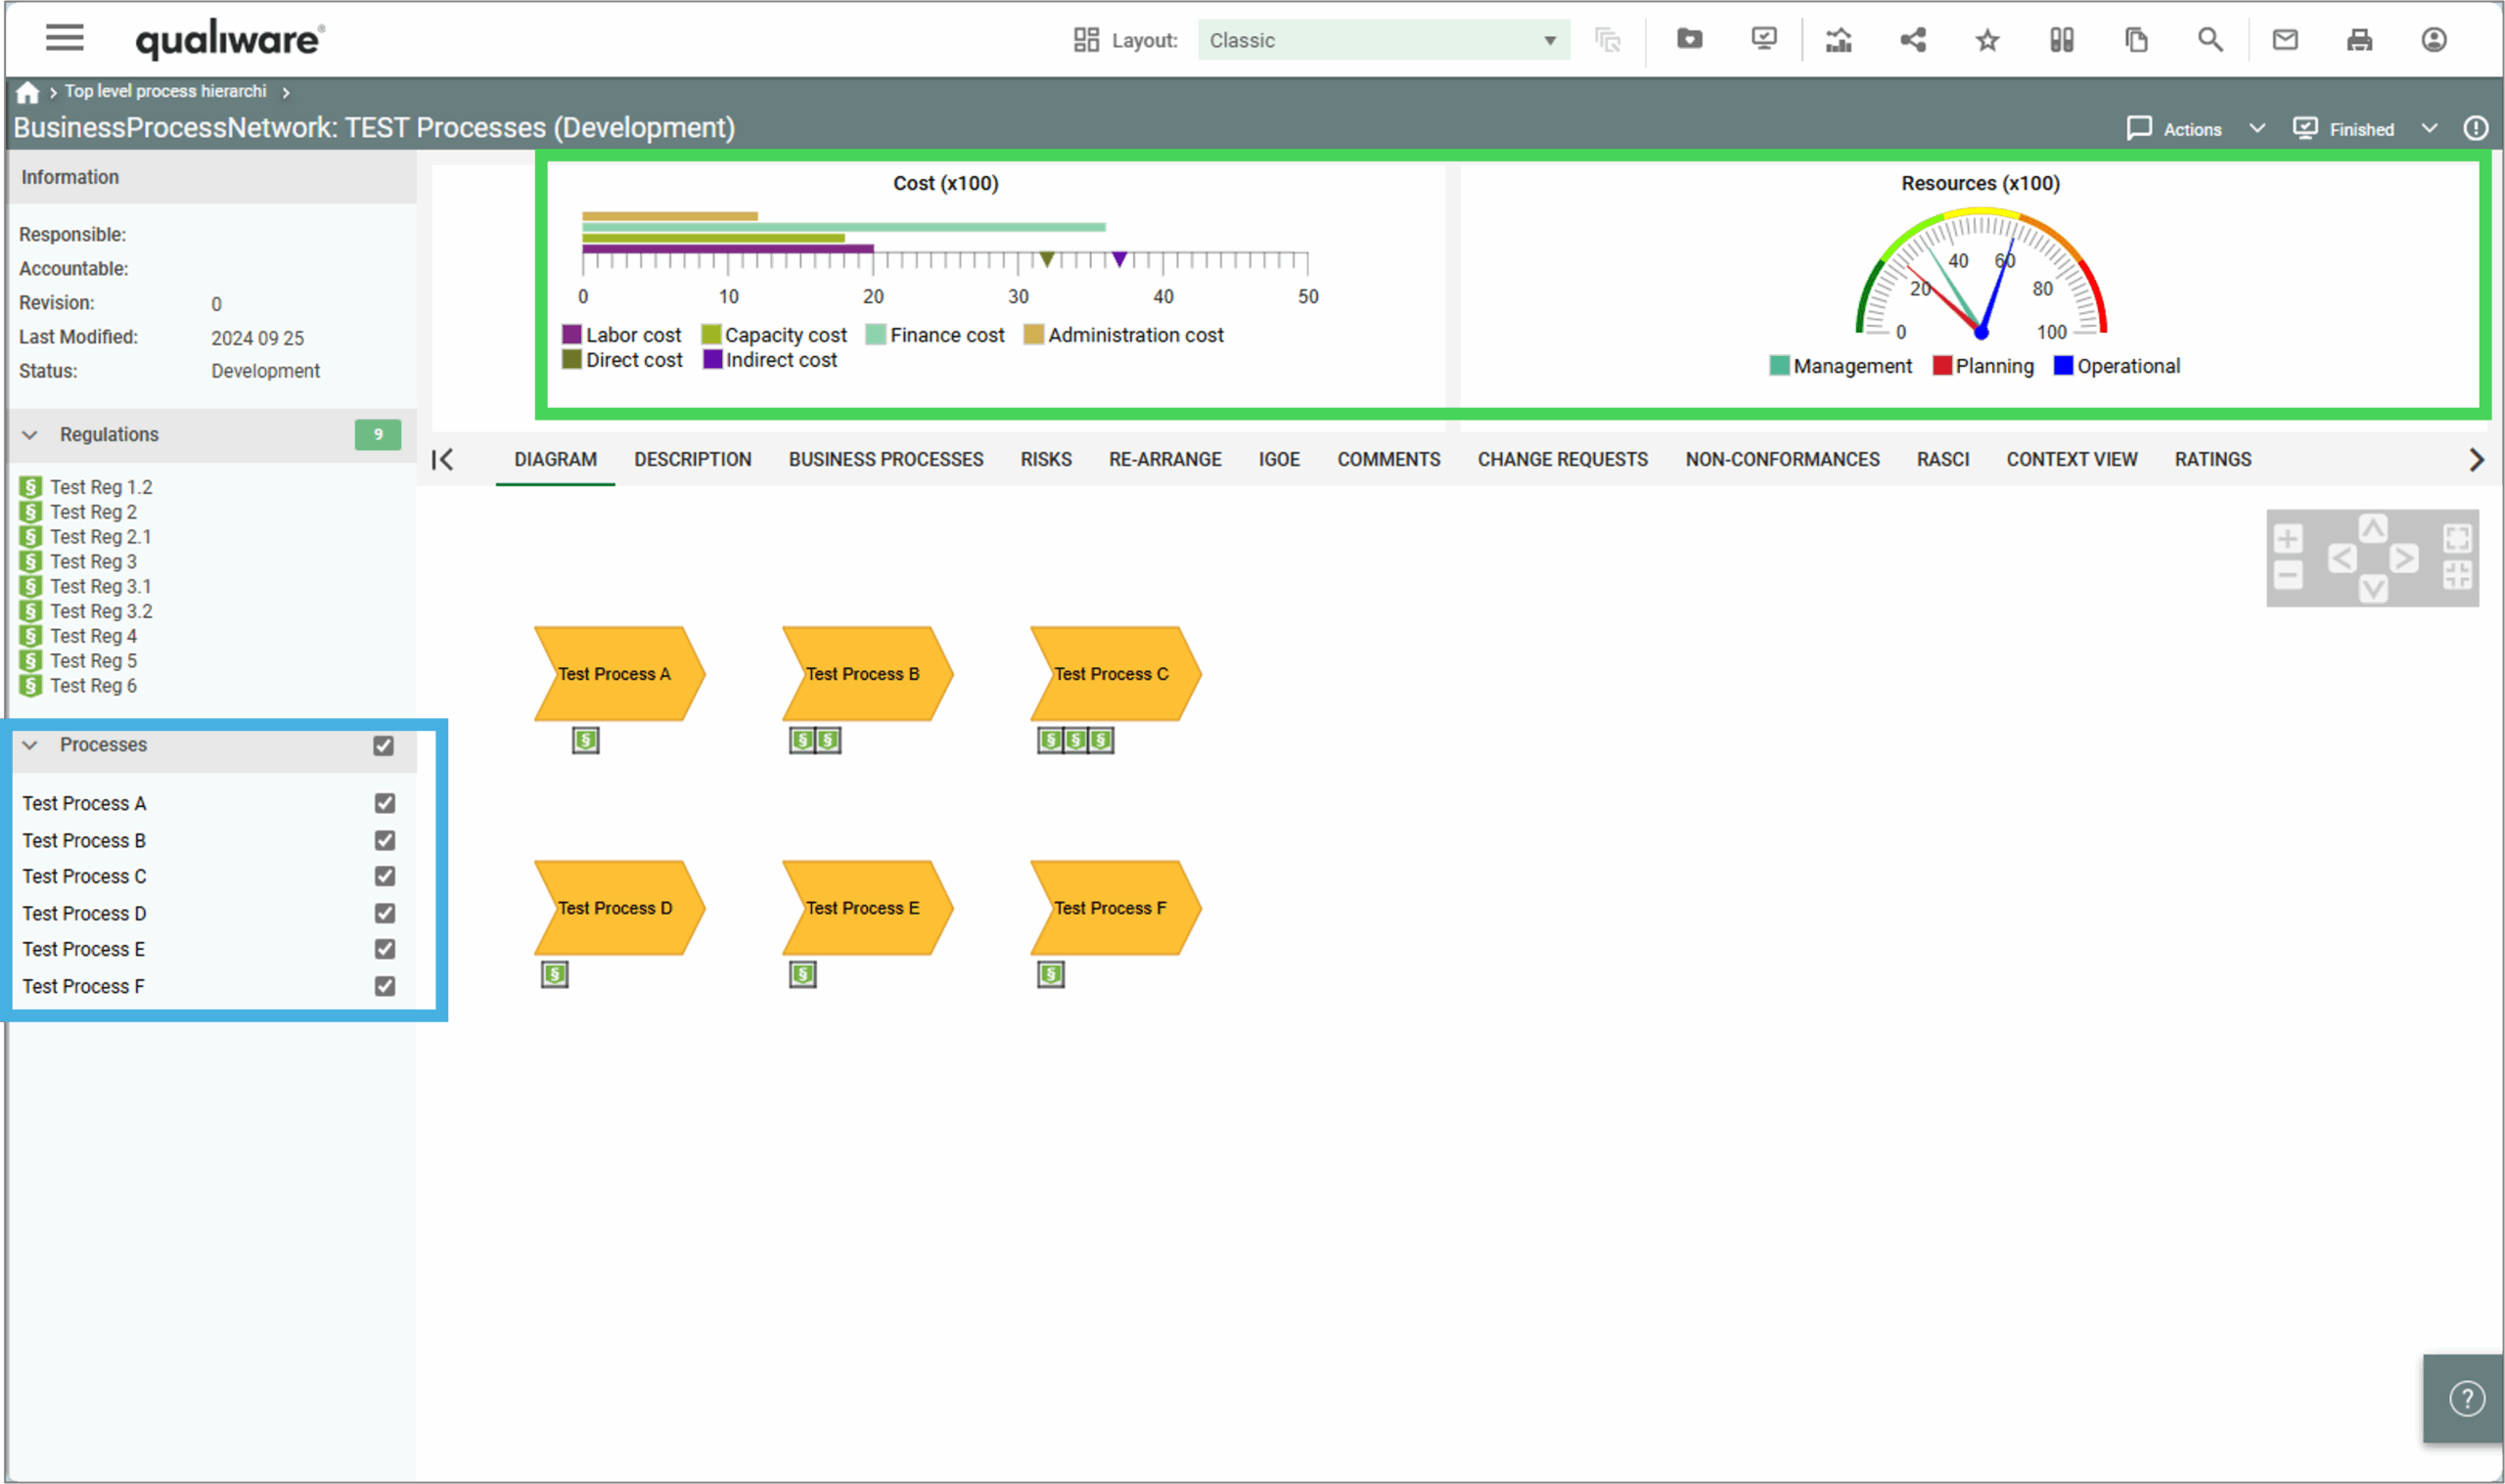
Business Gauges can be used in the center top content of the HTMLTemplateDefinition.
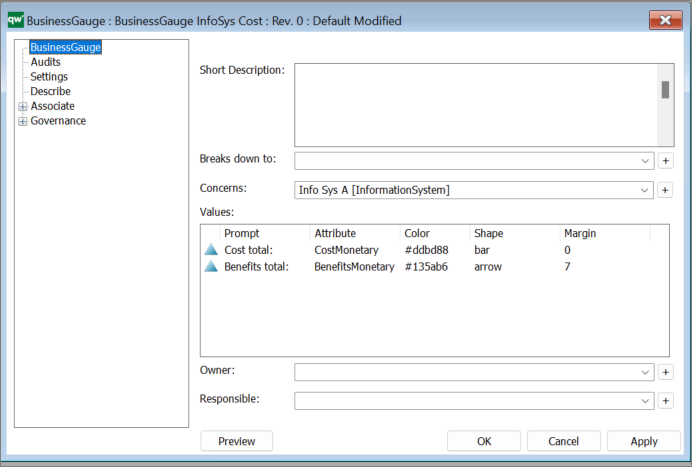
Concerns: Here you link to an object of the type which data you would like to display (in the example above an InformationSystem)
Value:
For the gauge chart to display anything, it needs some values. Values are provided by either using URL parameters or by setting up a checklist in a HTMLContentBox left or right panel. When using a checklist, the attributes, defined in Value, will be taken from the selected objects and used in the gauge chart.
- Prompt: The prompt that explains to the user, what this value means.
- Attribute: The attribute to take a value from.
- Color: The color of the value. It will be used in the legend next to the prompt, and also in the chart. Colors should be defined in hexadecimal.
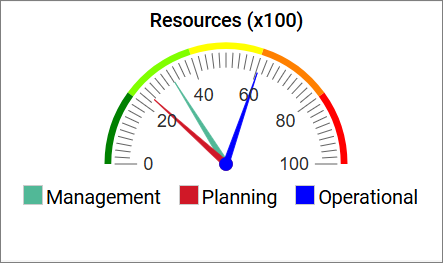
- Shape: The shape of how the value is shown in the chart. Shape does not have any meaning for a radial gauge chart as all values will be shown as arrows.
For horizontal and vertical gauge charts, the following options apply:- bar – shows the value as a bar in the chart.
- arrow – shows the value as a small arrow along the axis in the chart.
- Margin: Margin does not have any meaning for a radial gauge chart and for arrow shapes in horizontal and vertical gauge charts.
For bar shapes in horizontal and vertical gauge charts, margins can be used to place the bars next to each other.
If no margin is used, then the bars will be placed on top of each other which will make it difficult for users to easily read the values.
Tip: Use a margin divisible by 7 to space the bars evenly.
Settings:
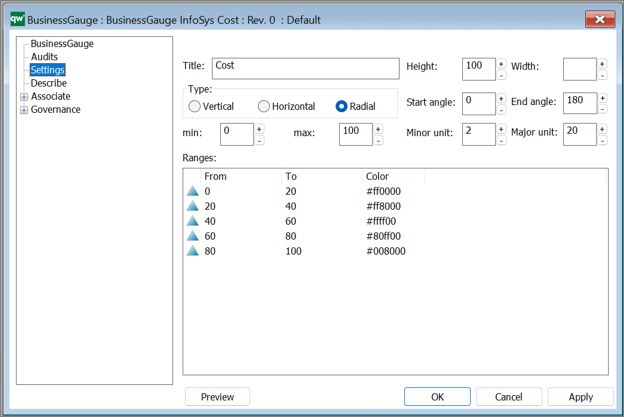
Title: The title will be shown in the top of the gauge chart on web.
Type:
- Vertical:
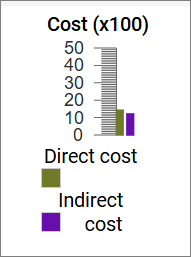
- Horizontal:

- Radial:
Miscellaneous display settings:
These are a mix of settings that each has an impact on how the final chart is displayed.
- Height: Height in pixels of the gauge chart without the legend.
- Width: Width in pixels of the gauge chart without the legend.
- Start angle: Only applicable to radial gauge chart.
The starting angle of the chart. - End angle: Only applicable to radial gauge chart.
The ending angle of the chart. - Minor unit: The minor unit of the chart shown with a small line.
- Major unit: The major unit of the chart shown with a bigger line than minor unit.
- min: The minimum value of the chart.
- max: The maximum value of the chart.
Ranges:
Ranges can be used to define if a range should be shown in a specific color. This can be used to enable a user to quickly see if any values are outside of normal values or in other ways concerning.
- From: The value at which the color should start.
It is accepted that the From value is the same as another range’s To value. - To: The value at which the color should end. It is accepted that the To value is the same as another range’s From value.
- Color: The color of the range in hexadecimal.
