The HTML Dashboard template is used to configure the dashboards introduced in QualiWare 10.8 and to configure the Desktops introduced in QualiWare 10.10.
The HTMLDashboard-template contains a collection of HTMLDashBoardItems.
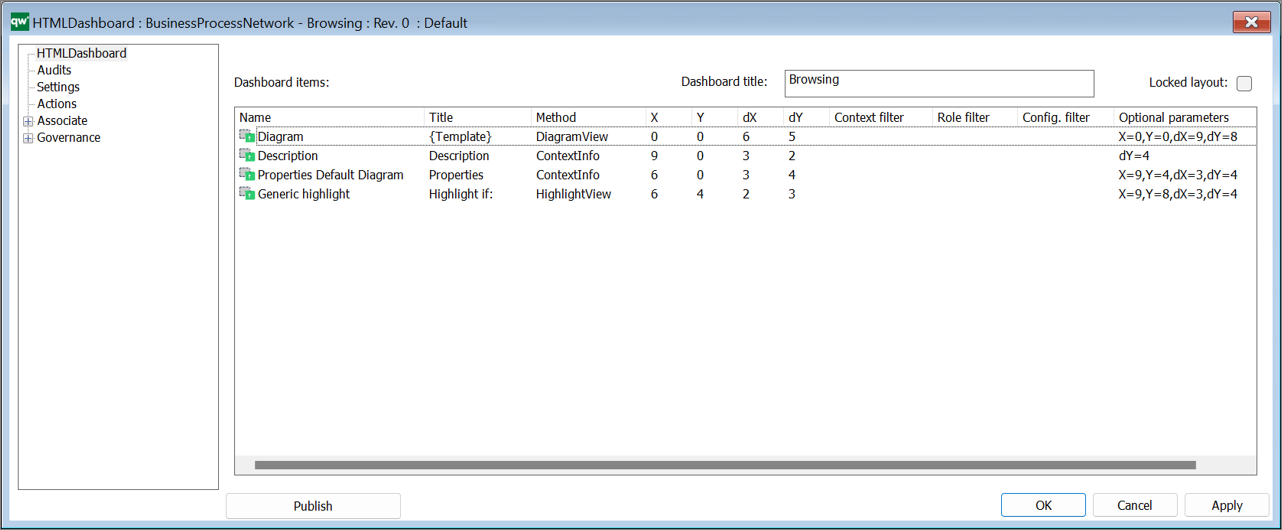
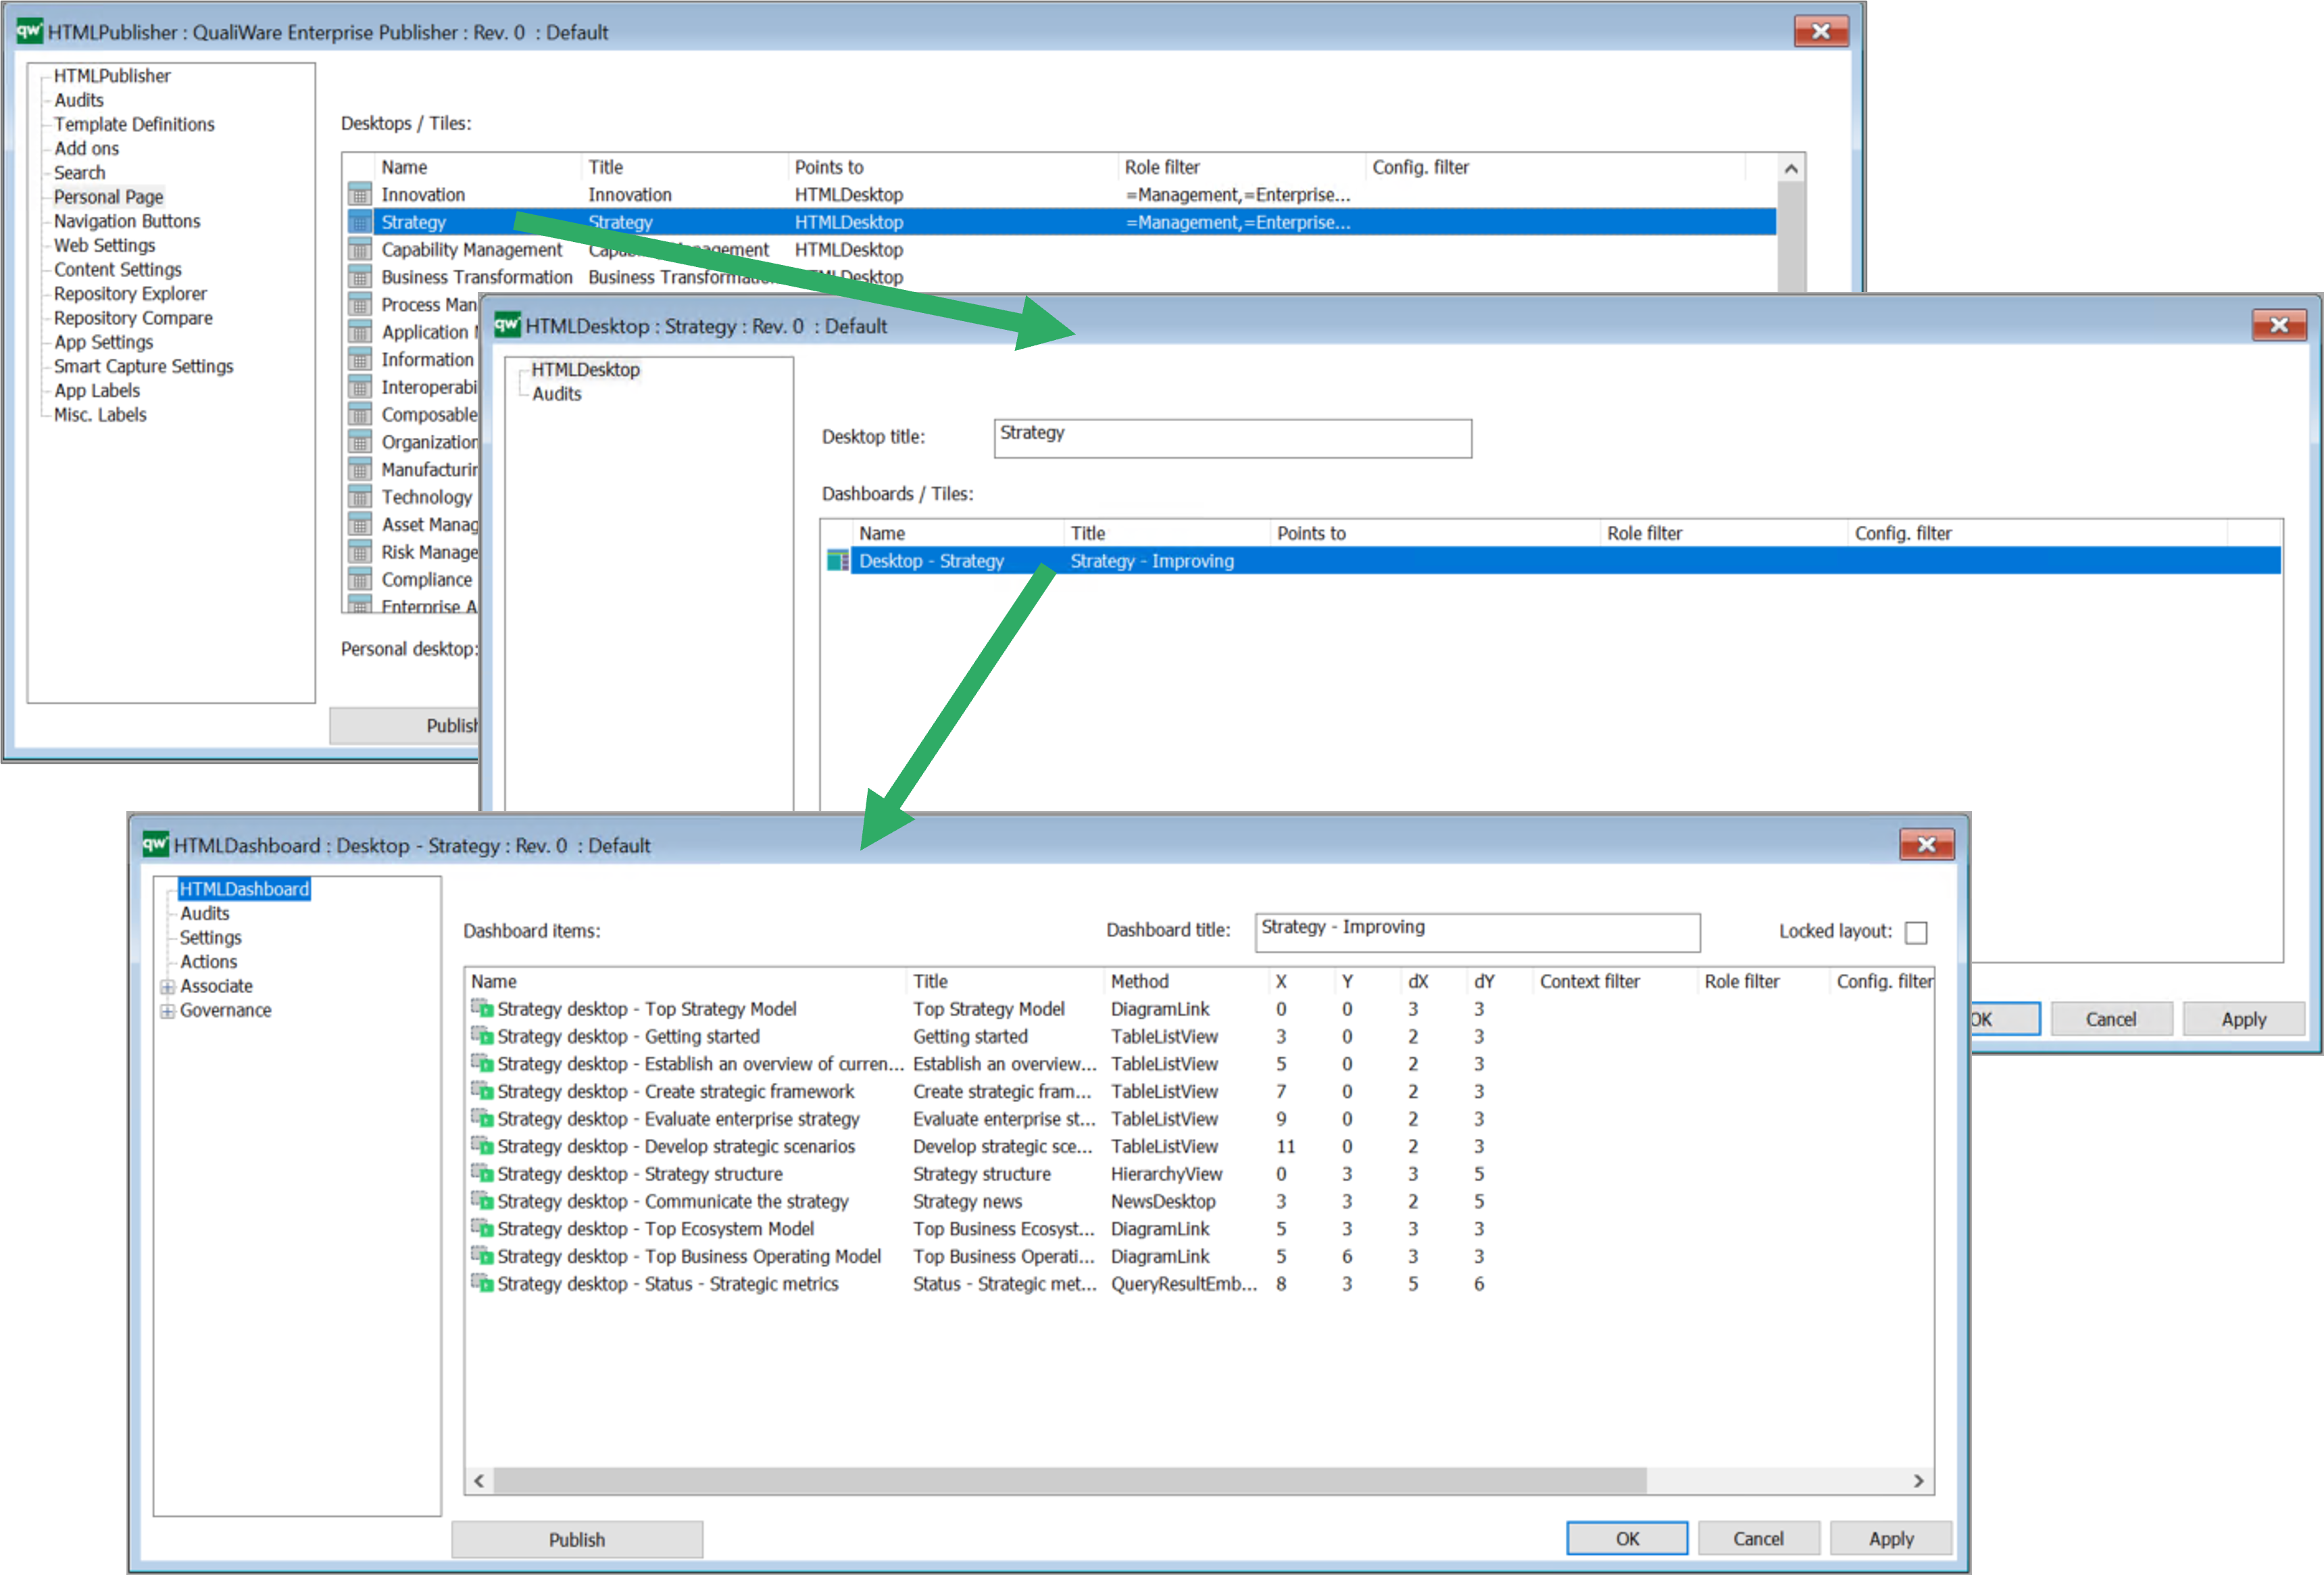
The list of Dashboard Items on the Dashboard contains the following coloums:
- Name: The name of the HTMLDashboardItem
- Title: The title as defined in the HTMLDashboardItem
- Method: The Method used in the HTMLDashboardItem
- Position X and Position Y: the position of the item on the dashboard (0,0) is in the top left corner of the dashboard. As default the dashboard contains 12 coloumns (this can be modified on the Settings tab on the HTMLDashboard)
- Size dX, dY: Width and Height of the dashboard item
The settings above are derived from the HTMLDashboardItem (hence you should open each of the items to change the settings).
It is possible to set up filters and optimal parameters for each of the items. These settings are configured directly in the HTMLDashboard.
- Context filter: possibility to set a context filter for when the dashboard item should be available (see context dependency)
- E.g. the filter “CurrSel->Template=BusinessProcess” will only make the Dashboard Item available when a symbol of the template type “BusinessProcess” is selected in the dashboard.
- If the filter is set to “False“, it will simply hide the Item from the Published Dashboard, this is a simple way to hide items and keep them in the configuration
- Role filer: possibility to set a filter for which role(s) the dashboard item should be available (see more about roles here)
- Configuration filter: filter for what configuration the dashboard item should be available
- Optional parameters: Specify optional position and size for the item. It is possible to reuse the dashboarditems in multiple dashboards, and if there is a need for optional parameters they can be specified here (default parameters are defined in the DashboardItem, and shown in the (X, Y, dX, dY)).
Example with context, role and configuration filters:
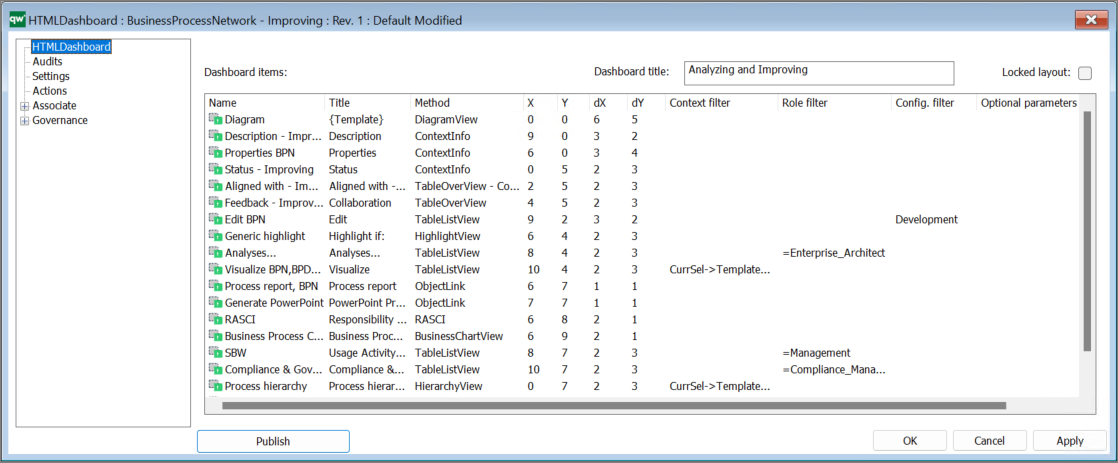
Diagram Dashboards (QualiWare 10.8)
The Dashboard is setup up through a HTMLTemplateDefinition’s Dashboard tab:
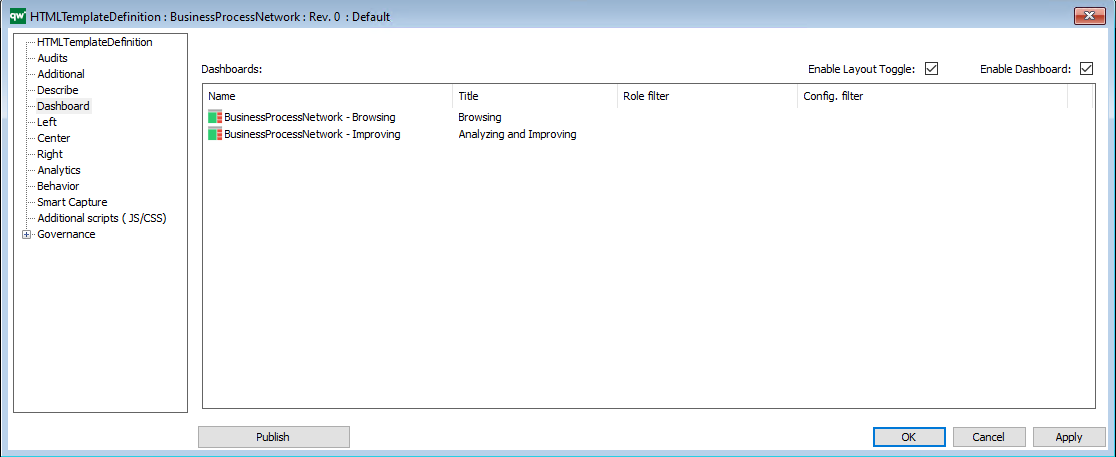
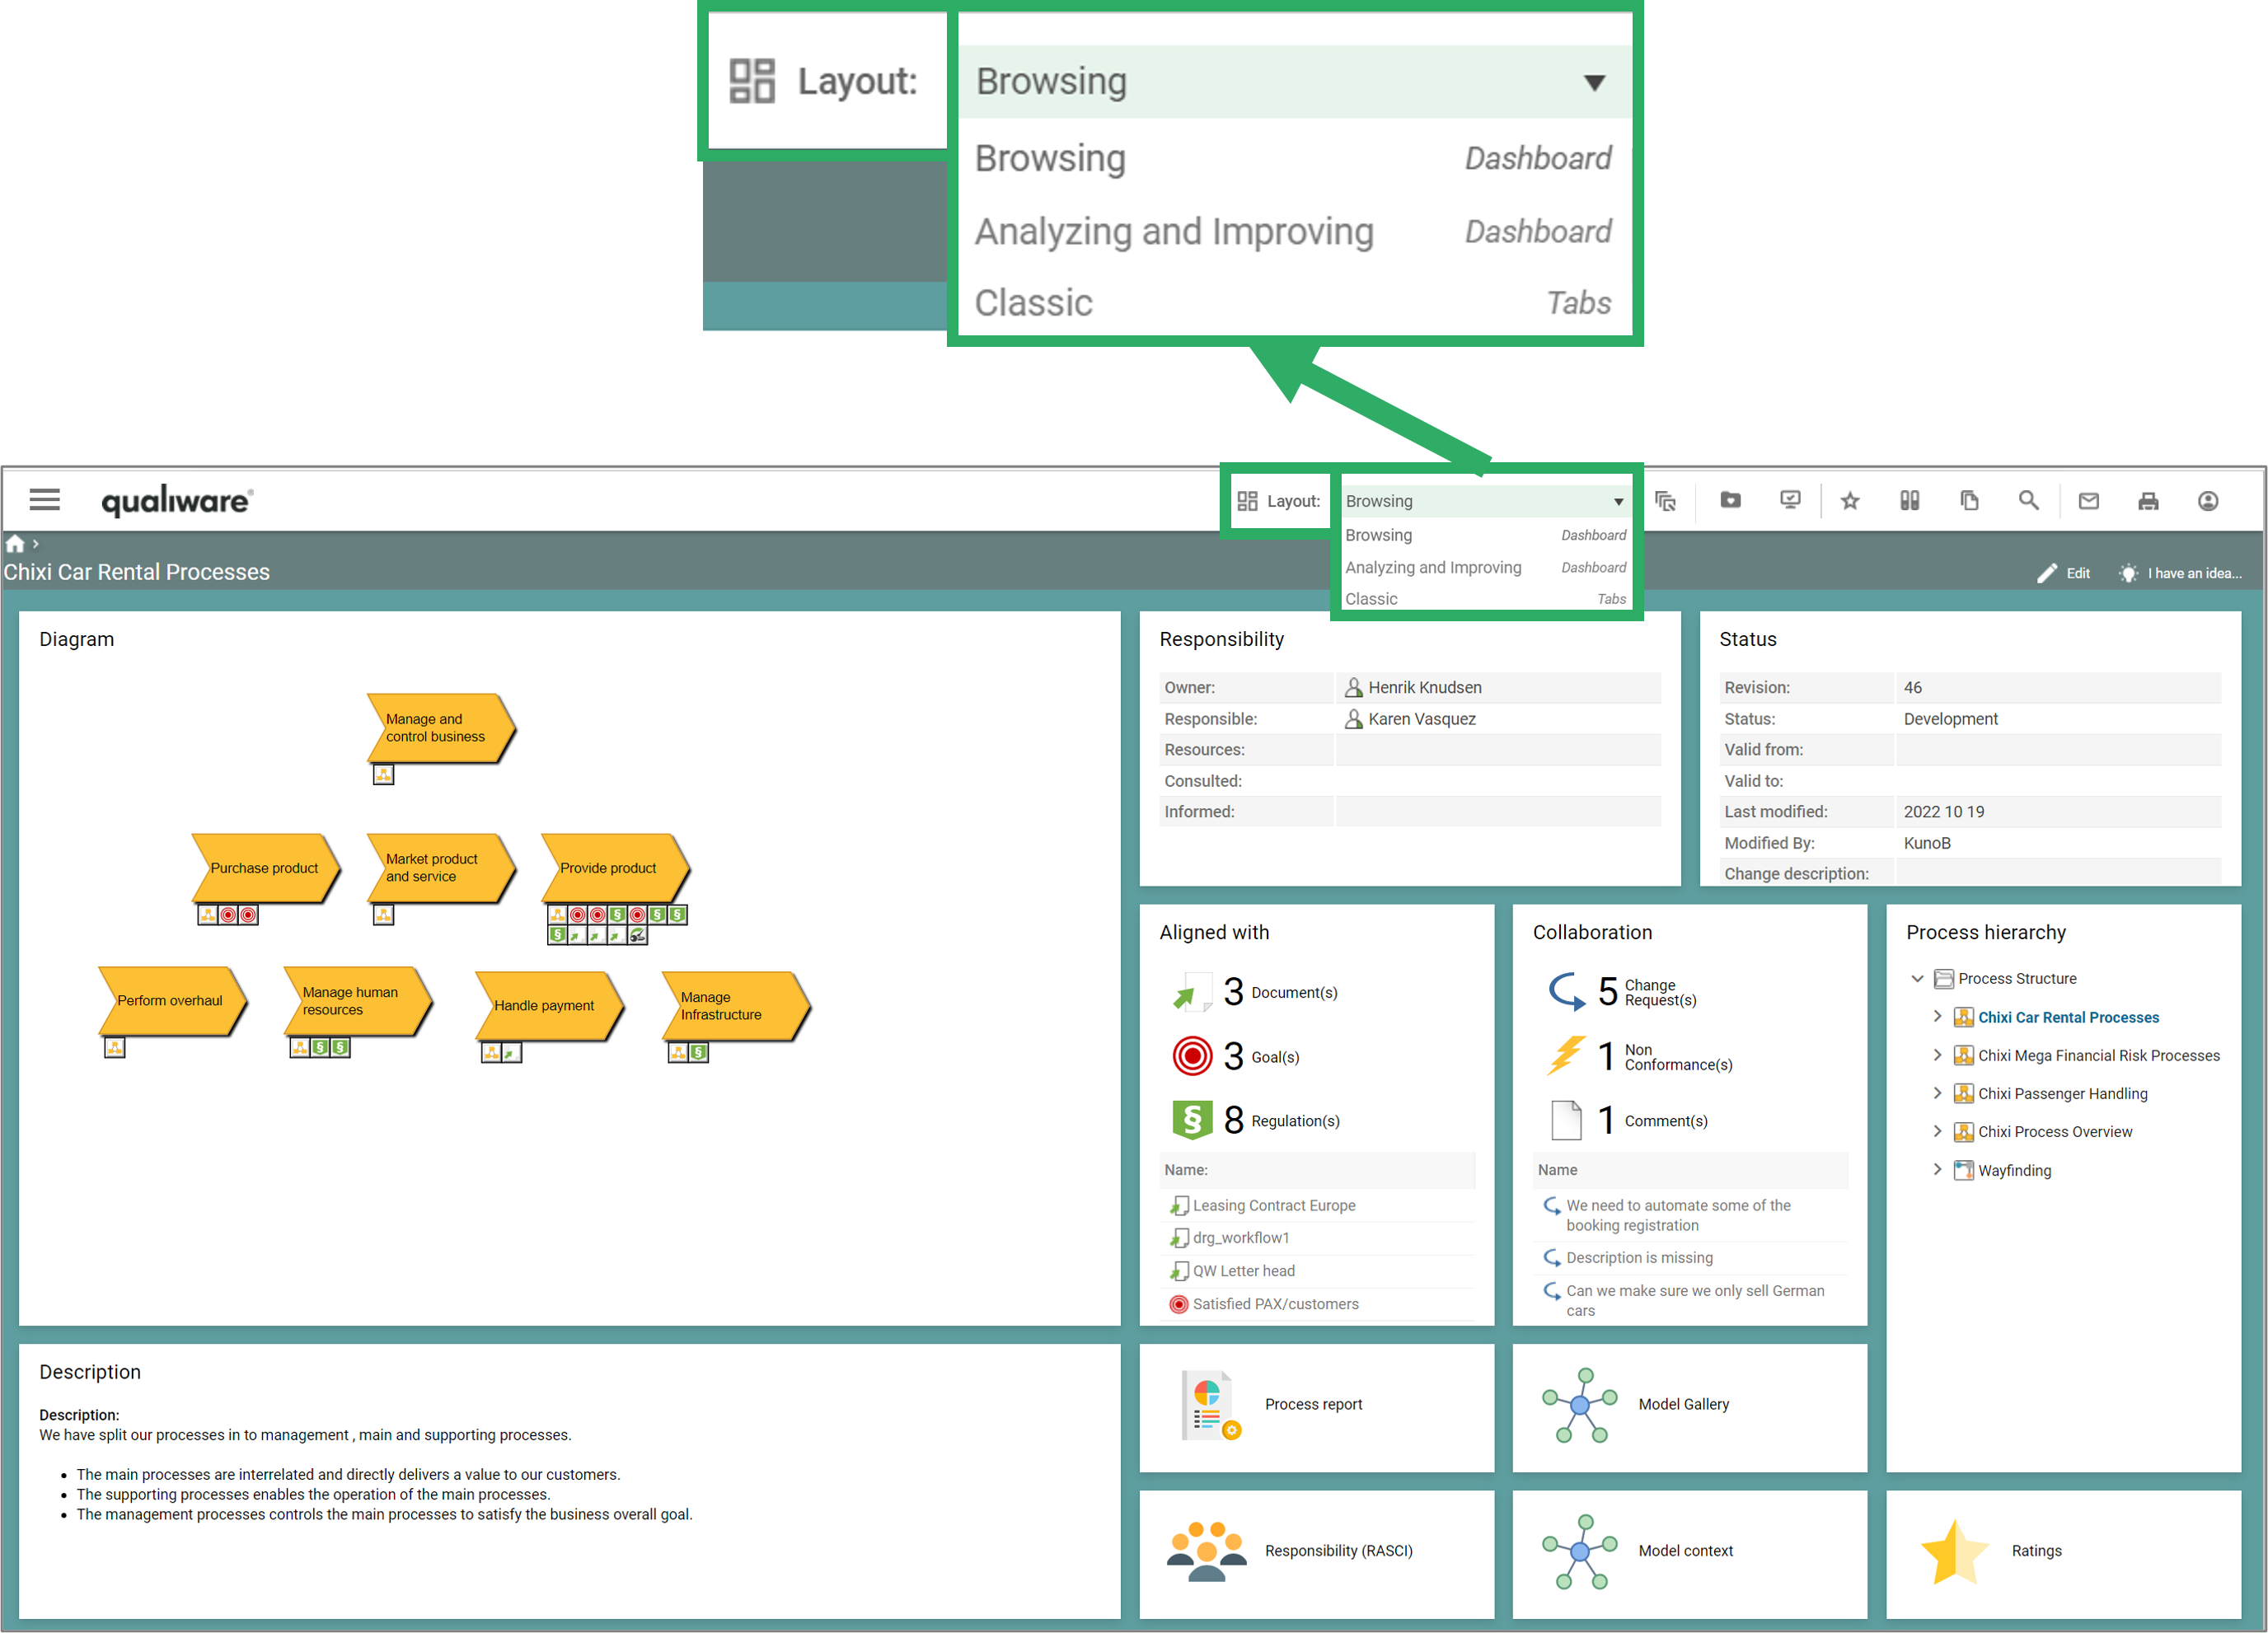
It is possible to have multiple Dashboards. In this case they will appear in the selection in the web:
Dashboard used for Desktops (QualiWare 10.10)
The Dashboard template is from QualiWare 10.10.used to setup up the Desktops on the collaboration platform. The Dashboards are linked from the HTMLPublisher (on the Personal Page tab) through a HTMLDesktop to one or multiple Dashboards.
Configuration of Dashboards
The Dashboard Setting tab contains the setting following table:
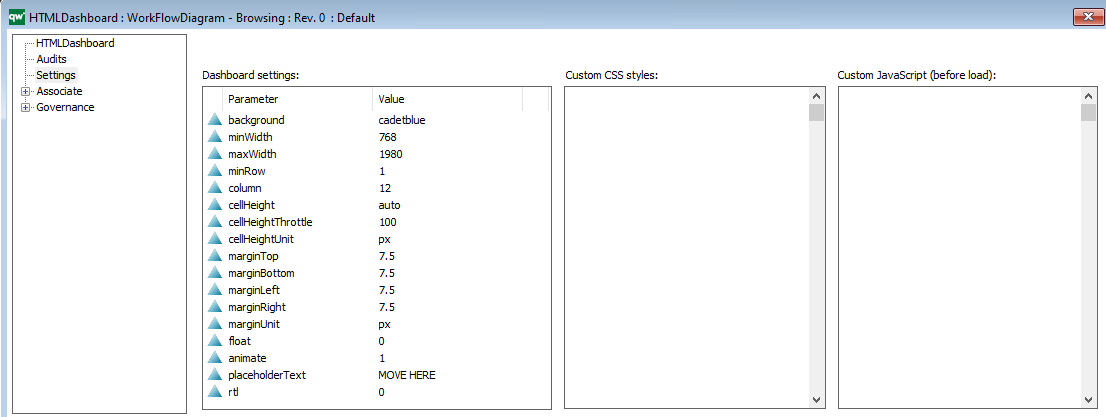
Background: You can insert any HTML color, HEX or RGB. This field behaves like color in CSS.
Examples: rgb(204, 255, 229) #E5FFCC PaleGreen
minWidth and maxWidth: The dimensions of the dashboard.
minRow and column: minimum rows amount and columns
cellHeight and CellHeightThrottle: cellHeight- one cell height (default?: ‘auto’). Can be:
- an integer (px) Example: 20
- px, em, rem (ex: ‘100px’, ’10em’, ’10rem’)
- auto – height will be calculated for square cells (width / column) and updated live as you resize the window
- initial – similar to ‘auto’ (start at square cells) but stay that size during window resizing.
CellHeightThrottle: throttle time delay (in ms) used when cellHeight=’auto’ to improve performance vs usability (default?: 100).
marginTop, marginBottom, marginLeft, marginRight and marginUnit:
The margins can be set with integers or strings. Use marginUnit to define the unit. Example of units: “px” and “em”.
float: enable “floating” items (default: false). Enabling this allow items to be anywhere on the page.
When true:
When false, items “fall upwards” and stack:
animate: turns animation on to smooth transitions (default: true). This is used when editing the layout when items swap places.
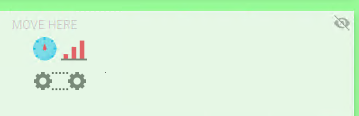
placeholderText: placeholder default content (default: ‘MOVE HERE’). This is shown when user is in edit mode and dragging the items:
rtl: “Right To Left”, Possible values are true, false, ‘auto’. This value has no effect.
In QualiTube, you can find videos about how to configure the Dashboards