The HTML Dashboard Item template is used in the HTML Dashboard template to configure the dashboards introduced in QualiWare 10.8 and the Desktops introduced in QualiWare 10.10
The DashboardItems can show many types of data in different ways which makes them a flexible tool.
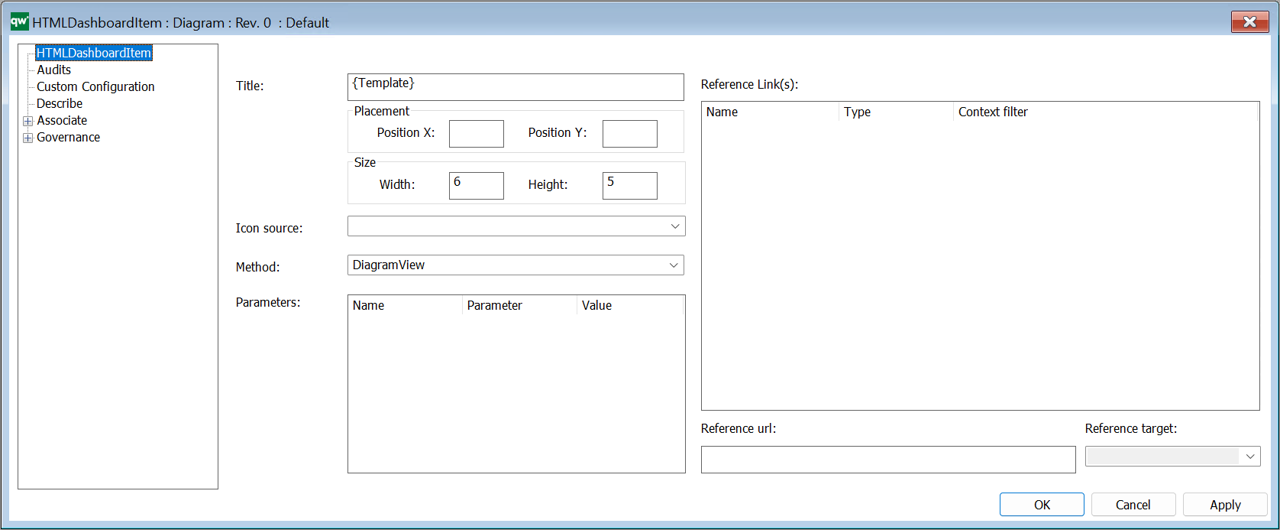
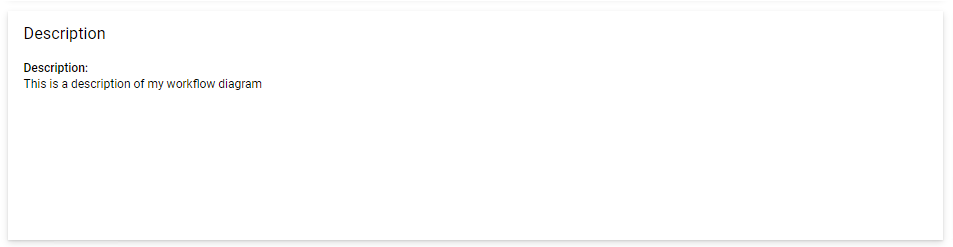
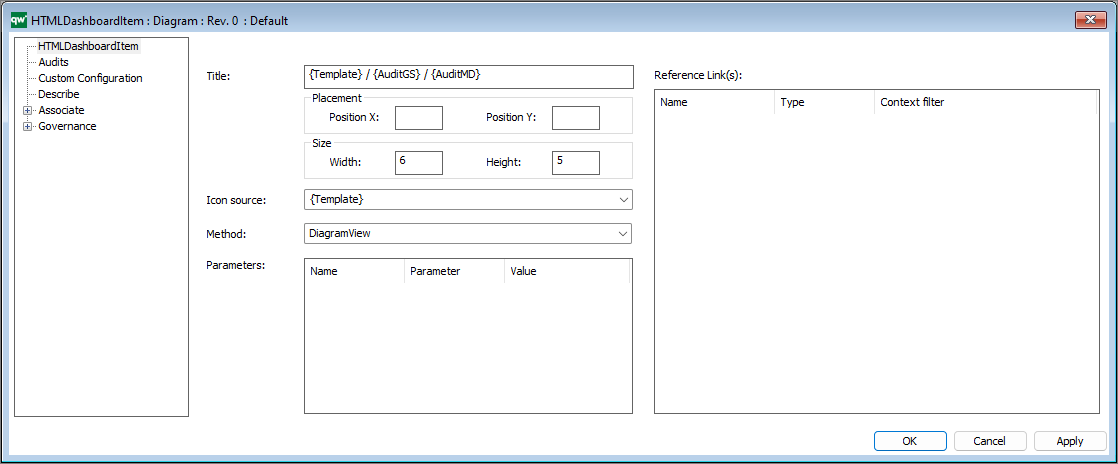
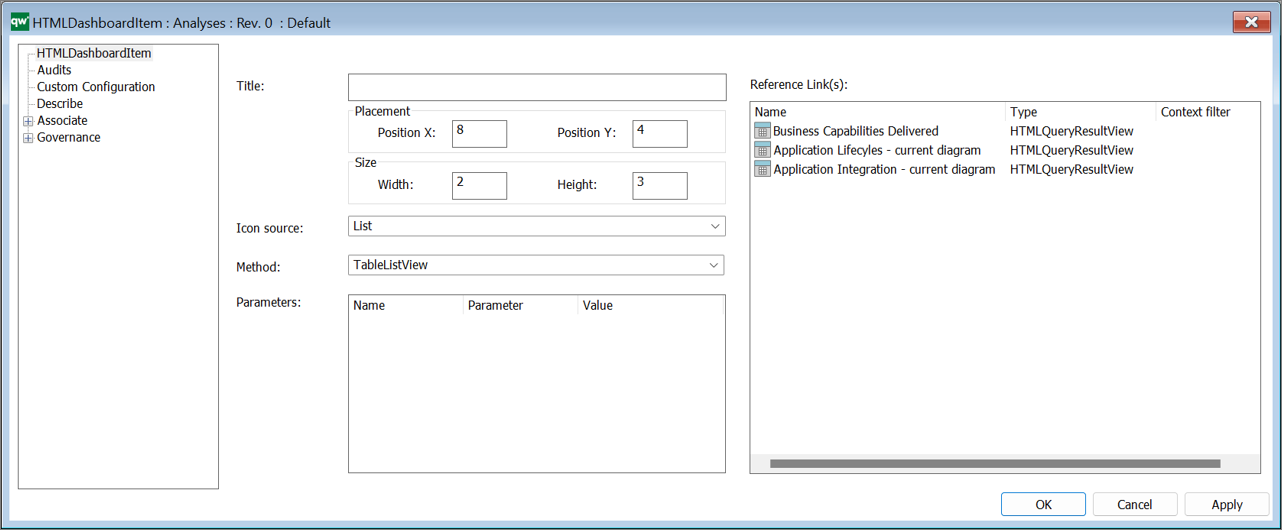
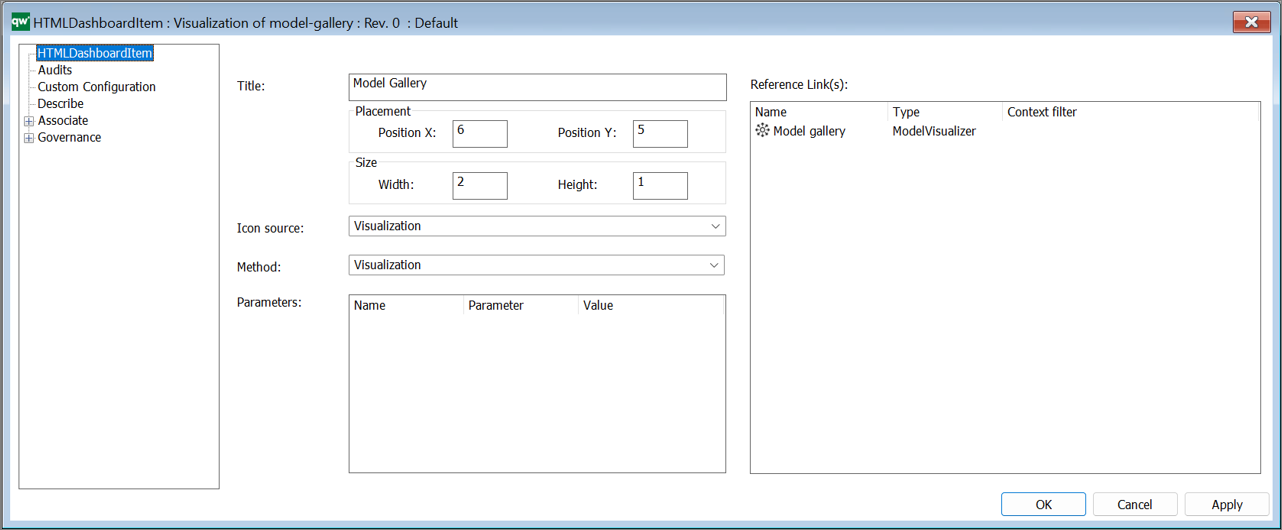
Title: The title shown on the dashboard tile. If no title in inserted the name of the HTMLDashboardItem will be shown on the web. As seen in the example above, it is possible to insert a property name in {} . In the example above the name of the Template is shown.
Placement:
- Position X and Position Y: the position of the item on the dashboard (0,0) is in the top left corner of the dashboard.
As default the dashboard contains 12 coloumns (this can be modified on the Settings tab on the HTMLDashboard)
Size:
- Width and Height: the size of the dashboard item.
Icon source:
- Select the icon to be shown on the dashborditem (see more)
Method:
- The is a comprehensive list of Methods available (see more)
Reference Link(s)
- Links associated to the DashboardItem, this is depending on the selected Method
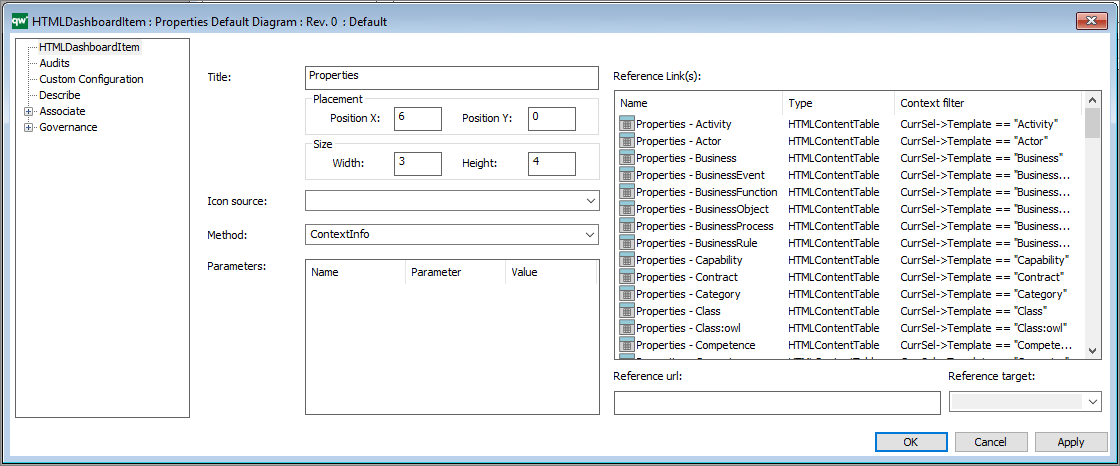
- As a part of this it is possible to set up context filters, making reference context dependent (e.g. showing spefic parameters for a specific template type).
Icon Source
The icon source attribute allows you to select from a predefined list of symbols that are available for use.
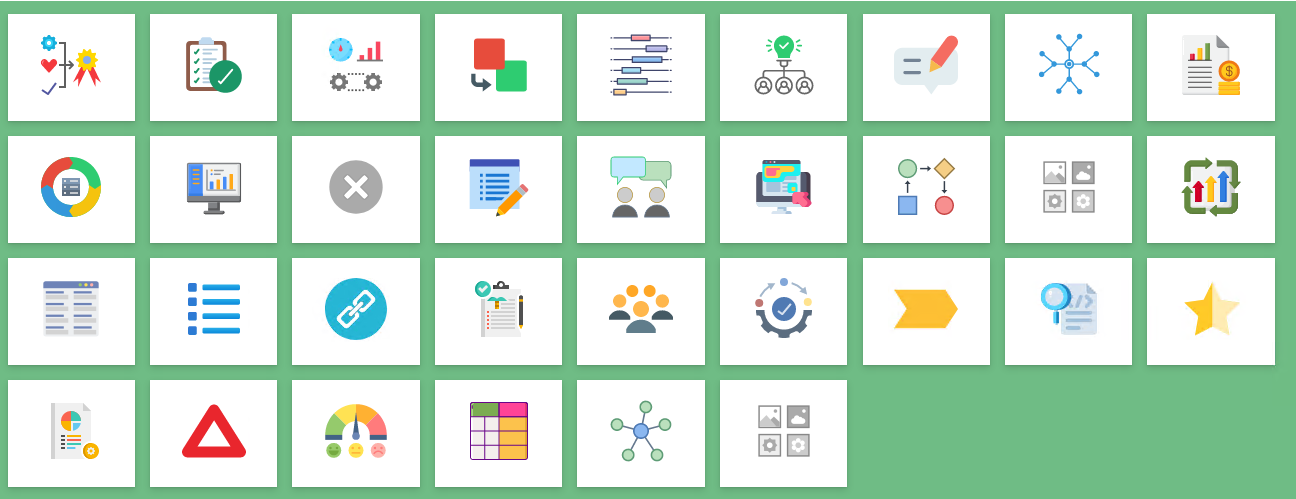
Please refer to the DashboardItem Icon Source Cheat Sheet in the Appendix (below) for the keyword mapping list. The Method attribute (combined with the Parameters and Reference Link(s) attributes) determine the behaviour of the DashboardItem.
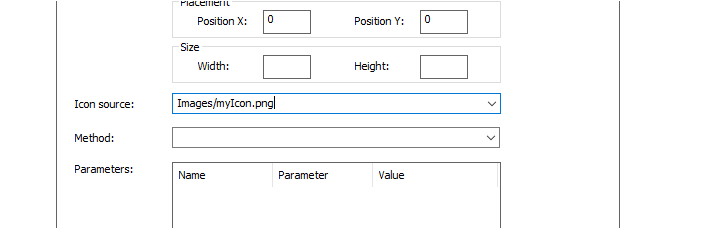
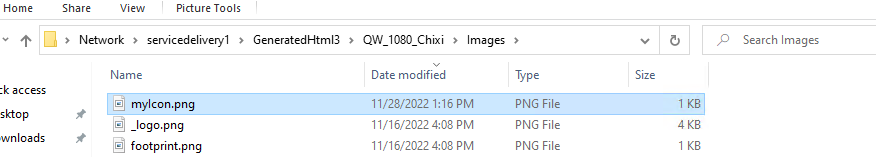
Example: Custom Image on a DashboardItem
It is possible to use a custom icon on a DashboardItem. The URL can be any image file supported by browsers and it must be fetched through HTTP/s protocol.
Put the image file in the GeneratedHTML folder in your IIS-application. In this example I have put the image into the Images-folder.
DashboardItem Methods
The DashboardItem contains a comprehensive set of different Methods that each have a dedicated behavior.
- ContextInfo
- ContextView
- ObjectAttribute
- ObjectLink
- BusinessChartView
- BusinessChartDataView (10.10)
- BusinessChartEmbedded
- BusinessChartEmbedded – Context (10.10)
- DiagramView
- DiagramLink (10.10)
- HierarchyView
- HighlightView
- NewsAll (10.10)
- NewsDesktop (10.10)
- RASCI
- Ratings
- SpreadSheetView
- QueryResultView
- QueryResultEmbedded (10.10)
- QueryResultEmbedded – Context (10.10)
- QuickSearch (10.10)
- TableListView
- TableOverView
- TableOverView – Context
- Visualization
- ExternalSource (10.10)
- GovernanceHistory
- AcknowledgeHistory

List of Methods available to HTMLDashboardItems in QualiWare 10.10
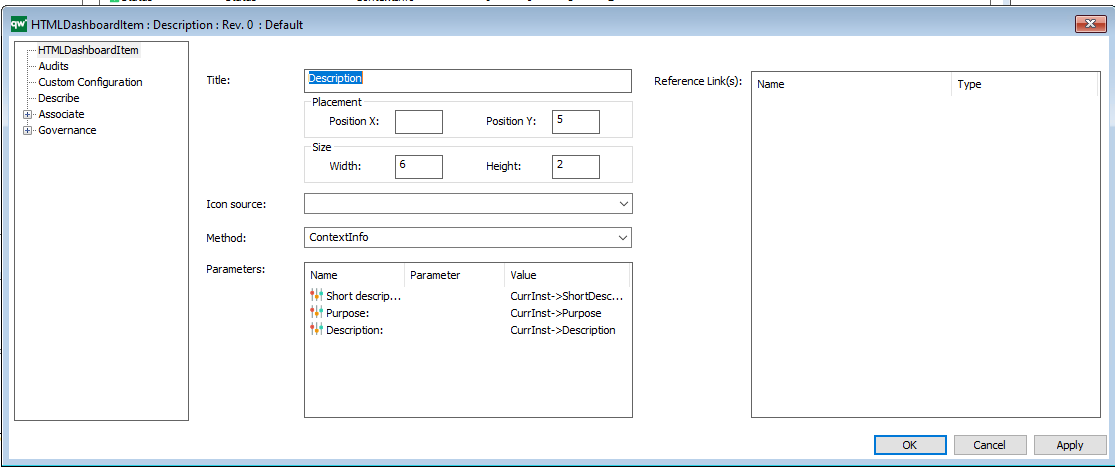
DashboardItem – ContextInfo
Using the ContexInfo-method will make the item responsive and display information about the selected object.
It is set up in the following way:
Alternatively, it is possible to display the content of an already existing HTMLContentTable:
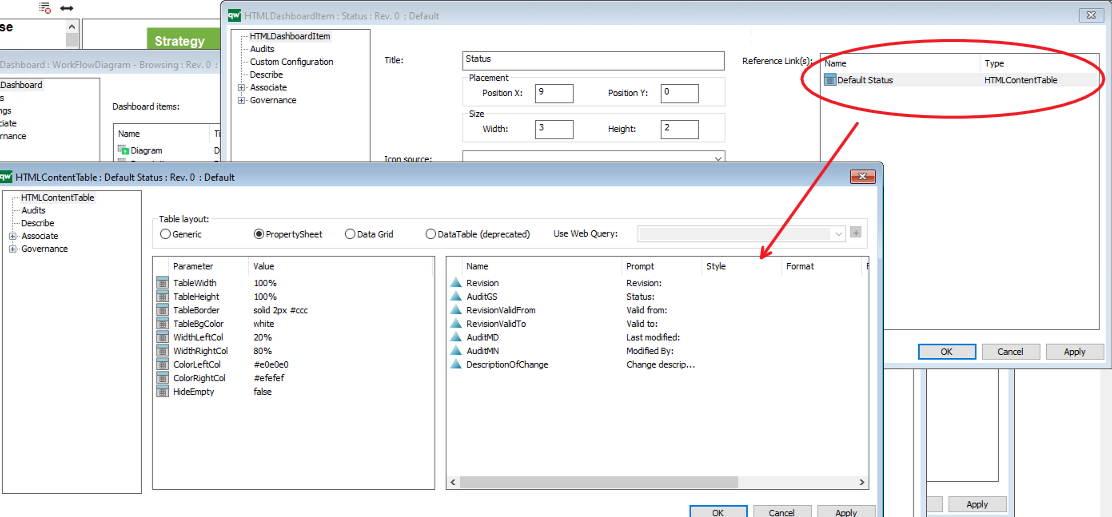
In QualiWare 10.9 context dependency was introduced, making the tile content dependent, e.g. showing relevant properties of the object type selected in the diagram view, using the “CurrSel” filter.
DashboardItem – ContextView
Shows the context view in a tile.
It is a standard method where no other configuration is needed.
DashboardItem – ObjectAttribute
Shows a set of attribute to the “main”object in the dashboard, e.g. the diagram in a diagram dashboard.
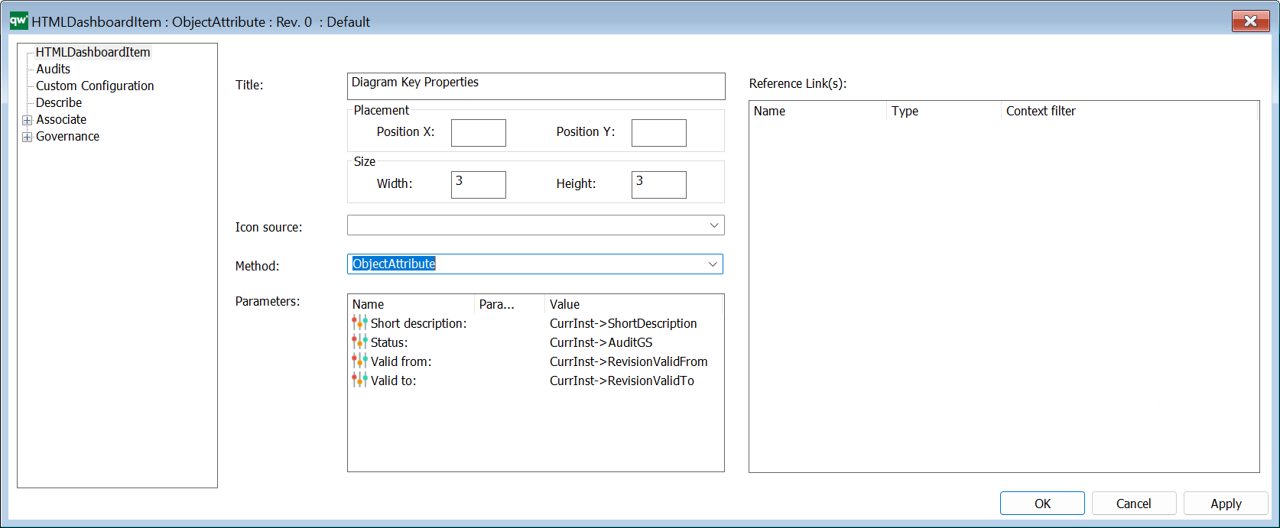
Thus, compared to the ContextInfo method this item is not responsive/dependent upon what is selected in the diagram.
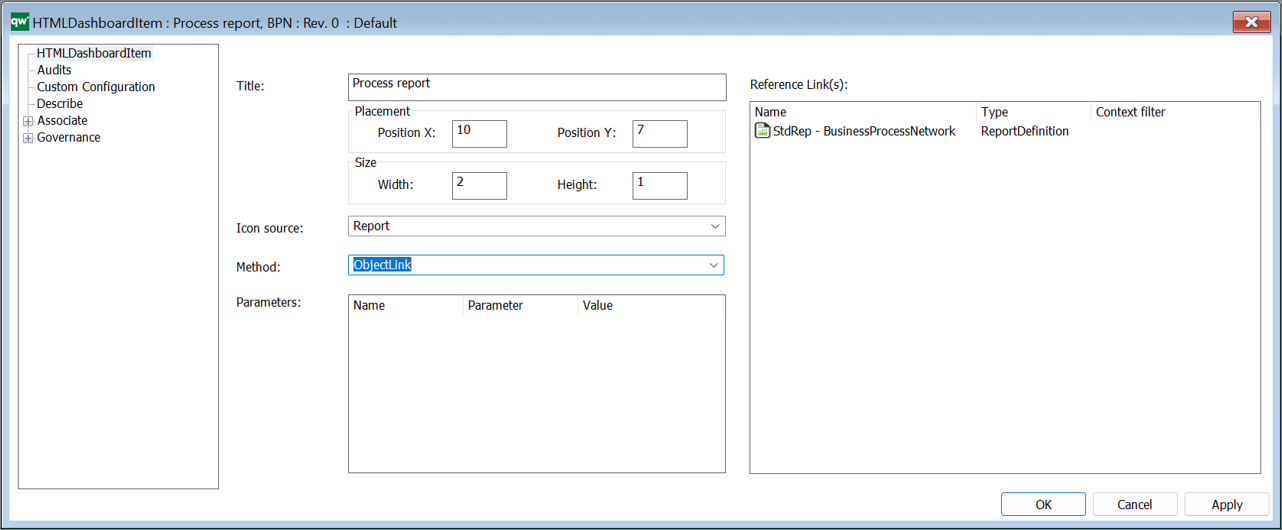
DashboardItem – ObjectLink
Using the ObjectLink will open the object directly.
Example of using the ObjectLink-method to open a report:
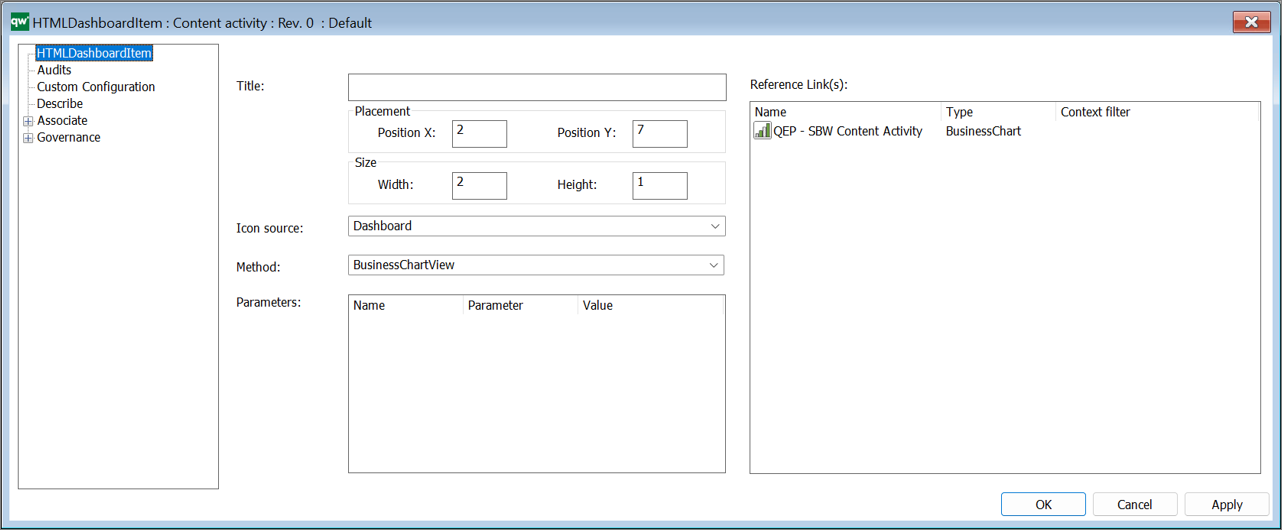
DashboardItem – BusinessChartView
This method is used to insert a dashboard item to link to e.g. a BusinessChart
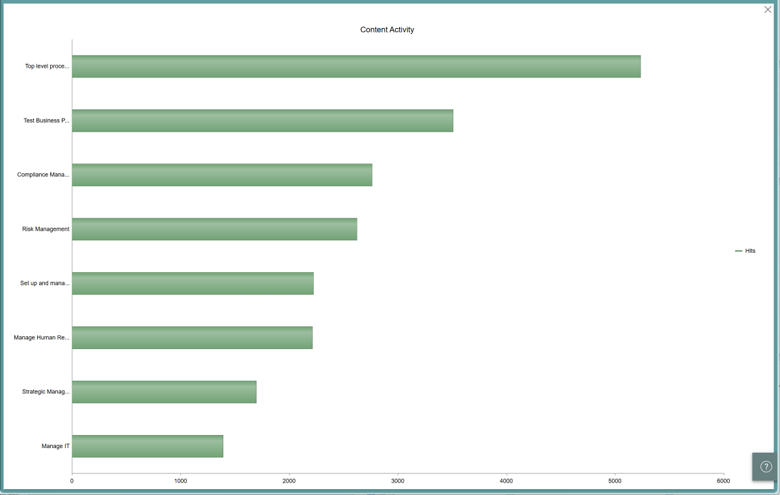
You insert the BusinessChart under Reference links.
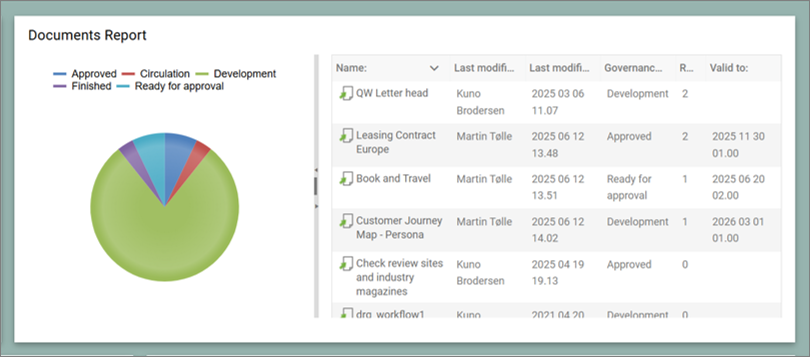
DashboardItem – BusinessChartDataView (10.10)
This method is new in QualiWare 10.10 and shows a businesschart side-by-side to a query, and when a selection is made on the businesschart, the query updates and lists the objects “behind” the selected part on the businesschart.
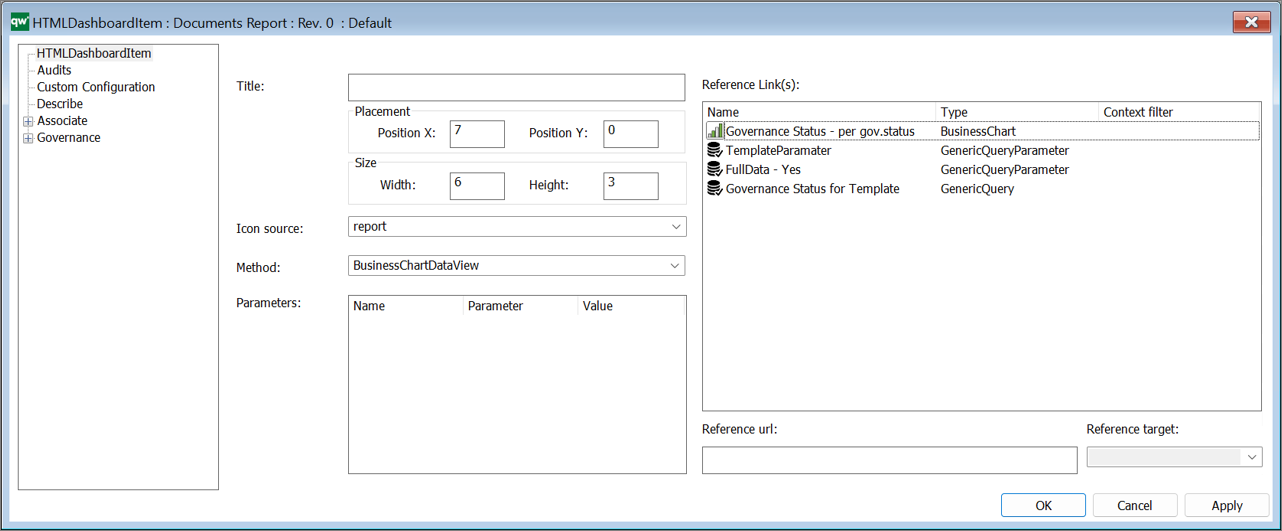
The filtering uses a “Client side event handler” for seriesClick in the BusinessChart. In the BusinessChart you specify the Handler, e.g. “OnGovernanceStatusSeriesClick”.
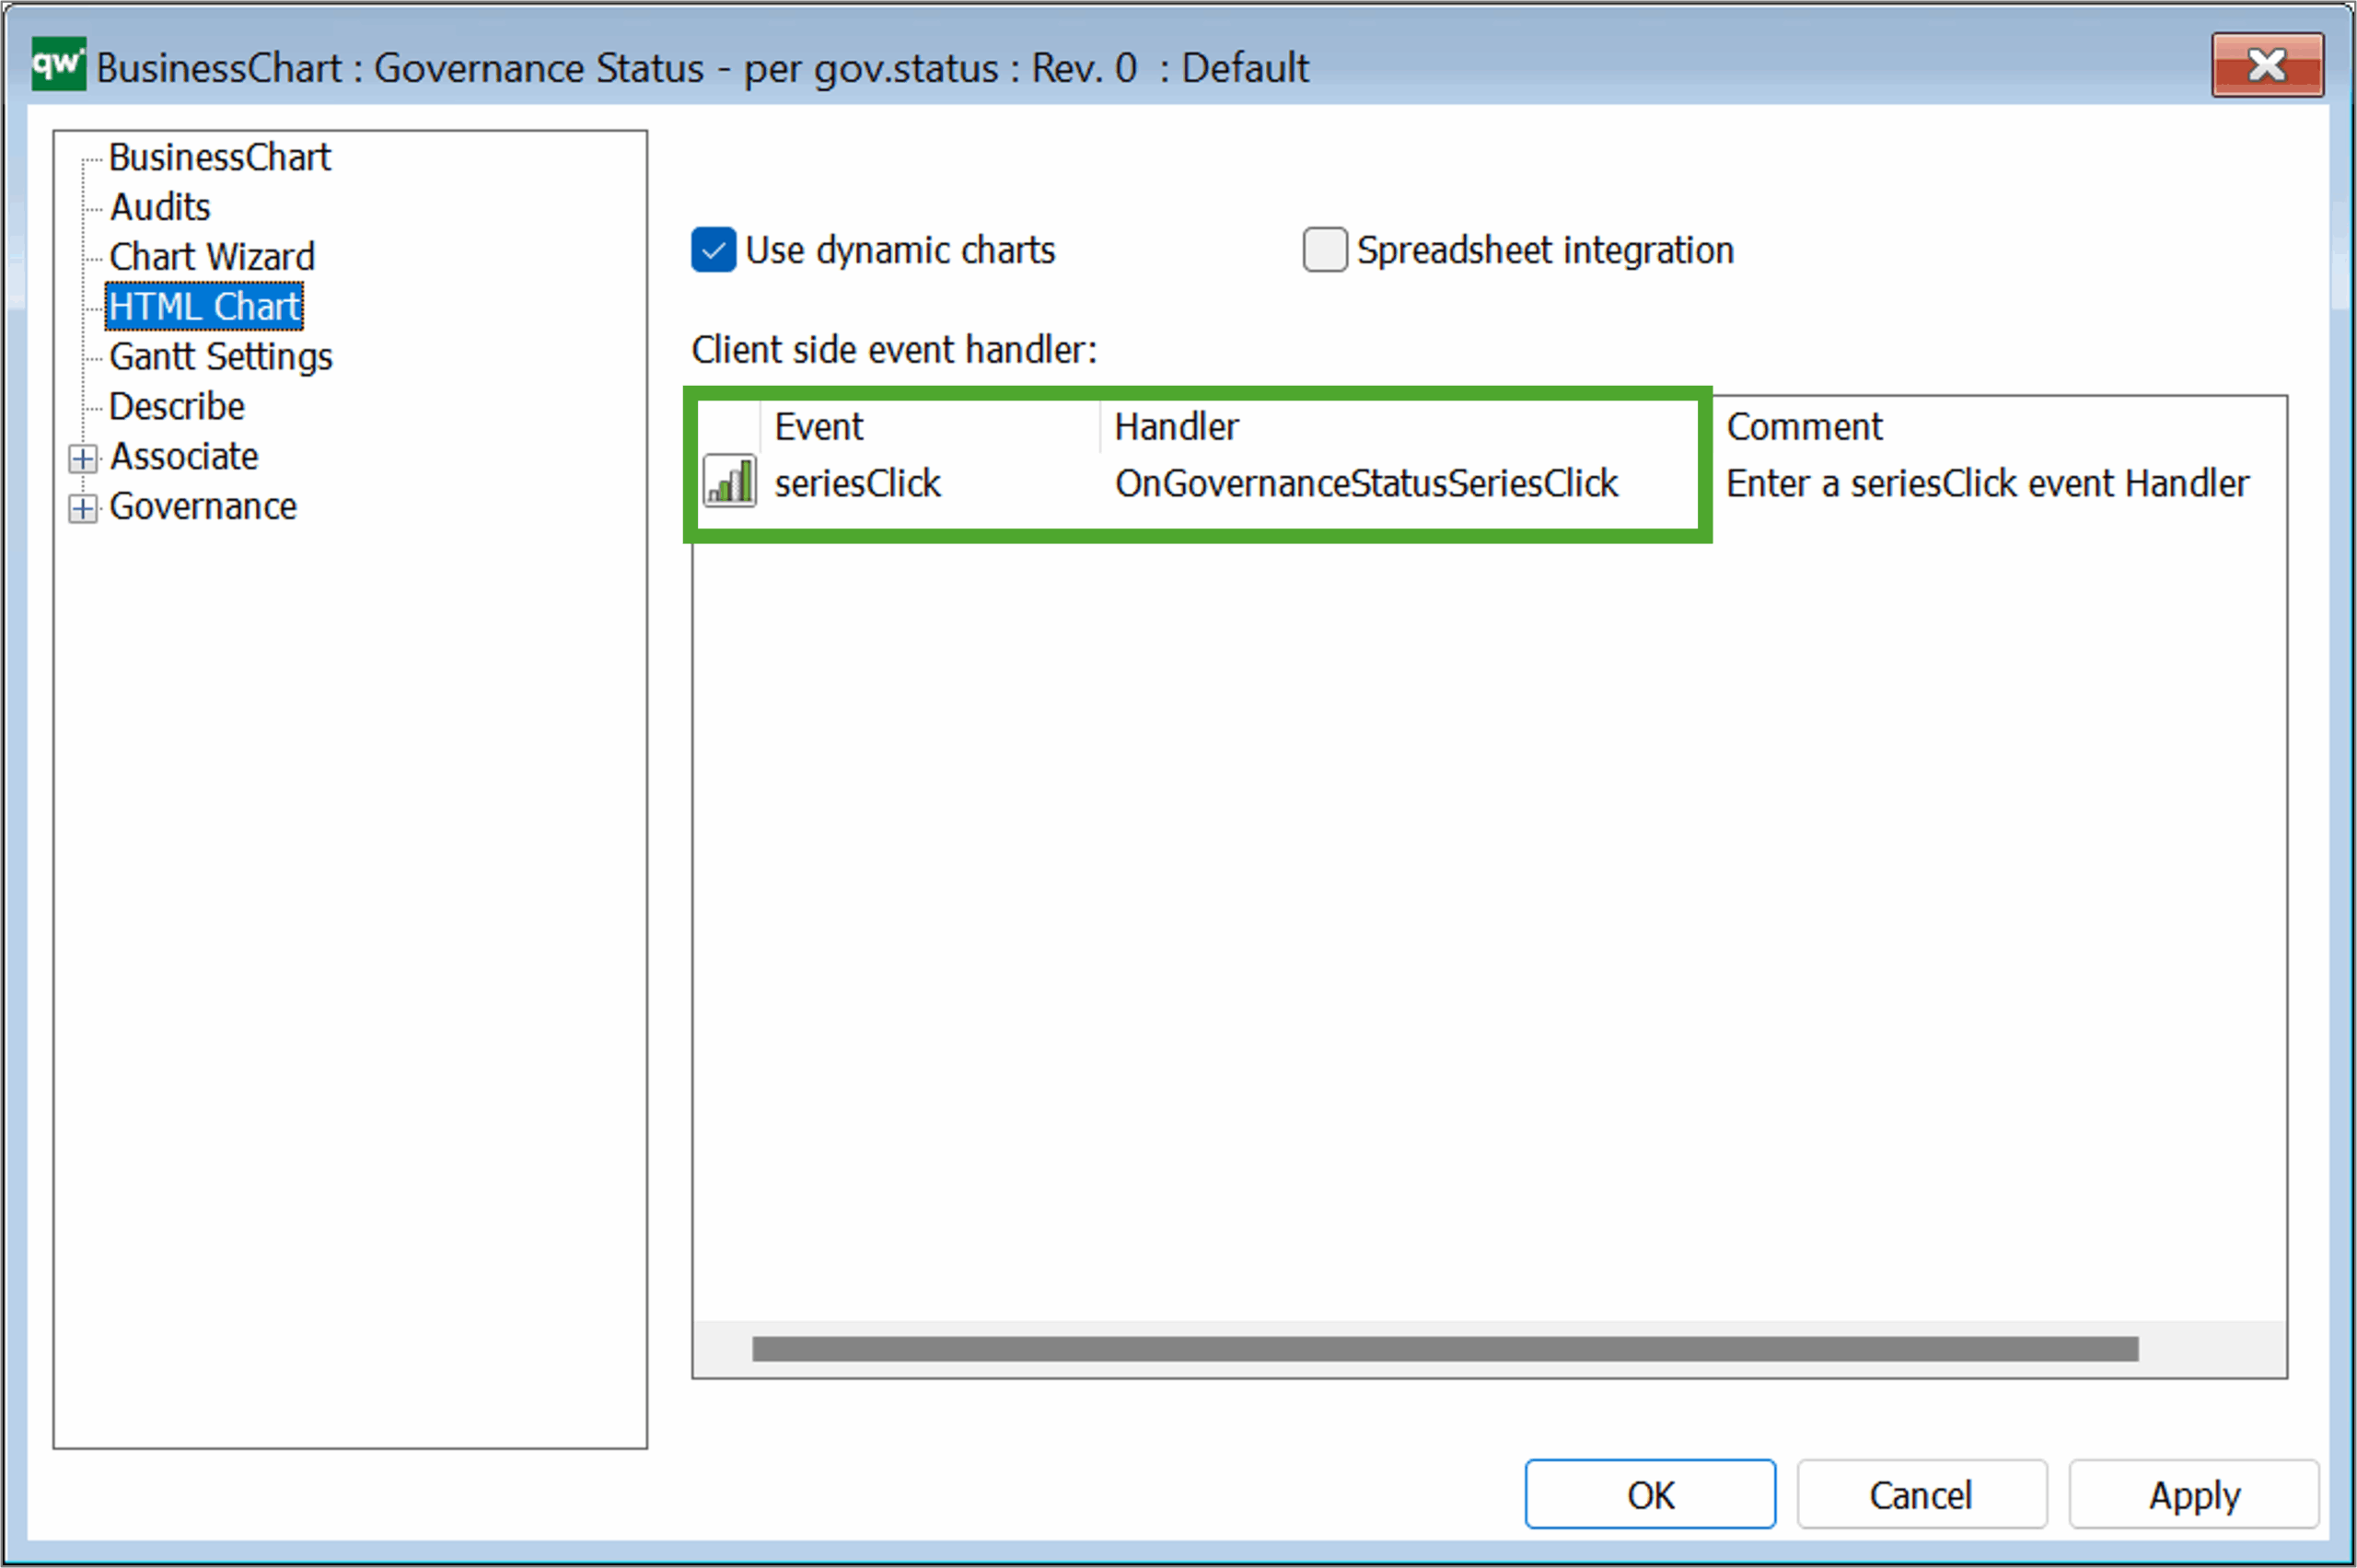
The handler function then has to be linked to the function:
function(sel){$.filterChartDataByValue(sel, ‘[FilterParameter]’)}
where the FilterParameter should match the relevant column attribute in the GenericQuery.
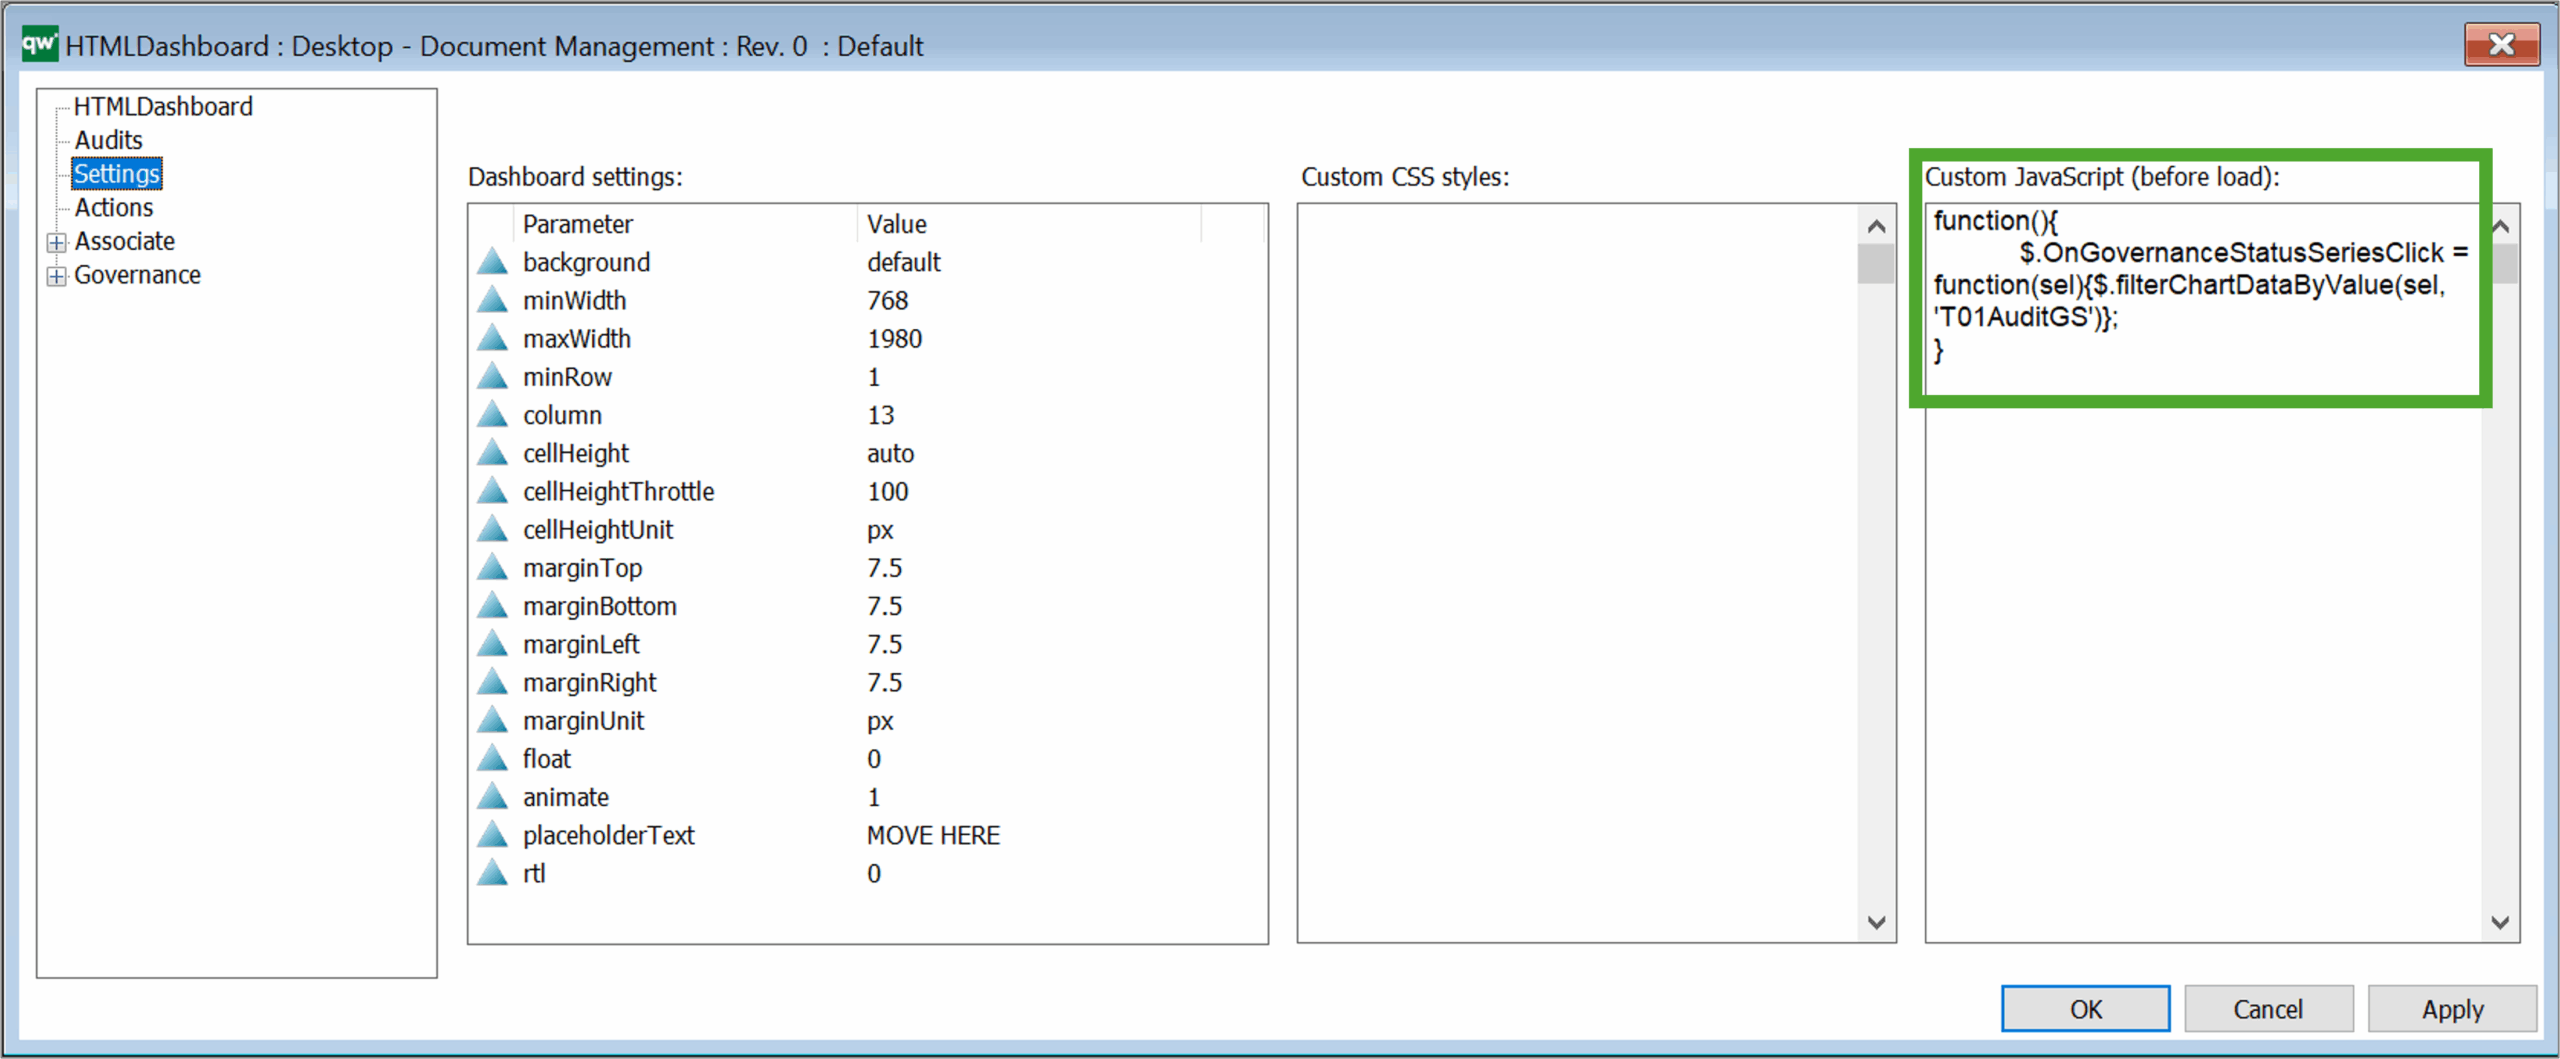
The full script will look like this:
The script should be inserted under Settings in the relevant Dashboard.
It is possible to insert multiple functions to a dashboard, by seperating each of them with “;”, see example:
The dashboarditem is used in the new Document Management Desktop and Contract Management Desktop.
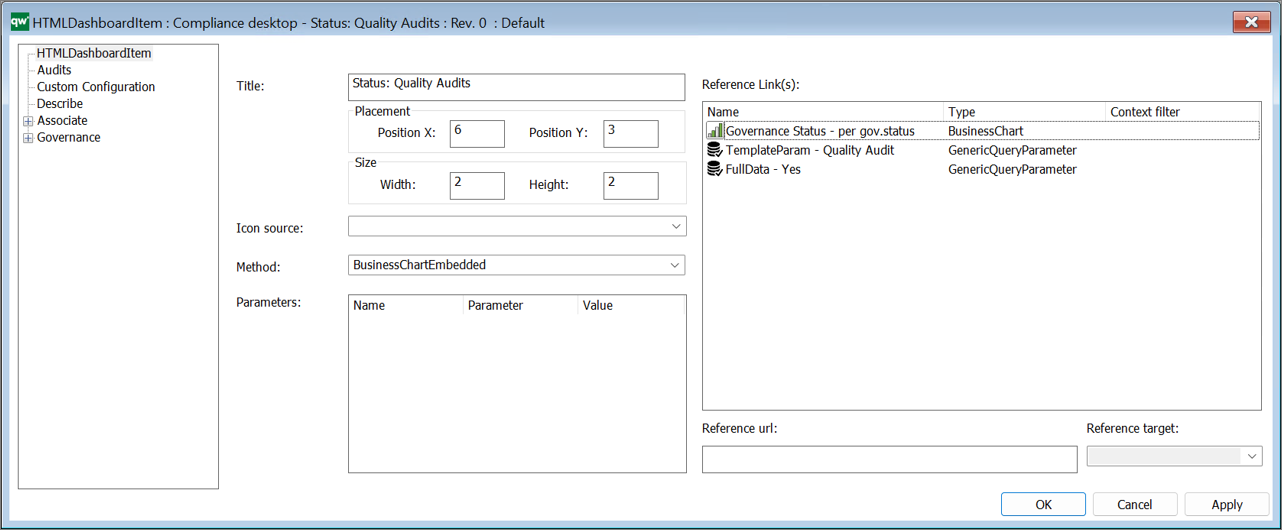
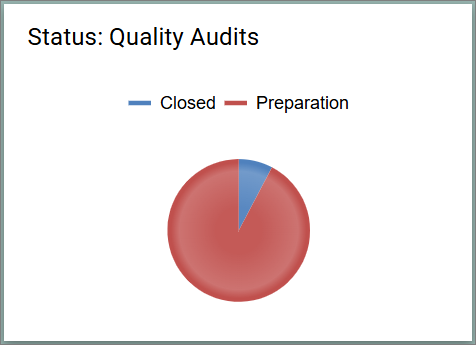
DashboardItem – BusinessChartEmbedded
This method shows a businesschart in a dashboard tile.
DashboardItem – BusinessChartEmbedded – Context (10.10)
This method shows a businesschart in a dashboard tile.
This method is context dependent, i.e. the businesschart is updated based upon what is selected (responsive).
DashboardItem – DiagramView
This method shows the diagram in the tile and is used as default on the different diagram dashboards.
In this method the different object on the diagram are selectable (to support responsiveness, and show details of the selected object on the diagram).
DashboardItem – DiagramLink (10.10)
This method shows the referenced diagram in the tile and is used default on top diagrams in the desktops introduced in QualiWare 10.10.
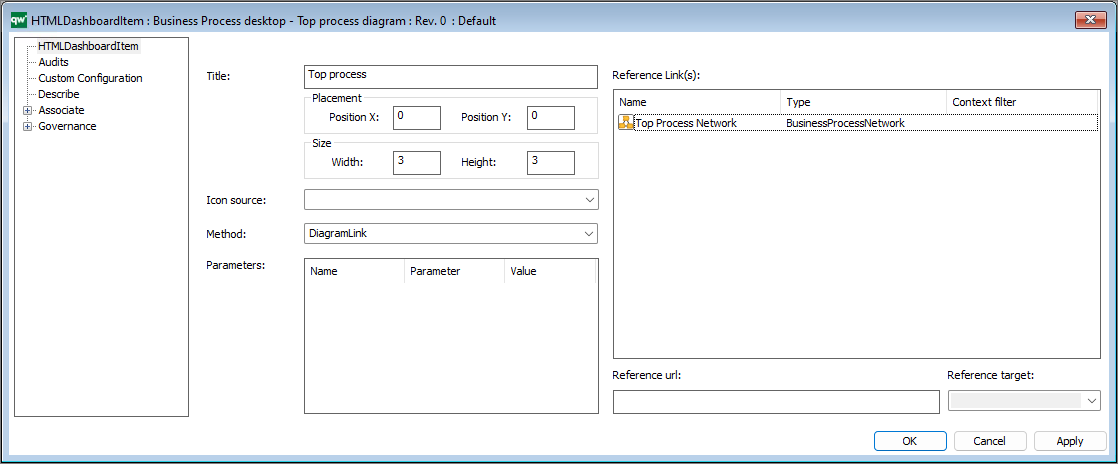
In this method the whole diagram works as a link, and will when clicked shown the diagram in the dashboard view (i.e. the different objects in the diagram are not selectable, to get this functionality you should use DiagramView.)
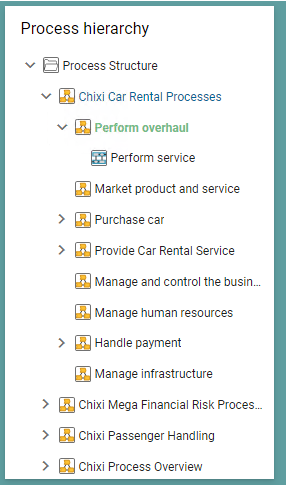
DashboardItem – HierarchyView
The HierarchyView-method will show the Hierarchy based on the HierarchyView-object in the Reference Link(s).
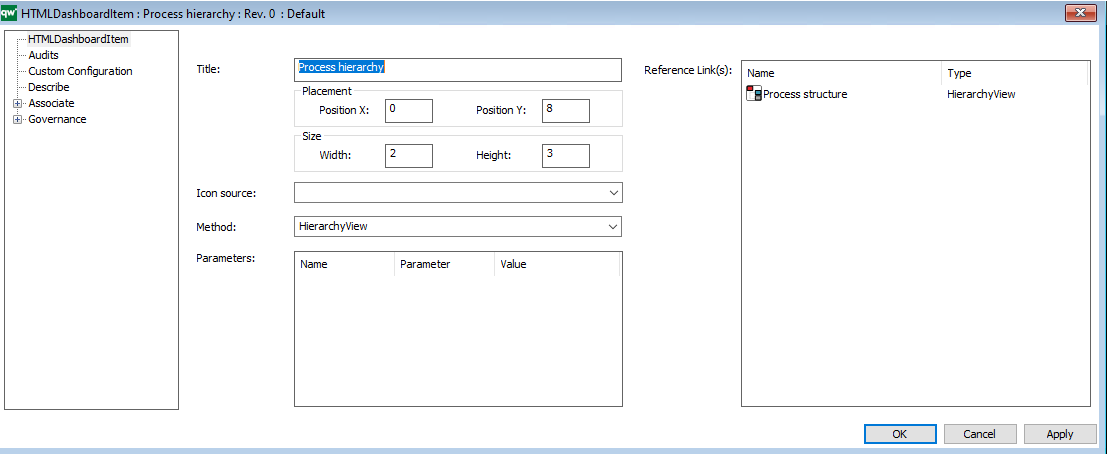
Example:
It is not possible to configure the HierarchyViews presentation on the DashboardItem.
DashboardItem – HighlightView
The HighlightView-method is used to highlight object based upon a query.
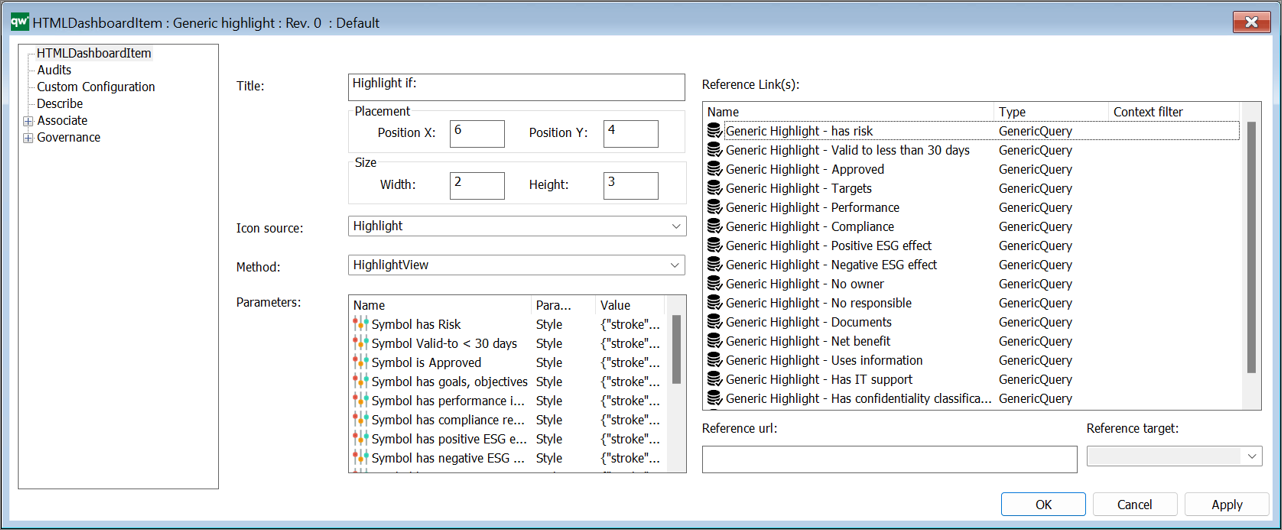
As seen above it is possible to have multiple highlight parameters in the item, it is important that the sequence of the queries listed under reference link(s) corresponds to the same sequence of the parameters. Each of the parameters are configured using HTMLParameters.
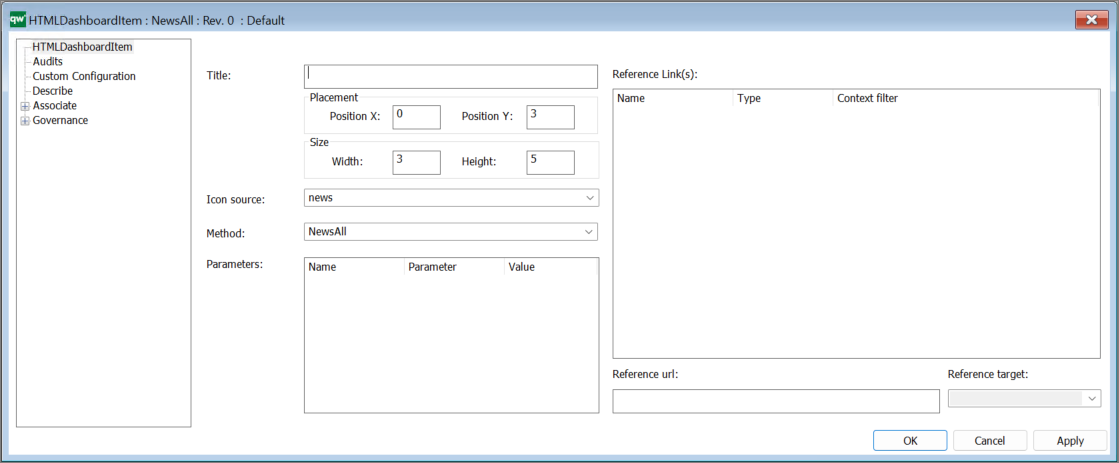
DashboardItem – NewsAll (10.10)
This method list all current newsitem in the repository, i.e. all wher the current date is between the release data and archive date specified on the NewsItem.
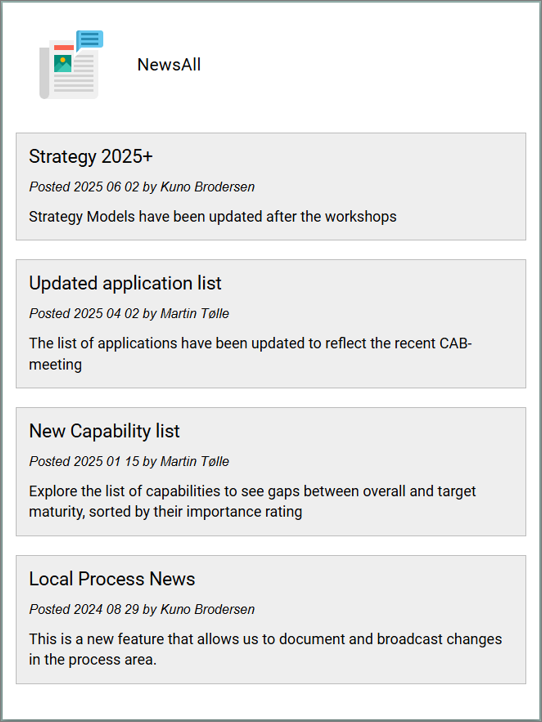
This method is similar to the NewsDesktop method, showing all news items and not only the subset related to a specific desktop.
DashboardItem – NewsDesktop (10.10)
This method list all current newsitem that are related to the specific desktop and where the current date is between the release data and archive date specified on the NewsItem. It is used on the desktops.
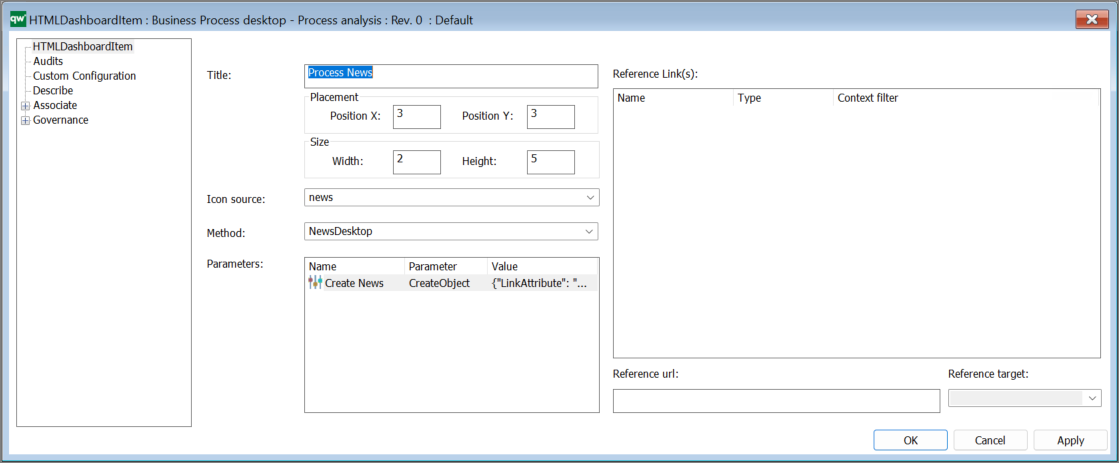
The parameters enable the user to create news related to the desktop.
DashboardItem – RASCI
This method shows a standard RASCI responsibility matrix derived from the digram and symbols on the diagram.
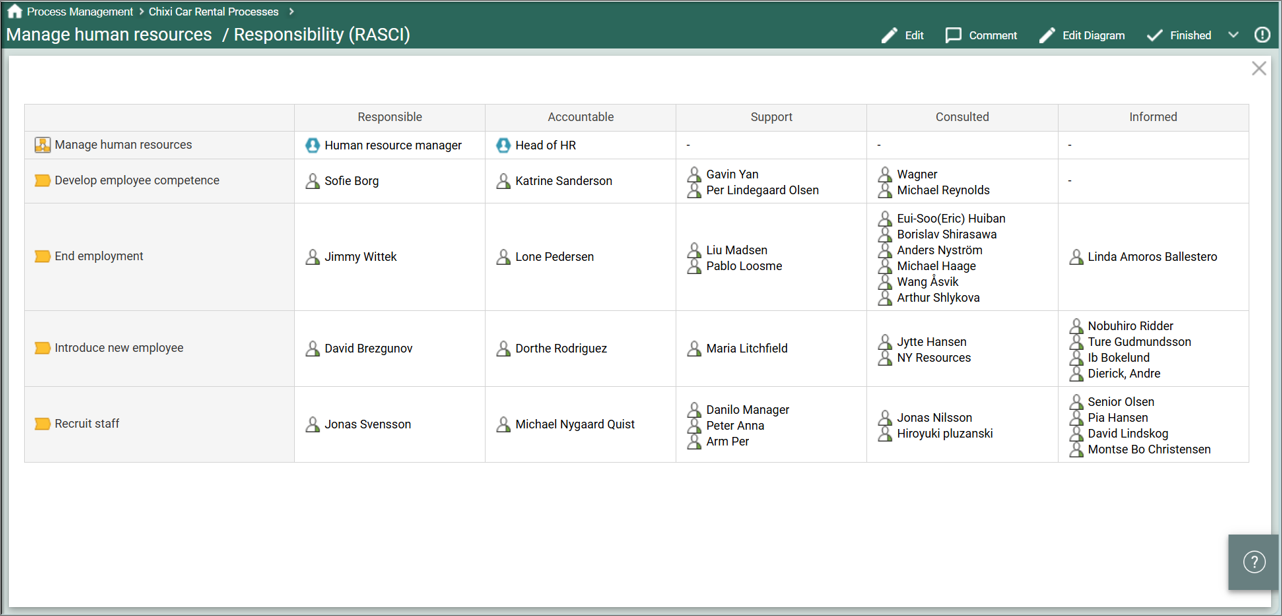
RASCI is a standard method where no other configuration is needed.
DashboardItem – Ratings
This method shows the ratings of the content.
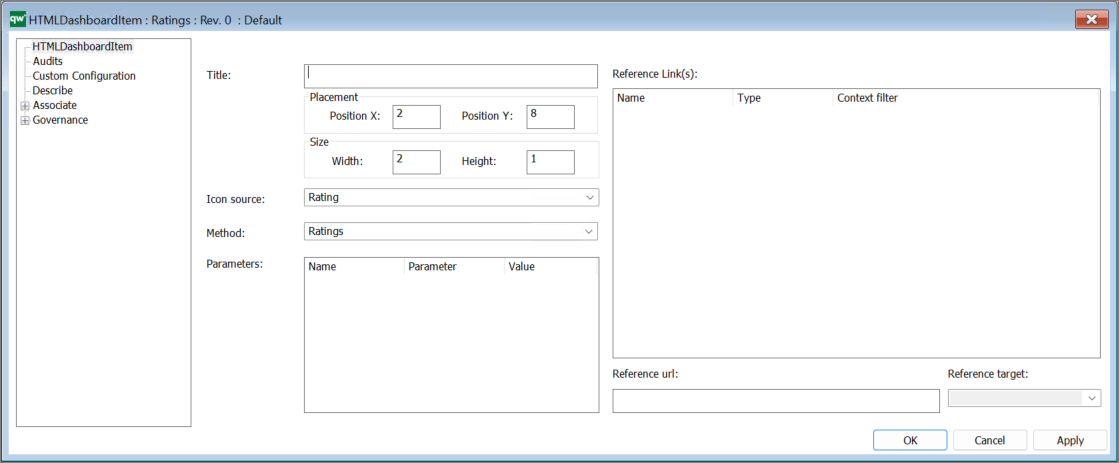
Ratings is a standard method where no other configuration is needed.
DashboardItem – SpreadSheetView
This method links to a Spreadsheet and opens it in a maximum IFrame in the dashboard.
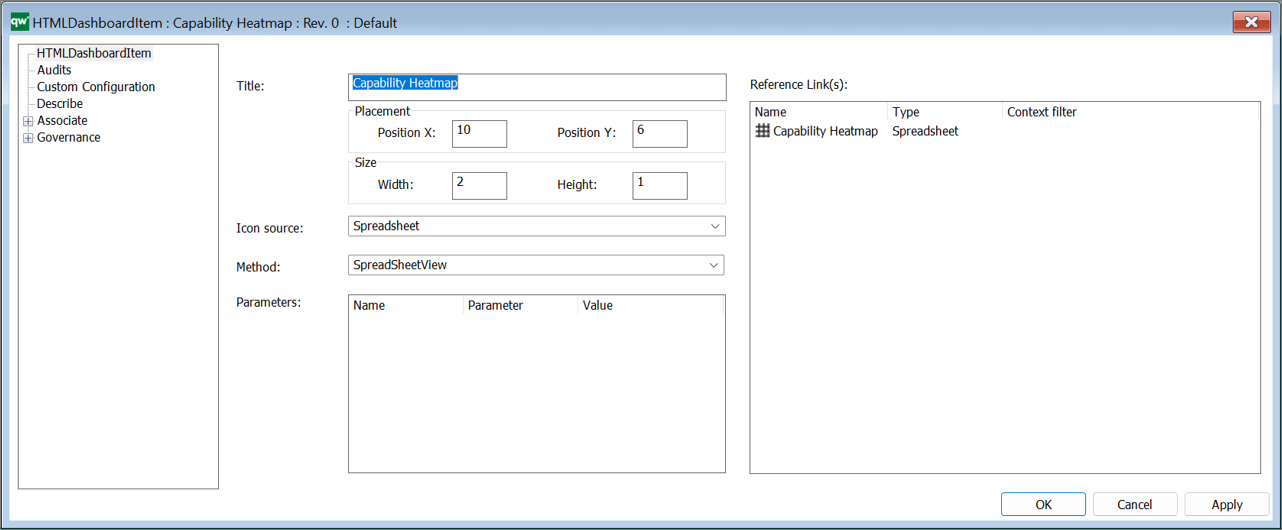
It is possible link to 1 spreadsheet with this method, if you what to have multiple Spreadsheets in a list, you should use the TableListView.
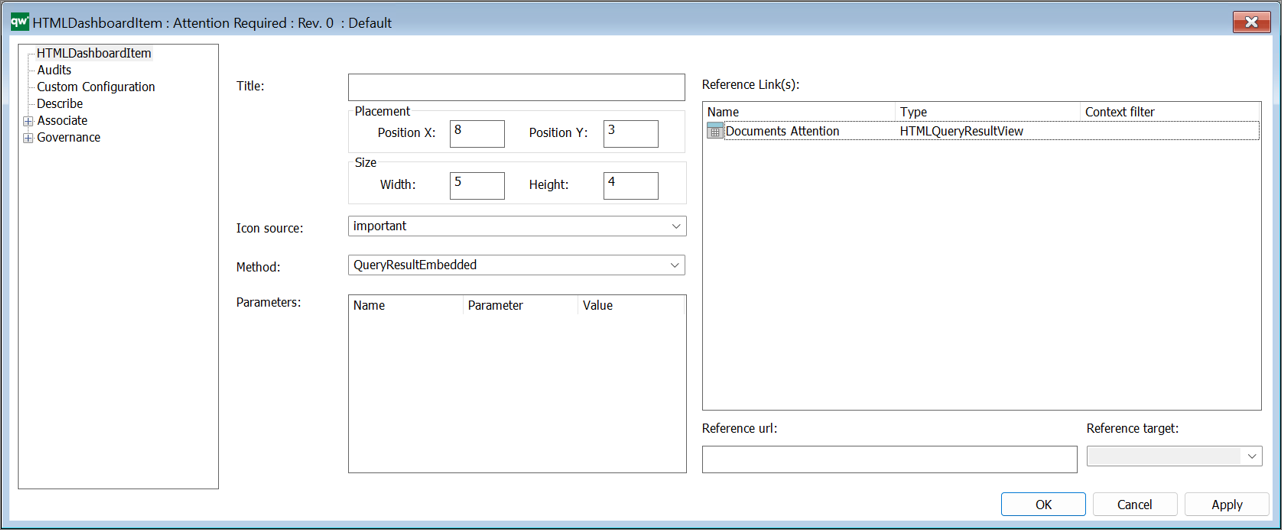
DashboardItem – QueryResultView
This method links to QueryResultView, and opens it in a maximum IFrame in the dashboard.
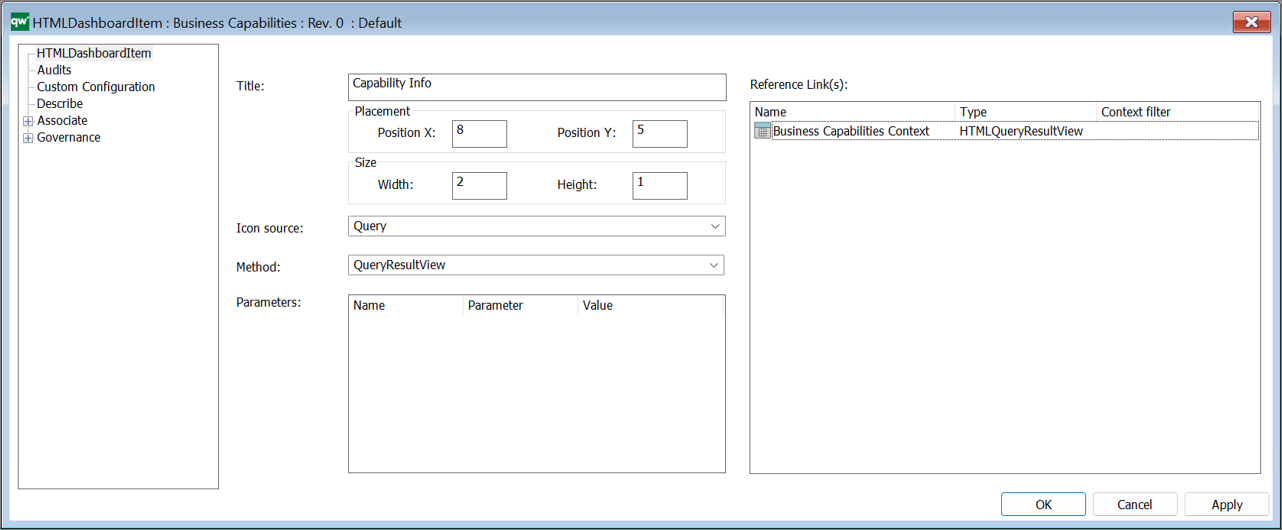
It is possible link to 1 HTMLQueryResultView with this method, if you what to have multiple HTMLQueryResultViews in a list, you should use the TableListView.
DashboardItem – QueryResultEmbedded (10.10)
This method shows the linked QueryResultView in the DashbordItem, so it is possible to have the QRV side by side with a diagram on a Dashboard.
DashboardItem – QueryResultEmbedded – Context (10.10)
This method shows a QueryResultEmbedded in a dashboard tile.
This method is context dependent, i.e. the QueryResultEmbedded is updated based upon what is selected (responsive).
DashboardItem – QuickSearch (10.10)
This method shows a QuickSearch tile on a Dashboard.
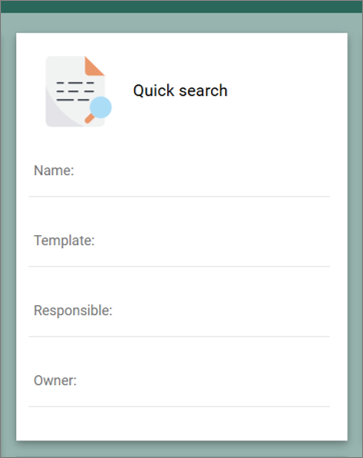
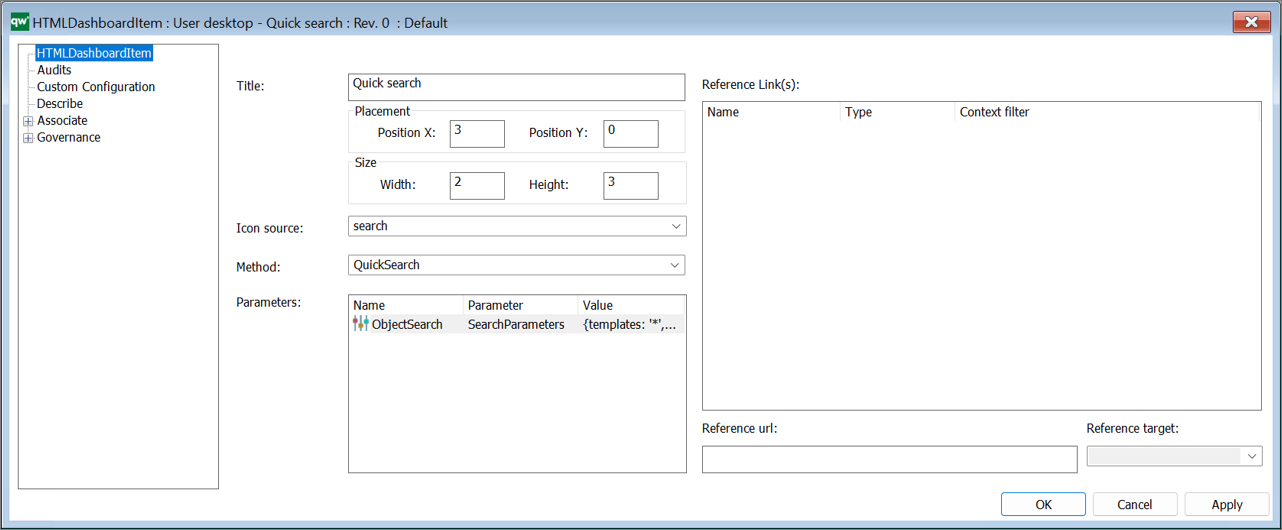
The Search parameters are specified via the HTMLParameter.
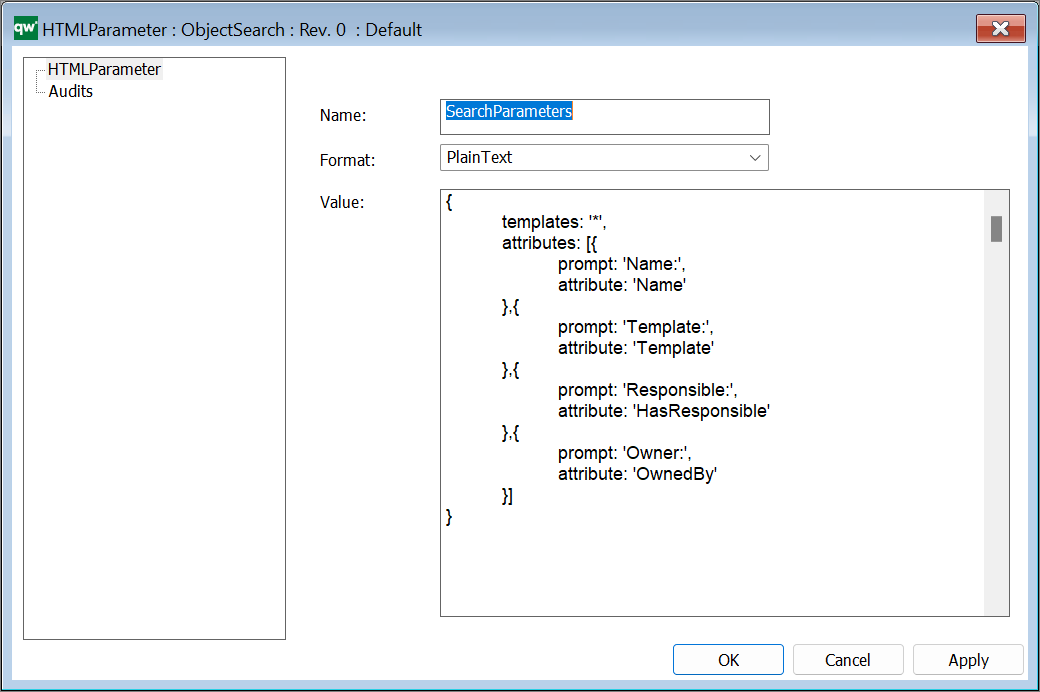
In the example above “*” has been inserted as search criteria for the templates, it is possible to configure the template list by inserting Template names, seperated with “,” to focus the search.
DashboardItem – TableListView
This method shows the linked content in a list.
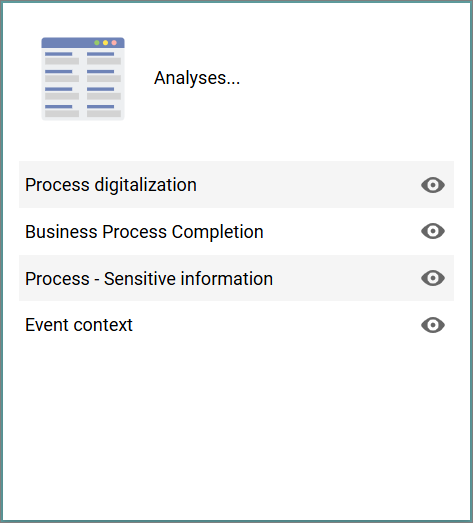
It is possible to links multiple references and to different types of content, such as HTMLQueryResultView / Spreadsheets / HTMLFeatures / HTMLContentBoxes.
It is possible to group content in on or more HTMLContentBoxes.

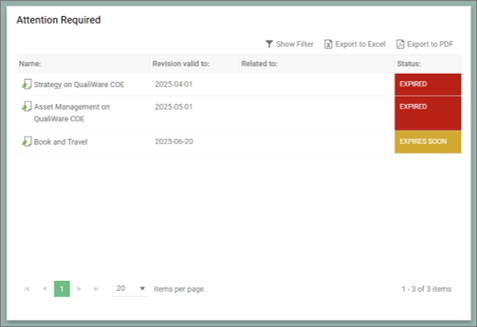
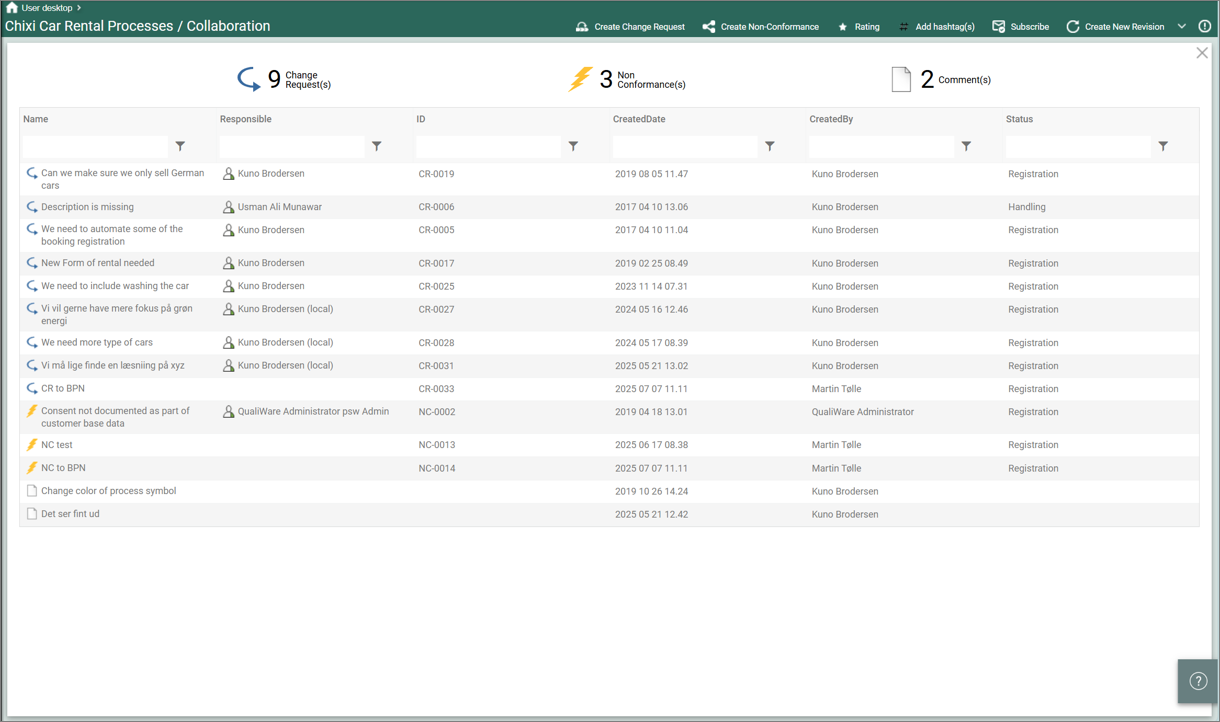
DashboardItem – TableOverview
The TableOverView-method is used to display a list of objects based on a GenericQuery.
Example:
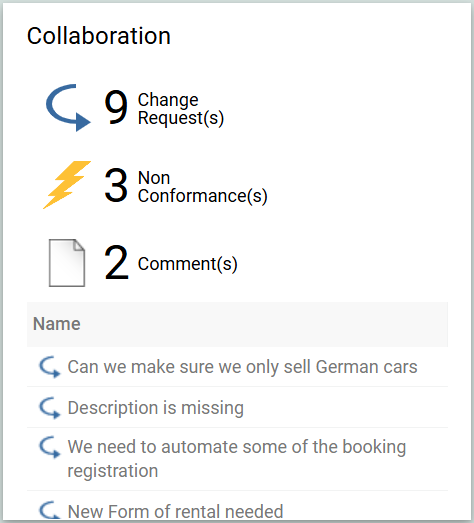
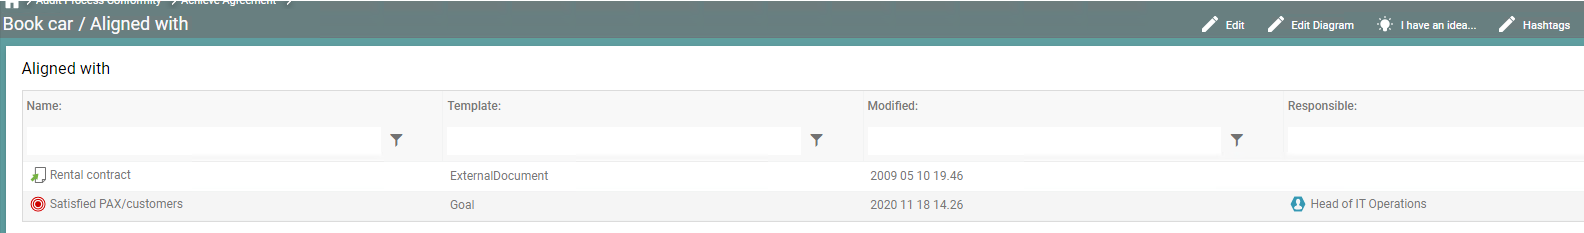
The tile is expandable and can contain more coloums when shown in “full” view (this is specified as part of the underlying Query).
It is set up in the following way:
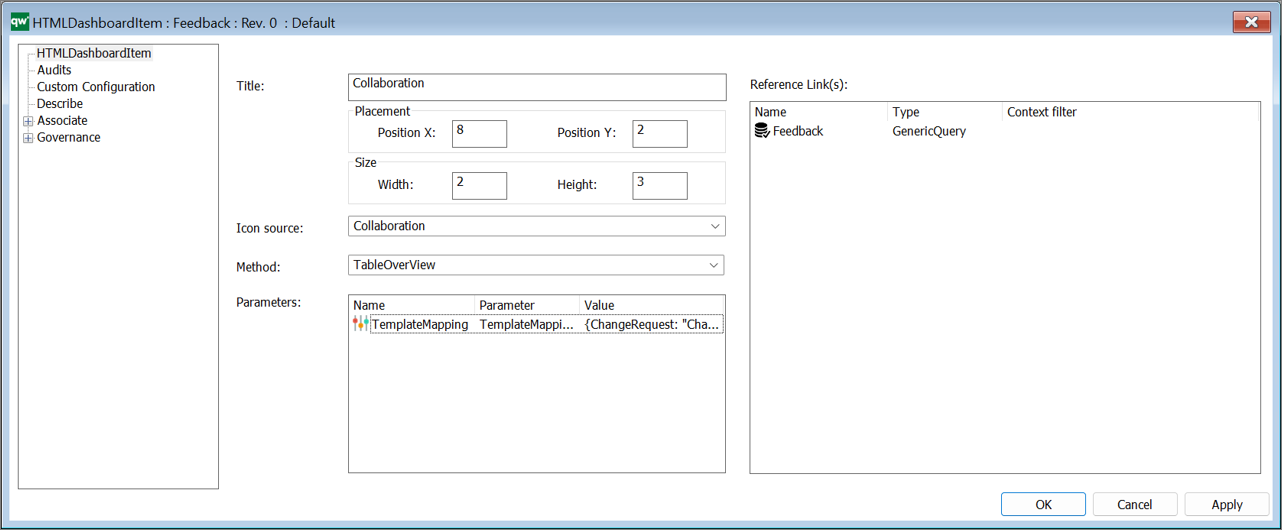
The reference Link(s)-object is a generic query showing data about a collection of objects.
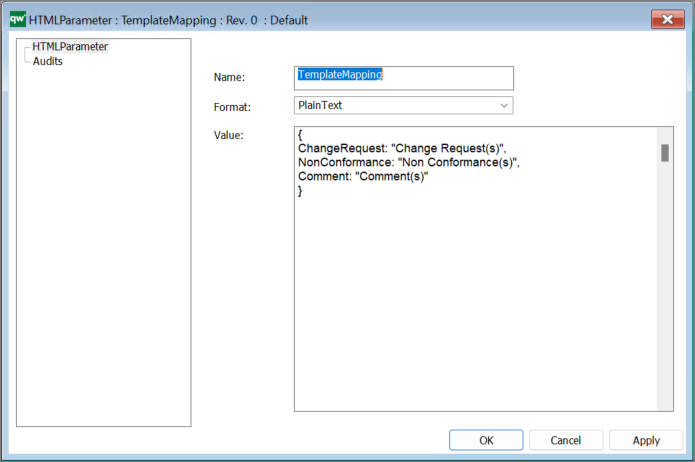
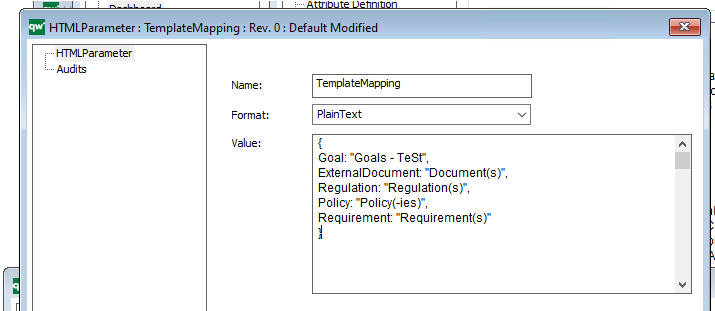
The parameter is HTMLParameter containing a mapping string. The mapping will only change the label shown on the web page.
Note the method is not context dependent, i.e. responsive based upon when is selected in the diagram, to get this functionality the TableOverView – Context should be used instead.
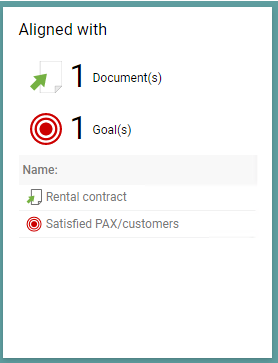
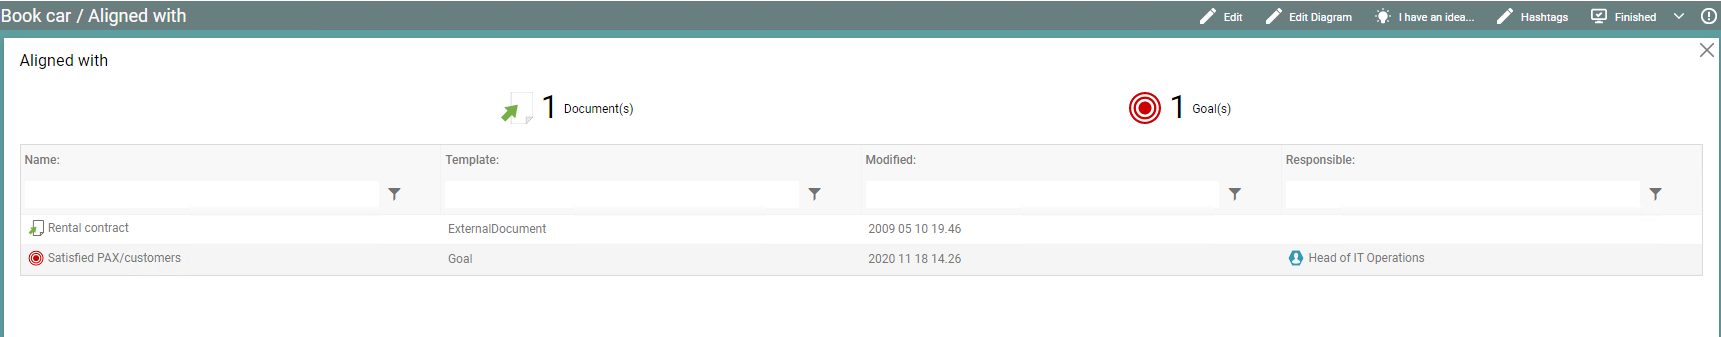
DashboardItem – TableOverview – Context
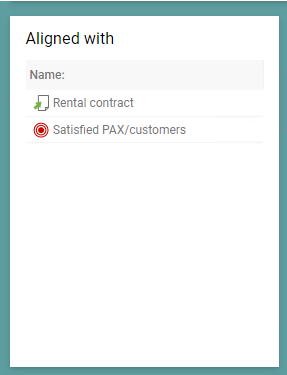
The TableOverView – Context-method is used to display a list of objects based on a GenericQuery.
Examples:
It is set up in the following way:
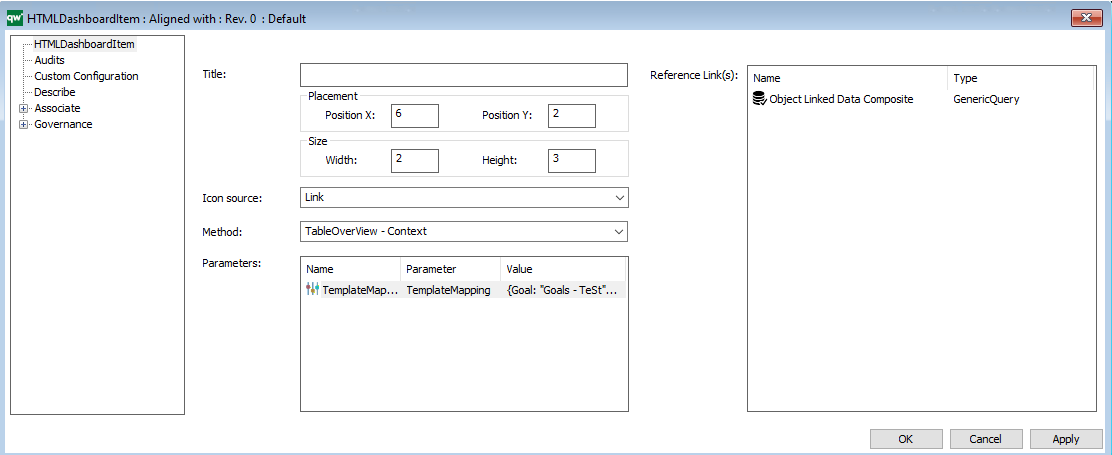
The reference Link(s)-object is a generic query showing data about a collection of objects.
The parameter is HTMLParameter containing a mapping string. The mapping will only change the label shown on the web page.
If the HTMLParameter is empty the count of different templates will be hidden:
Example of empty parameter:
DashboardItem – Visualization
The Visualization method is used to display a link to one visualization, using the ModelVisualizer.
Note if you what to list multiple ModelVisualizations (and other links) in the same DashboardItem you should use the TableListView method.
DashboardItem – ExternalSource (10.10)
The Visualization method is used to display a link to an external source.
This can be e.g. an external web-page or a Power BI report.
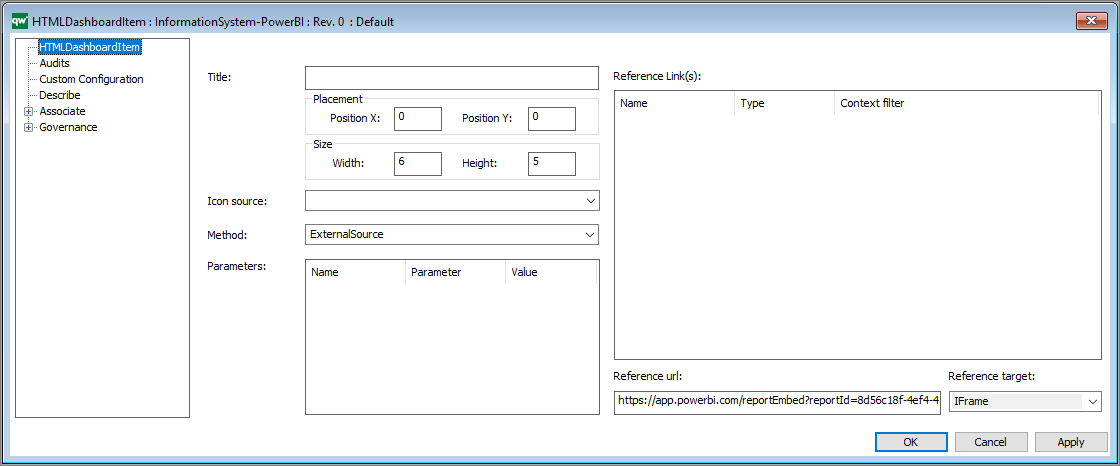
Under reference target you can choose between different targets:
- NewWindow – Opens the reference url in a new window
- IFrame – Opens the reference url in an IFrame
- IFrameOnMaximize – Link to the reference url and opens a maximized IFrame when clicked
DashboardItem – GovernanceHistory
This method shows the governance history of the content.
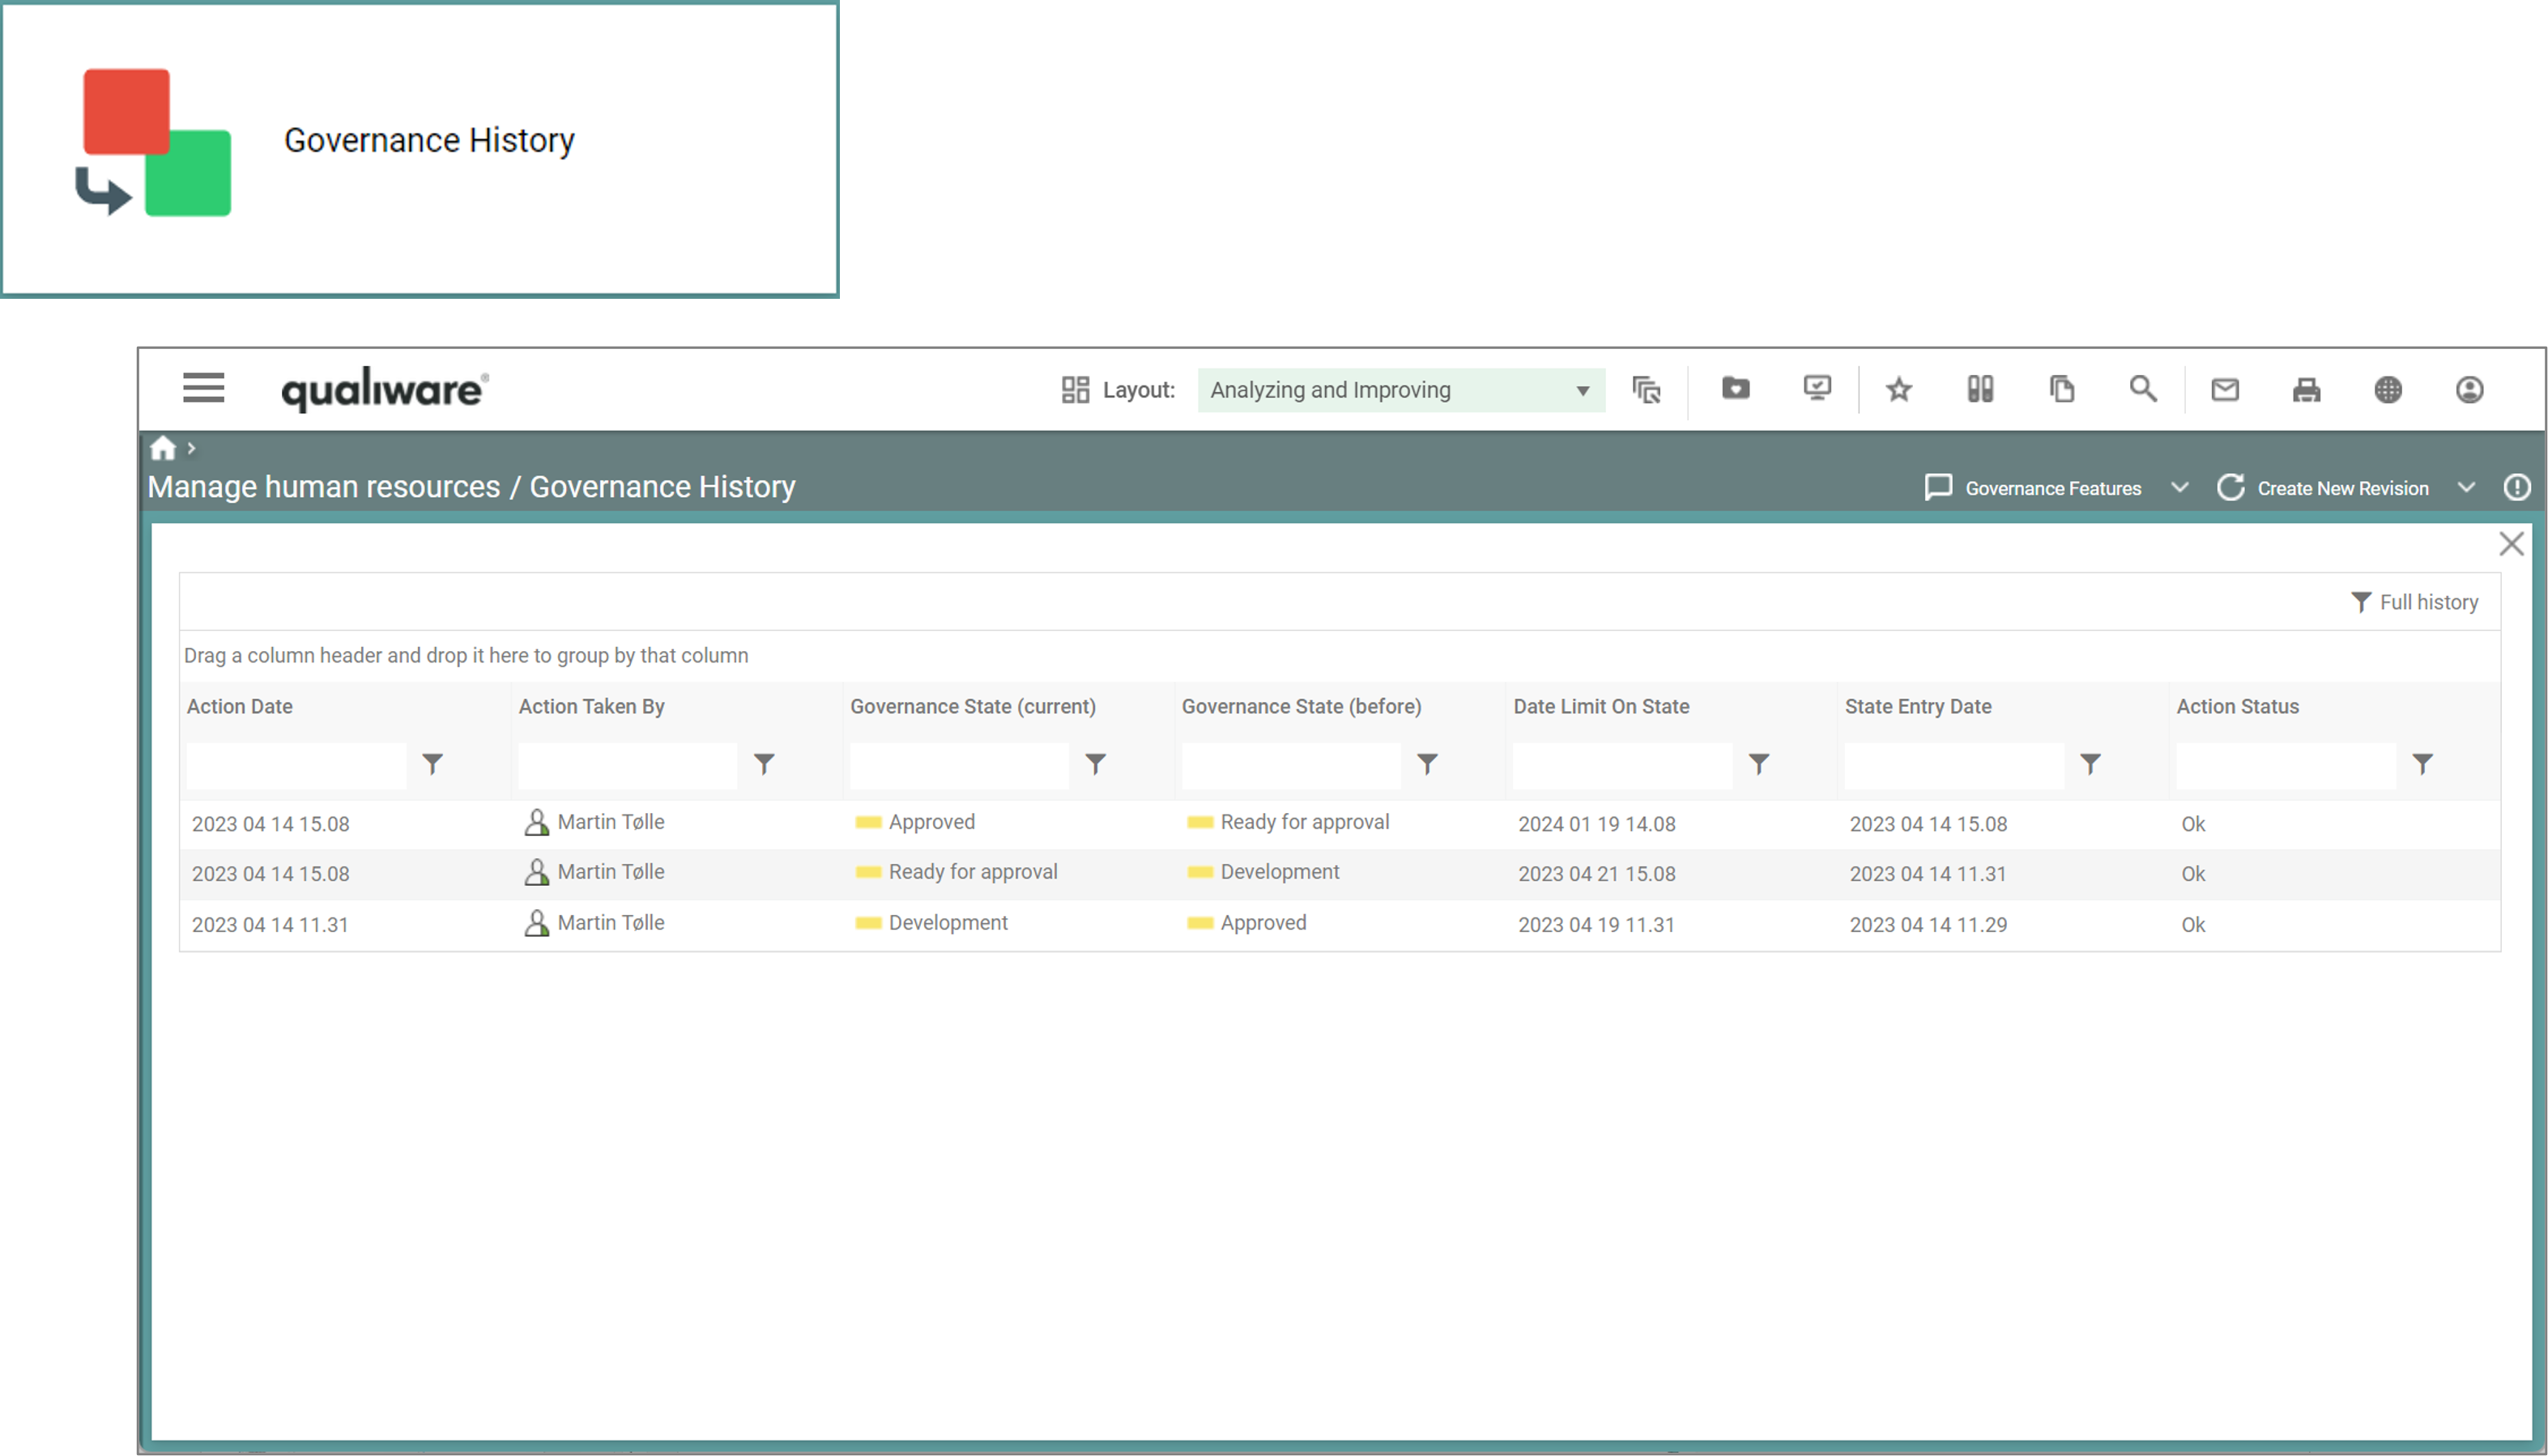
Governance History is a standard method where no other configuration is needed.
DashboardItem – AcknowledgeHistory
This method shows the AcknowledgeHistory of the content, using the Acknowledge List.
Acknowledge History is a standard method where no other configuration is needed.
Appendix
DashboardItem Icon Source Cheat Sheet
| (Empty) |  |
Ability |  |
Approve | |
| Capability |  |
Change | Chart |  |
|
| Collaboration | Comment | Context |  |
||
| Cost |  |
Cycle | Dashboard |  |
|
| Deleted | Edit | Feedback | |||
| Heatmap |  |
Highlight | 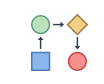 |
Image | |
| Improvement | Information |  |
Items | ||
| Link | List |  |
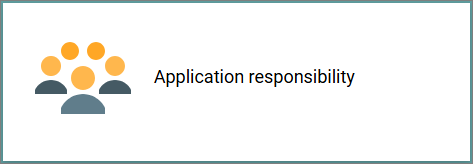
People | ||
| Plan | Process |  |
Query | ||
| Rating |  |
Report |  |
Risk | |
| Score |  |
Spreadsheet | 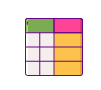 |
Visualization |  |
In QualiTube, you can find videos about how to configure the Dashboards