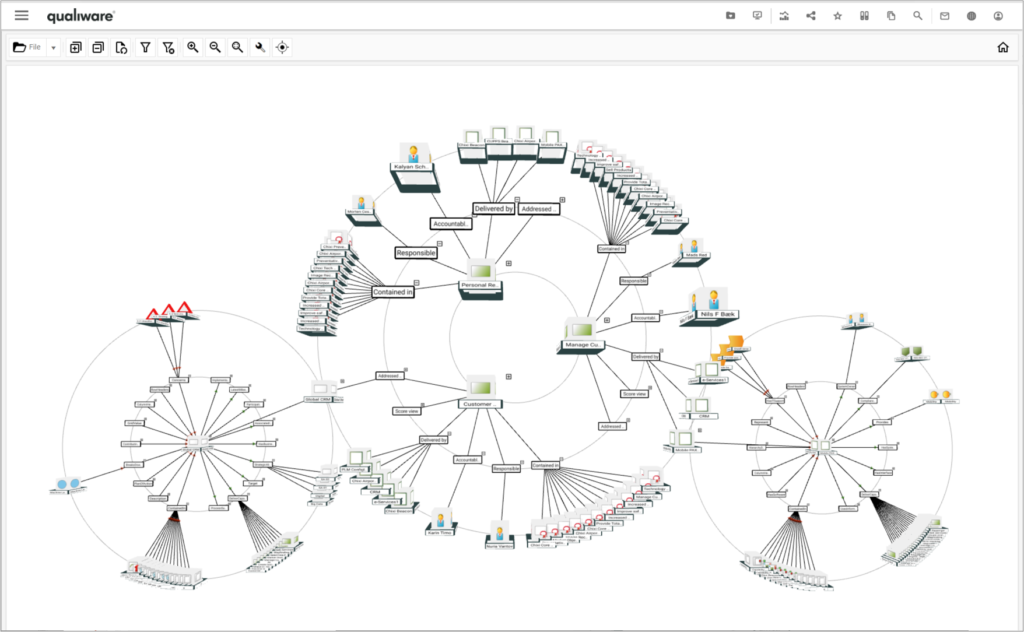
QualiWare X contains a 3D visualization feature.
The feature can be used on any object or be available in relation to queries and lists. A visualization creates a “solar system” with the selected object(s) in the center.
Each object in a visualization can be explored locally or included in the original “solar system”.
Visualizing an object
The different visualization is available from the dashboards of e.g. a diagram.
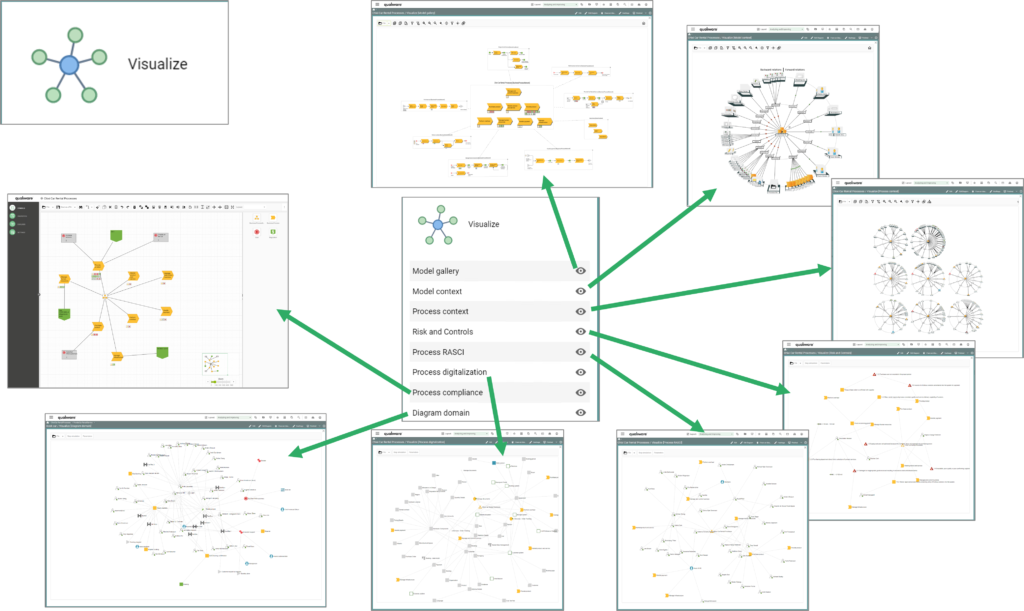
The visualization feature is also available for all objects from the Repository Explorer Context Menu.
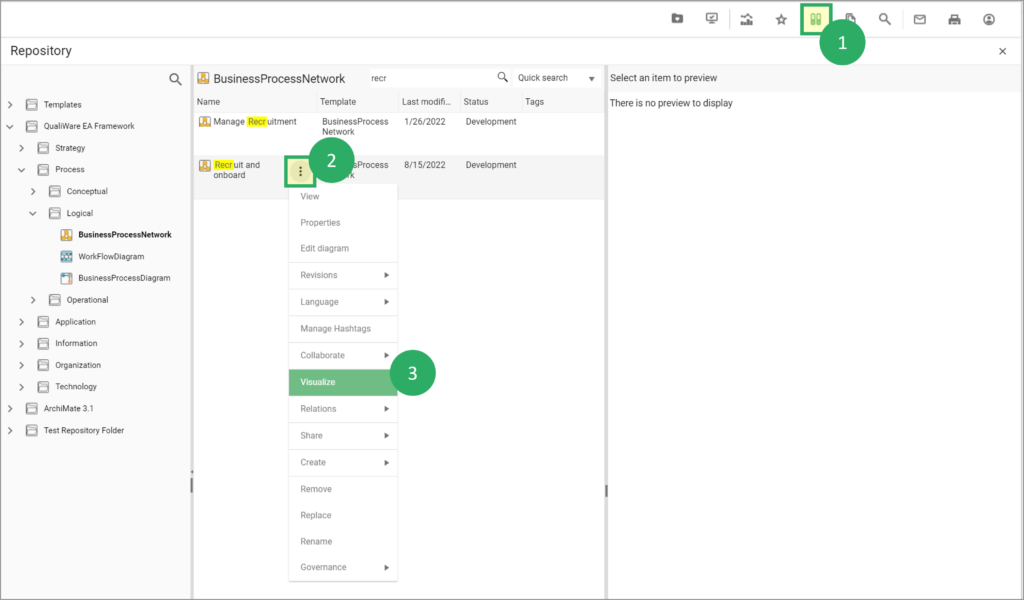
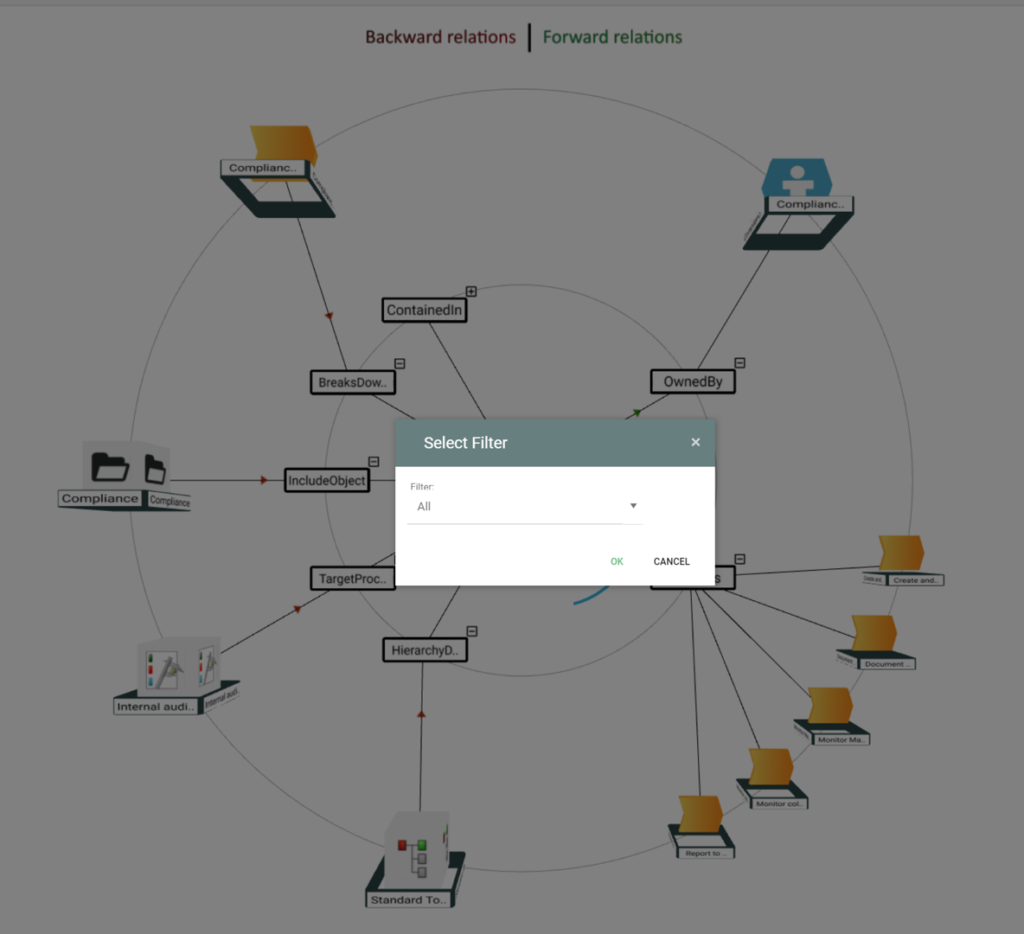
When “Visualize” is selected, the 3D visualizer is opened with the selected object in the centre. Objects shown on the left will link to the centre object and objects on the right are linked by the centre object.
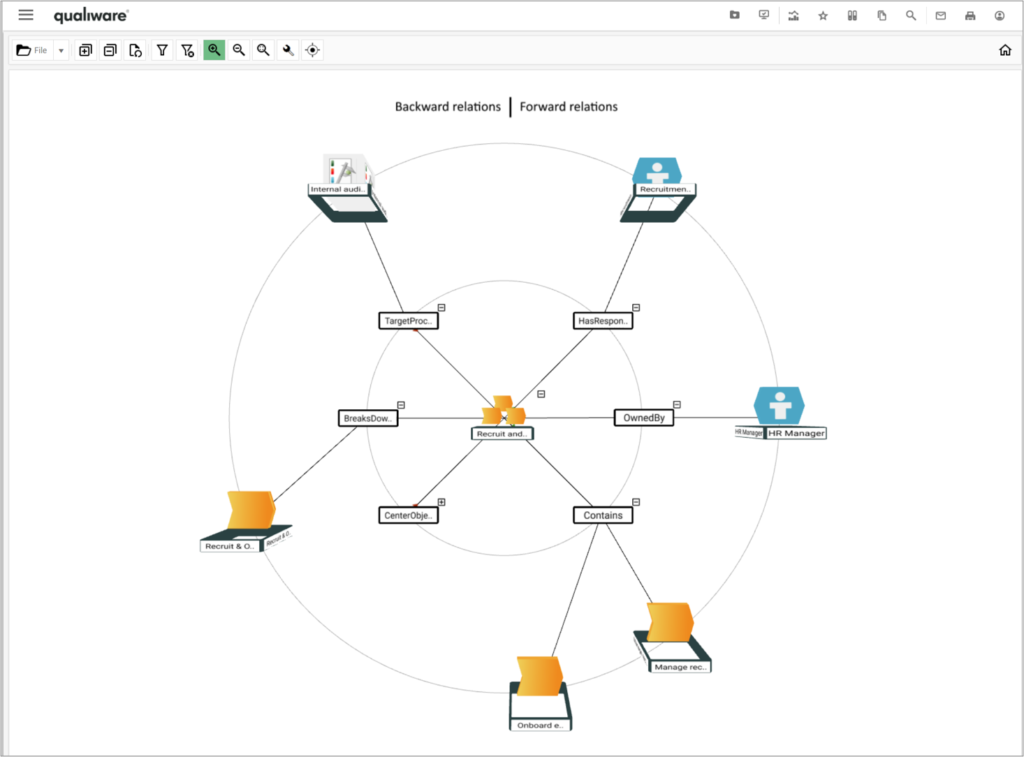
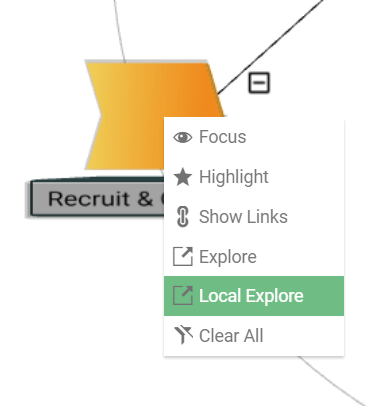
View may be turned, and a right-click menu allows the user to open a third dimension of relationships from the selected periphery object.
- Focus
- Highlight
- Show Links
- Explore (open up a new context view, with the object in center)
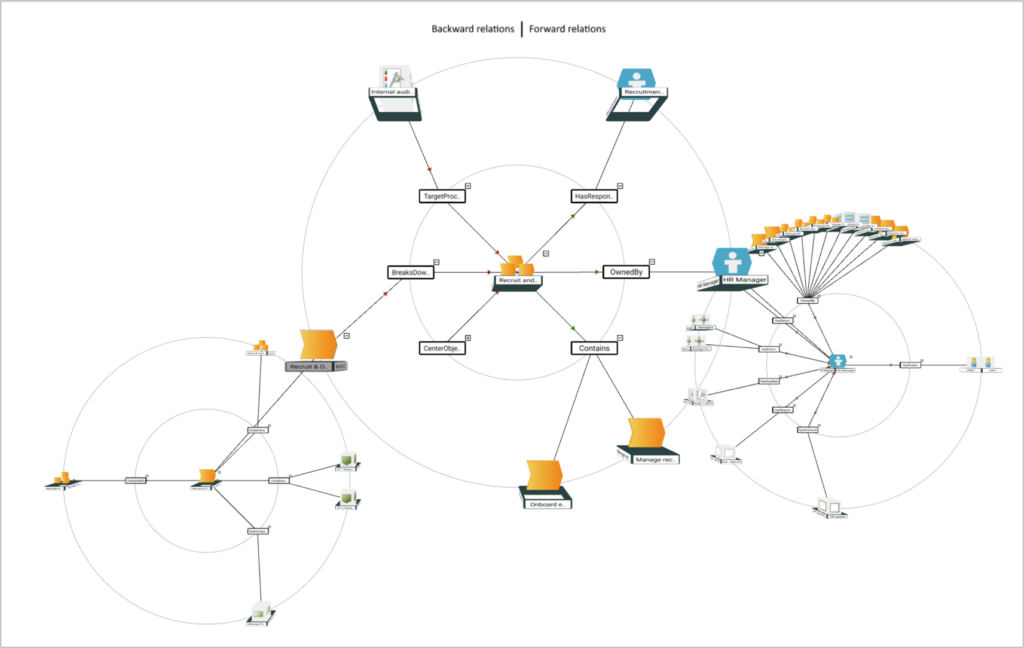
- Local Explore (open up a new context in the same view)
- Clear All
Hence, it is possible to visualize the relationship you want to explore.
Visualization from a list
The 3D Visualizer may also be accessed from several list (so-called QueryResultViews or QRV).
Once you have filtered the list to contain the desired target object(s), you can click the “Visualize” to open the selection in the visualizer.
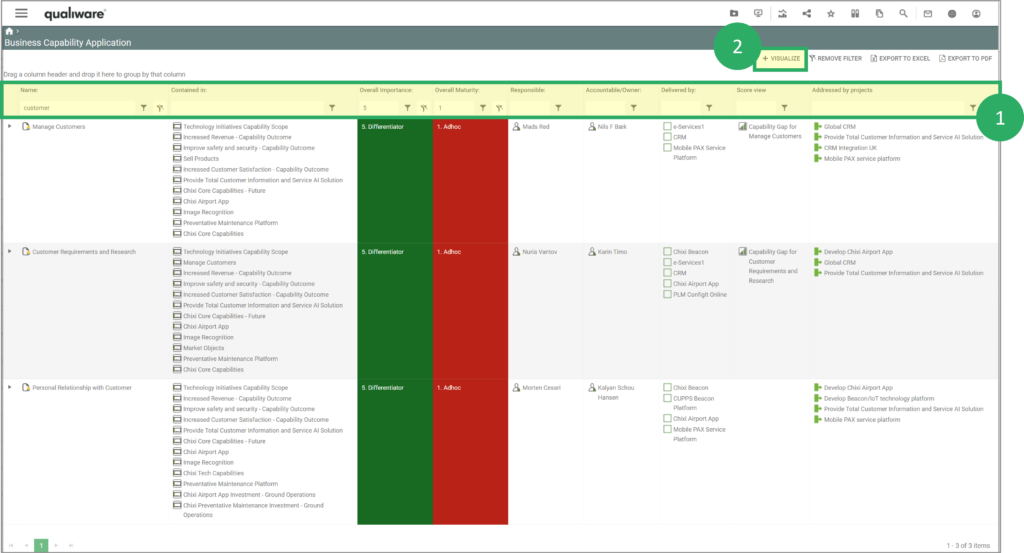
This option will result in another “flower-like” view with all first-column objects in the centre ring, and the relationships shown in the QRV as outer rings.
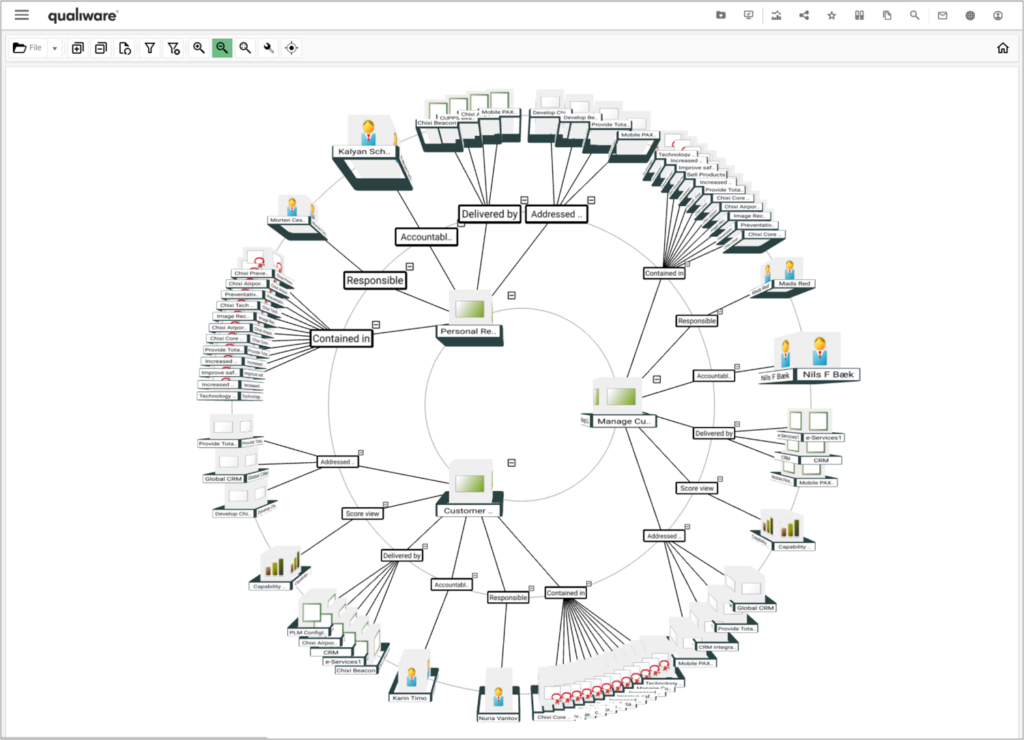
Filtering, highlighting, text search, exploring and other features may be used to analyse and re-render the visualization of the non-graphical data in the list.
Features and menus
As shown above, you can right click any object and explore it further.
You can turn the view by pressing left mouse button and move the mouse.
You can move the whole visualization by pressing the right mouse button and move the mouse.
In the top left corner of the visualizer there is a menubar, giving access to various features and functions.

From the menubar you can:
- Expand and collapse relations in the visualization
- Revert the visualization
- Filter: objects that contains the text is highlighed
- Remove filter
- Zoom in and out
- Fit to screen
- Local explorer settings: By setting the Expansion length and depth, the placement of the local explore context can be adjusted
- Focus relationships, enables you to focus on a subset of the relations in the visualization (see example to the right)
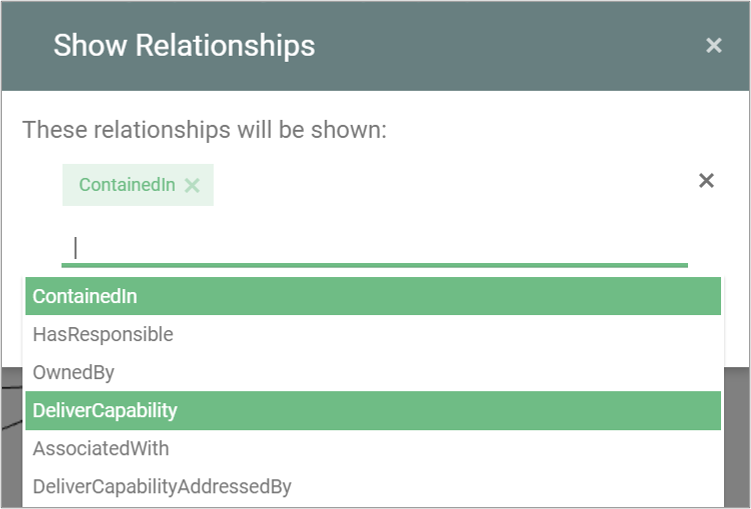
Visualizer filtering
As default all templates and relationship are shown in the visualizer.
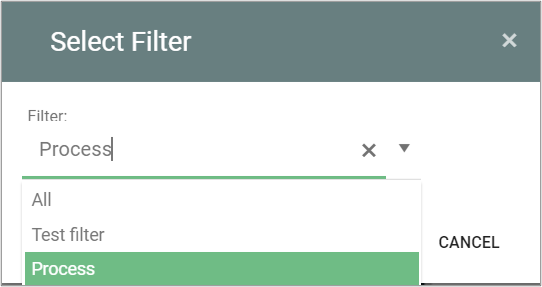
It is possible to create dedicated filters using the HTMLVisualizerFilter template.
Once a filter is created it becomes available in the Explore and Local Explore menu.
