Capability Map Viewpoint : Archimate

Concerns: Architecture strategy and tactics, motivation
Purpose: Designing, deciding
Scope: Strategy

The capability map viewpoint allows the business architect to create a structured overview of the capabilities of the enterprise. A capability map typically shows two or three levels of capabilities across the entire enterprise. It can, for example, be used as a heat map to identify areas of investment. In some cases, a capability map may also show specific outcomes delivered by these capabilities.

Organization Viewpoint : Archimate

Concerns: Identification of competencies, authority, and responsibilities
Purpose: Designing, deciding, informing
Scope: Single layer/Single aspect

The organization viewpoint focuses on the (internal) organization of a company, department, network of companies, or of another organizational entity. It is possible to present models in this viewpoint as nested block diagrams, but also in a more traditional way, such as organizational charts. The organization viewpoint is very useful in identifying competencies, authority, and responsibilities in an organization.


Outcome Realization Viewpoint : Archimate

Concerns: Business-oriented results
Purpose: Designing, deciding
Scope: Strategy

The outcome realization viewpoint is used to show how the highest-level, business-oriented results are produced by the capabilities and underlying core elements.

Application Architecture Diagram

Purpose: The purpose of an Application Architecture Diagram is to show the structure of an Information System and its relations to other Information Systems.

Core concerns: The Application Architecture Diagram is used to document the application/systems layer. It can show information flows and system dependencies between Information Systems as well as depict system components and system areas.

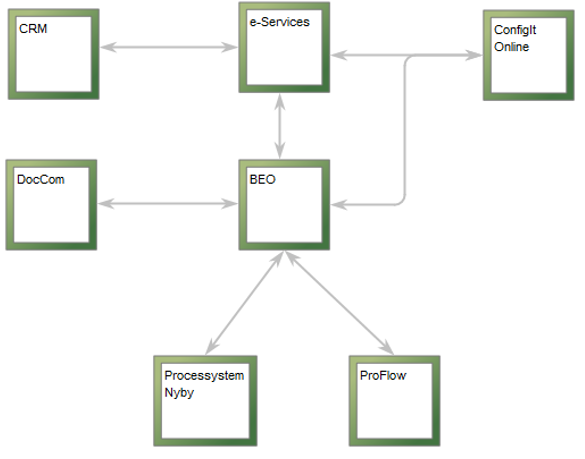
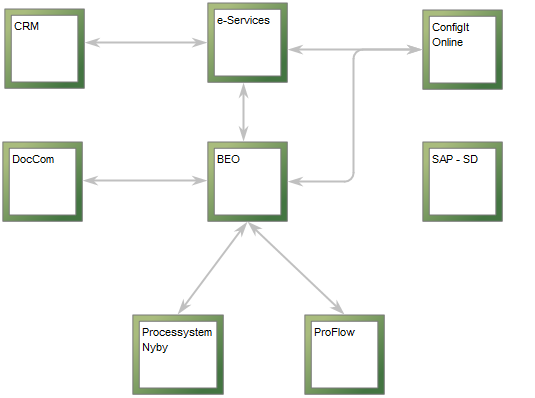
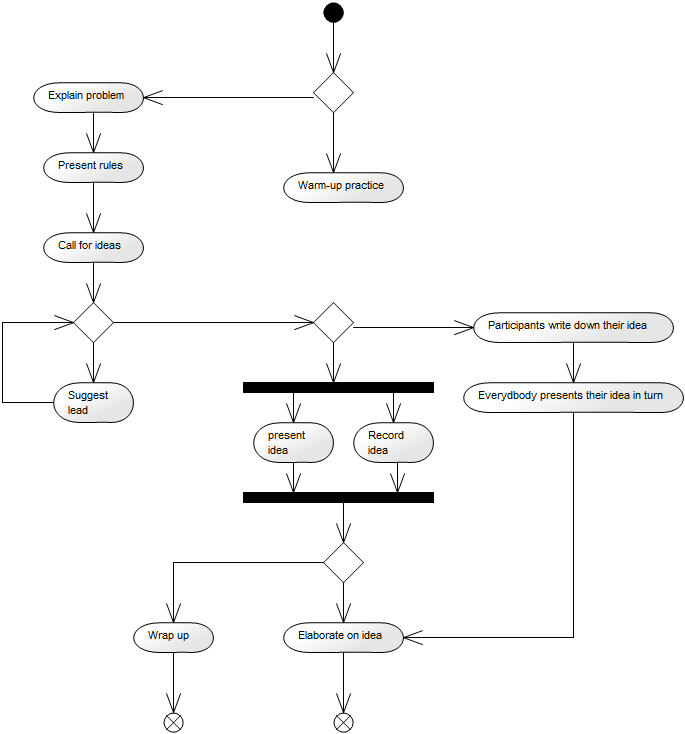
The above picture shows an example of an Application Architecture Diagram depicting an overview of the Information Systems related to BEO. The information systems are connected by arrows that symbolize system dependencies.

Other functionalities: Application Architecture Diagrams can be analyzed in QualiWare via the toolbar for Application Portfolio Management. The Application Portfolio Management tools offers analysis for redundant functionalities, performance matrix generation, system heat map generation, asset lifecycle view (se below picture), lifecycle dependencies, and capabilities delivered by multiple information systems.

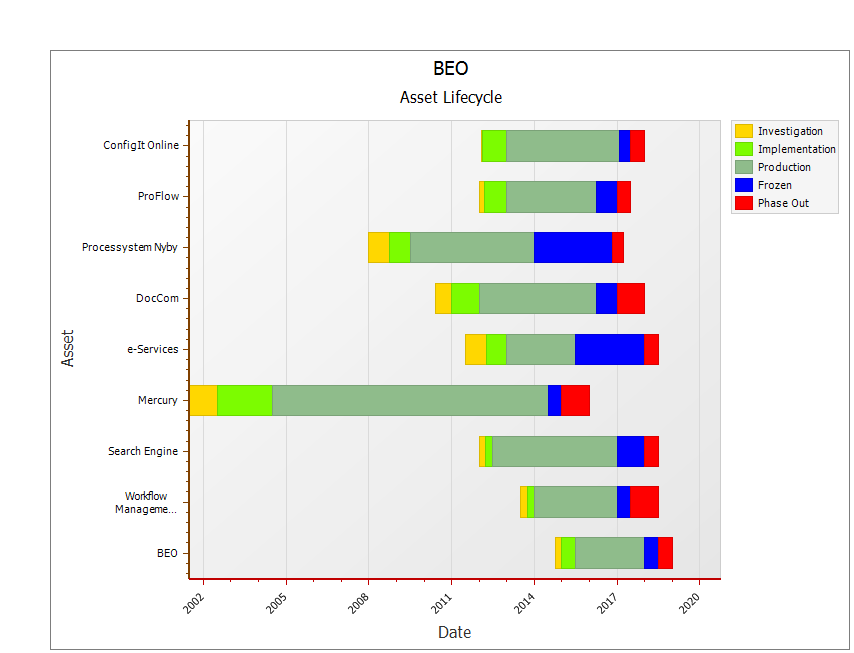
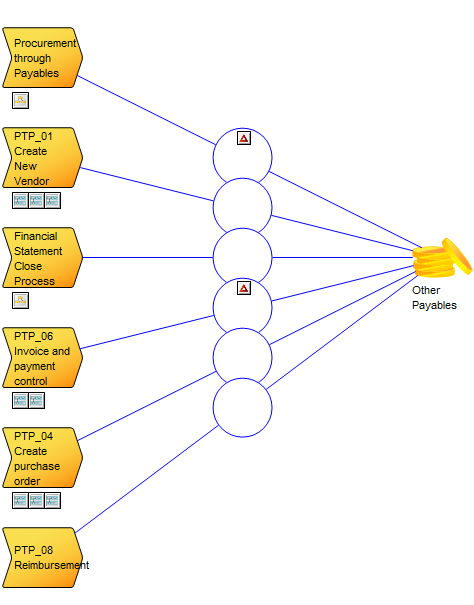
The above picture shows the Asset Lifecycle of the Information System ‘BEO’ and the Information Systems related to it is shown. The information depicted is pulled from the Information Systems’ metadata.

Relation to other templates: The elements depicted in the Application Architecture Diagram can be described in further detail in another Application Architecture Diagram, or in related diagrams such as a Data Flow Diagram.

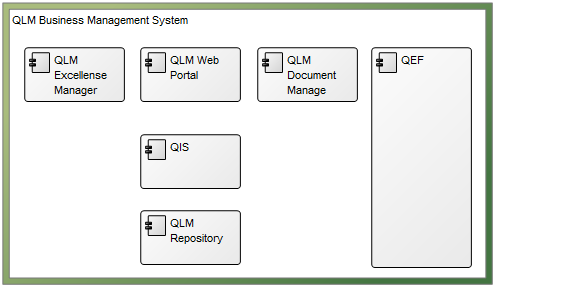
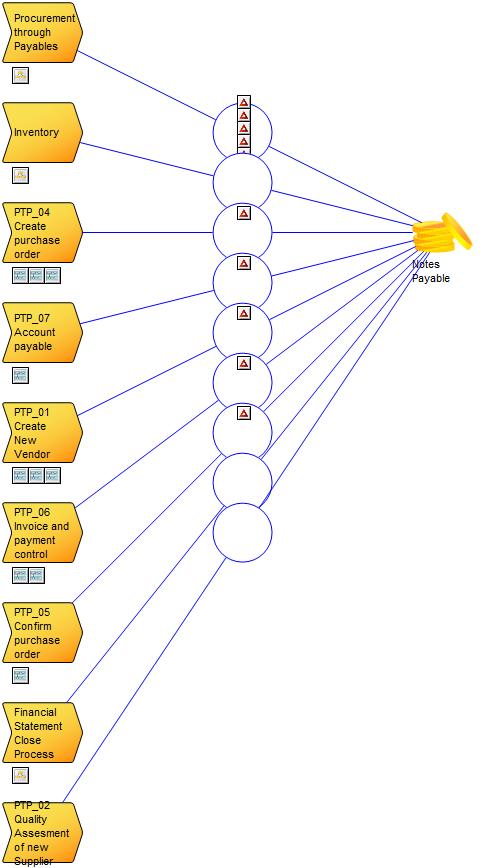
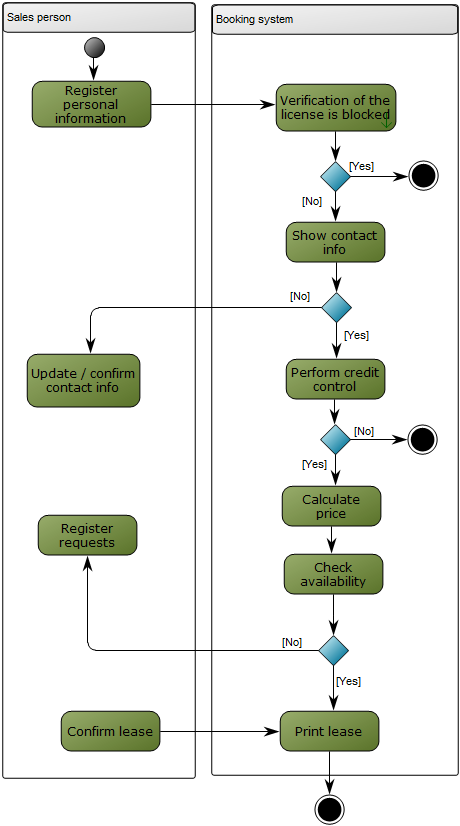
The above picture shows an example of a more detailed view of an information system. In this Application Architecture Diagram the System Components are visible.

For documentation of a physical or hardware layer, the Infrastructure Diagram template can be used.

Properties and metadata: The Application Architecture Diagram can for example retain the following information:

  • A description of the diagram
  • Link to the owner of the application architecture
  • Link to the one responsible for the application architecture
  • Associated documents, diagrams and other objects
  • Inherent Risk detailing risk considerations
  • Governance information detailing information about the published diagram and who has been involved in the approval of the diagram

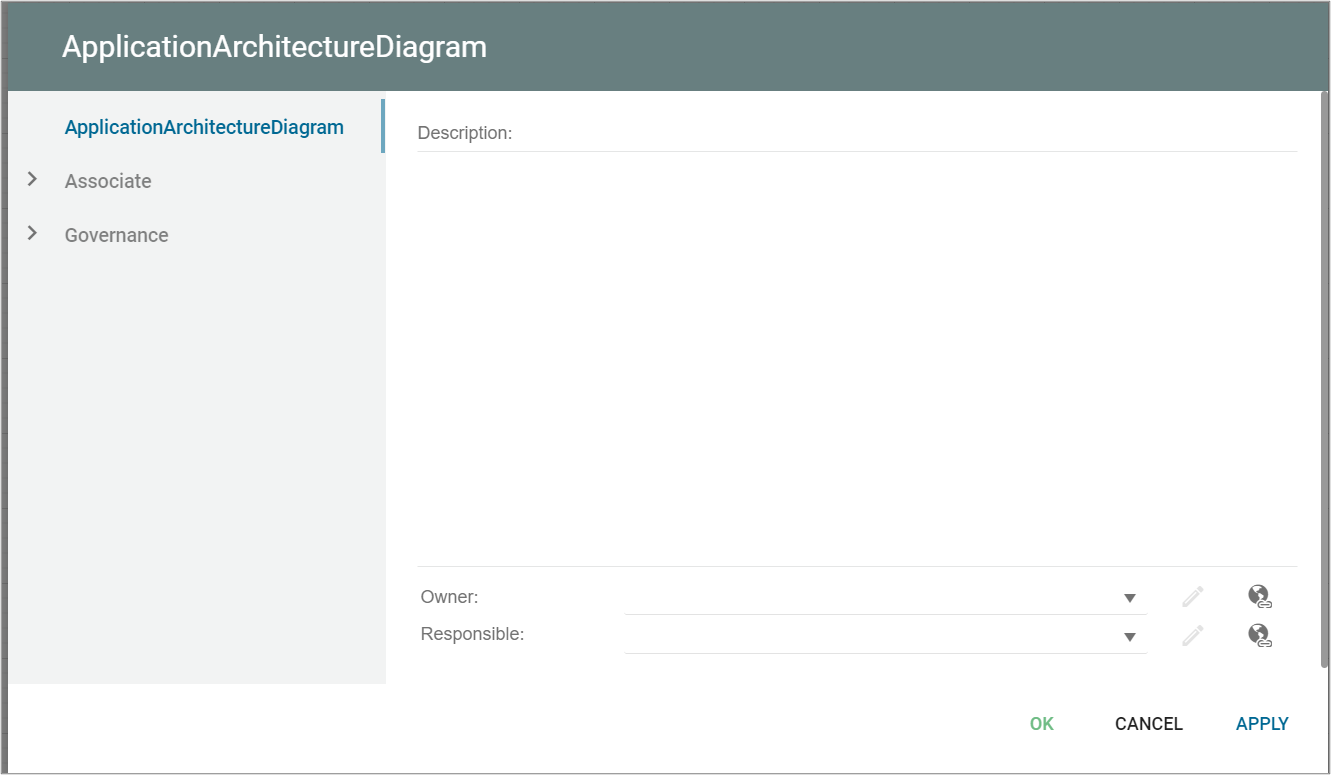
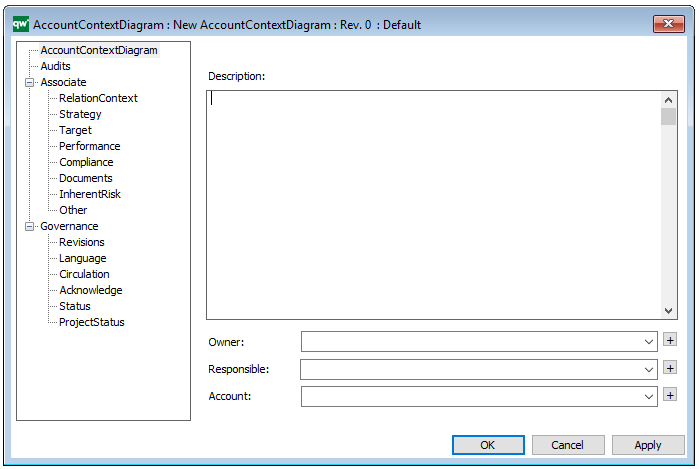
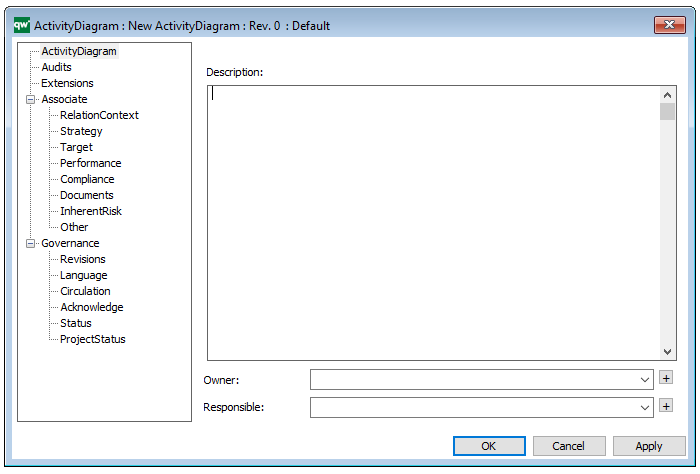
The above picture shows the properties dialogue window for the Application Architecture Diagram where you can view and edit the diagram’s properties.

Account Context Diagram

Purpose: The purpose of the Account Context Diagram is to enable financial risk management by illustrating which processes create transactions on a given account, and which risks are related to this transaction.

Core concerns: The Account Context Diagram enables you to model Accounts, Business Processes and link them with influences.

Below, you can see an example of an Account Context Diagram for the account ‘Other Payables’:

The risks are linked to the influencers and shown on the diagram. For example, in the above diagram, both risks are: ‘Goods received not invoiced, not recognized as a liability at period end’.

It is possible to link multiple risks to each influence. In the following diagram, you can see a similar Account Context Diagram, where several risks are connected to a single influence:

Relation to other templates: The Account Context diagram is for financial risk management. It is related to the Control Coverage Map and the Heat Map templates, which can be generated based on the information in the Account Context Diagram.

Properties and metadata: The Account Context Diagram ­­­­can for example retain the following information:

  • A description of the diagram
  • Link to the owner of the diagram
  • Link to the one responsible for the diagram
  • Link to the Account shown in the diagram
  • Audits (auto generated information regarding its current state and access rights)
  • Associated documents, diagrams and other objects
  • Inherent Risk detailing risk considerations
  • Governance information detailing information about the published diagram and who has been involved in the approval of the diagram

The above picture shows the properties dialogue window for the Account Context Diagram where you can view and edit the diagram’s properties in QualiWare Lifecycle Manager.

Activity Diagram

Purpose: The purpose of the Activity Diagram is to show the overall flow of control through workflows for computational and organizational processes using the UML standard.

Core concerns: The Activity Diagram enables you to document stepwise activities and actions with support for choice, iteration and concurrency. The template allows you to connect the following objects using either Control Flows, Object Flows or Exception Handlers:

Below, you can see two different examples of an Activity Diagram. The first illustrates a structure for an ideation process, the second shows the process for Booking an order – divided into two different Activity Partitions:

ActivityDiagram_2

ActivityDiagram_1

Relation to other templates: The Activity Diagram can be used instead of a Workflow Diagram or a Business Process Diagram, though the different languages have their own pros and cons. The Activity Diagram is part of the UML templates QualiWare supports along with the Communication Diagram, Deployment Diagram, Class Diagram, Composite Structure Diagram, State Diagram, Package Diagram, Component Diagram, Sequence Diagram, Use case diagram and Timing Diagram.

Properties and metadata: The Activity Diagram ­­­­can for example retain the following information:

  • A description of the diagram
  • Link to the owner of the diagram
  • Link to the one responsible for the diagram
  • Audits (auto generated information regarding its current state and access rights)
  • Extensions: Stereotypes, constraints and tagged values
  • Associated documents, diagrams and other objects
  • Inherent Risk detailing risk considerations
  • Governance information detailing information about the published diagram and who has been involved in the approval of the diagram

The above picture shows the properties dialogue window for the Activity Diagram where you can view and edit the diagram’s properties in QualiWare Lifecycle Manager.

For more information: about the UML and Activity Diagram, please visit the Object Management Group’s Website, where you can find the complete specification.