Package Diagram

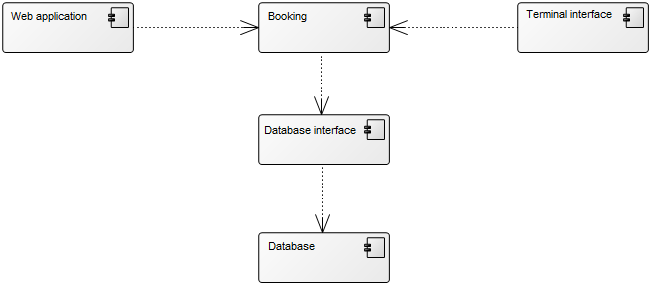
Purpose: The purpose of the Package Diagram is to group elements of a large system and illustrate the dependencies between them.

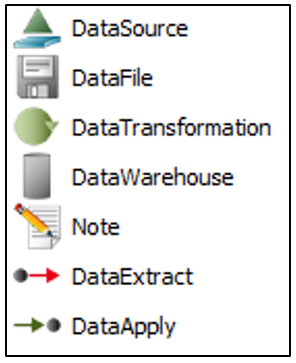
Core concerns: The Package Diagram can be used to organize a system’s parts and enables you to model Packages, Profiles and Annotations. These can be connected using Dependency, Profile Application, Package Merge, Package Import and Containment.

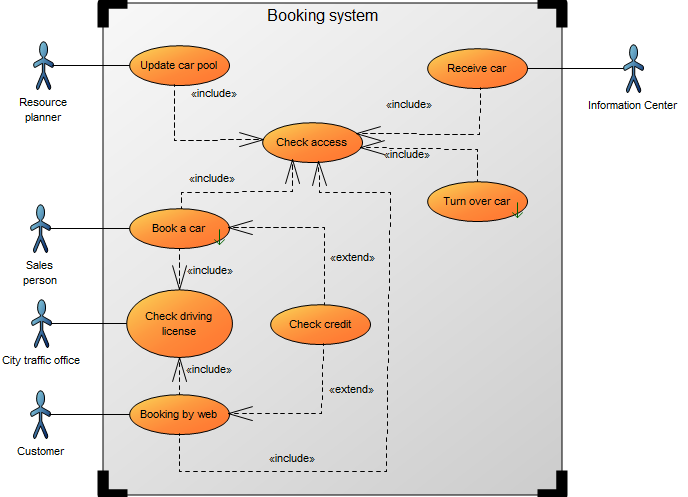
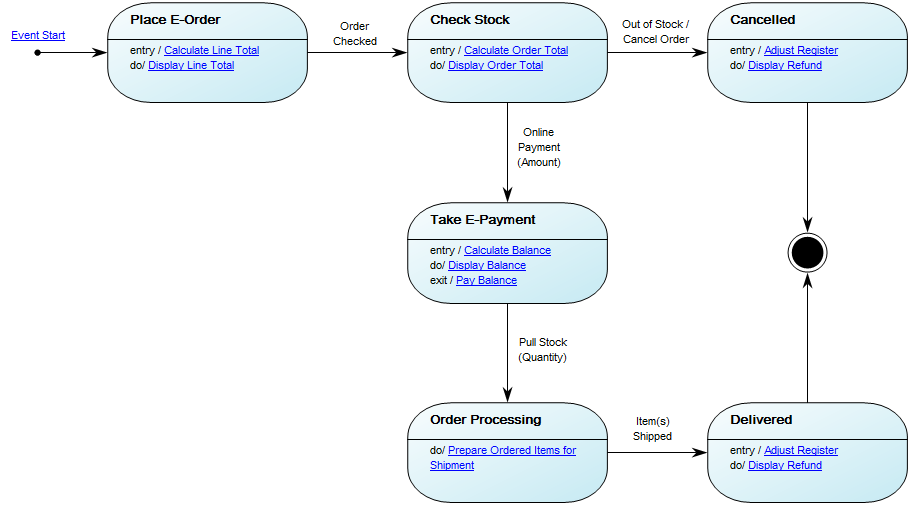
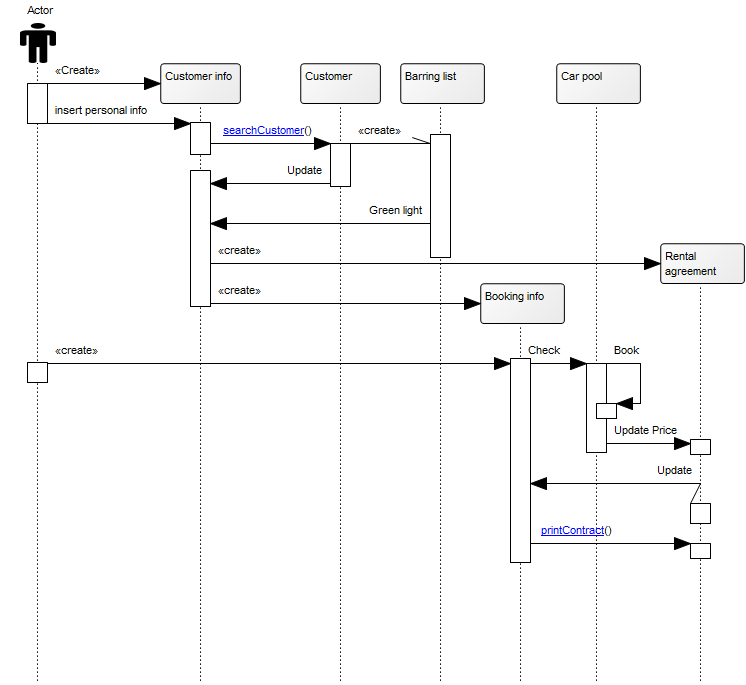
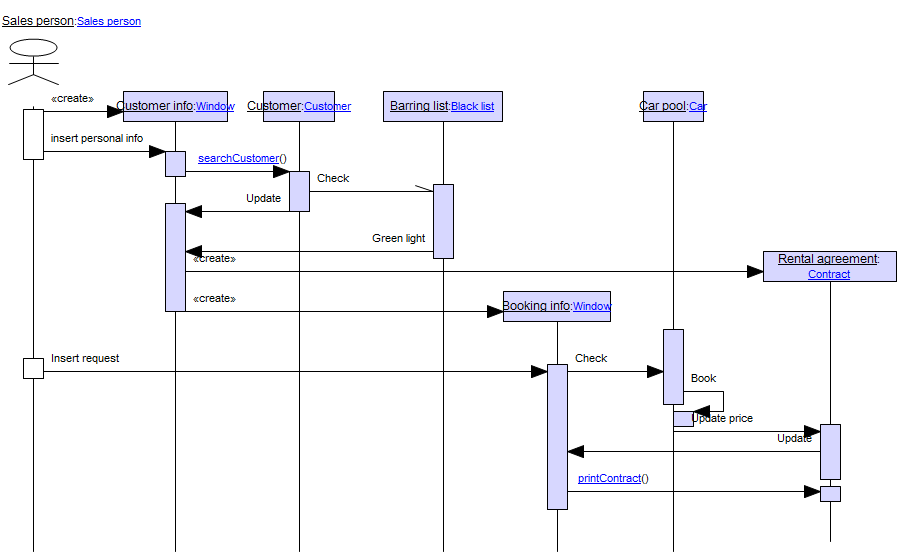
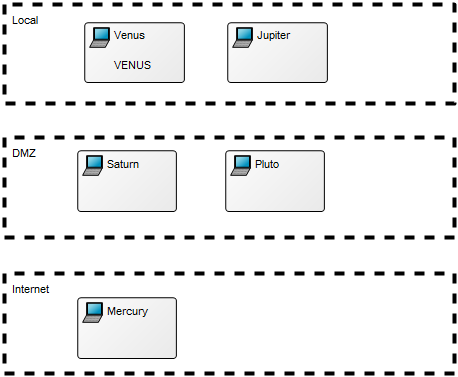
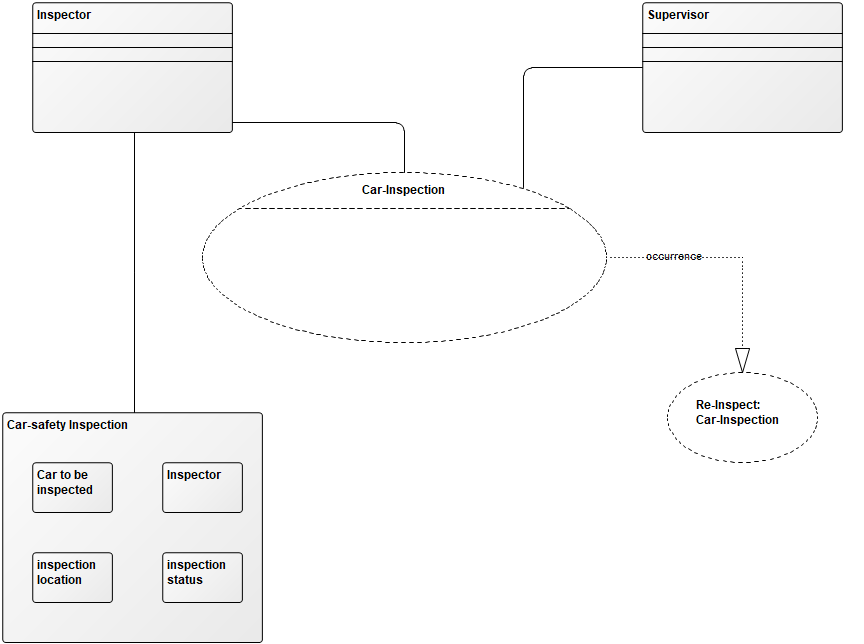
Below, you can see an example of a Package Diagram for a booking system for a car rental service:


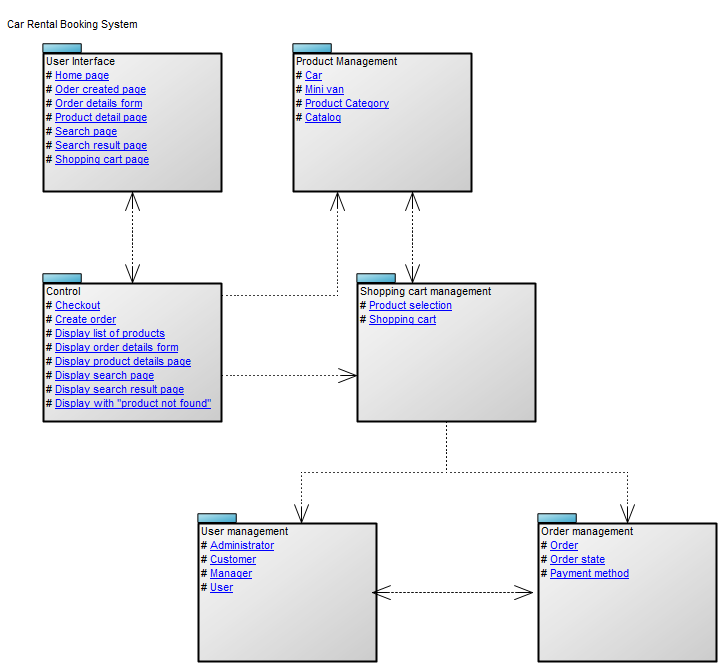
Relation to other templates: The Package diagram offers a simplified view of for example a Class Diagram, grouping classes into packages. It should be used when a class diagram becomes too large and complex to easily read.

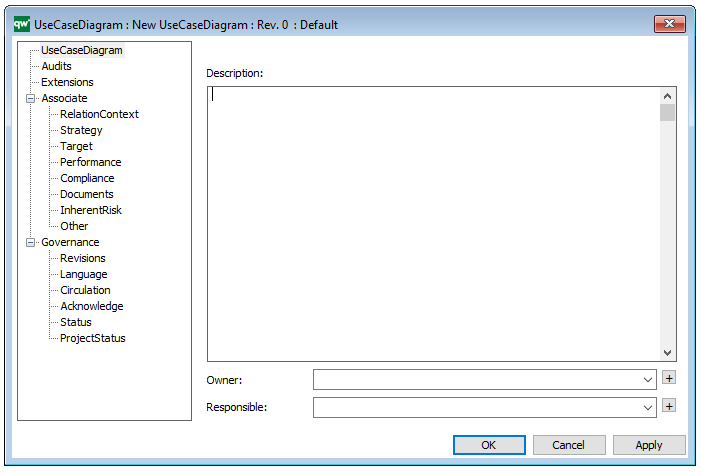
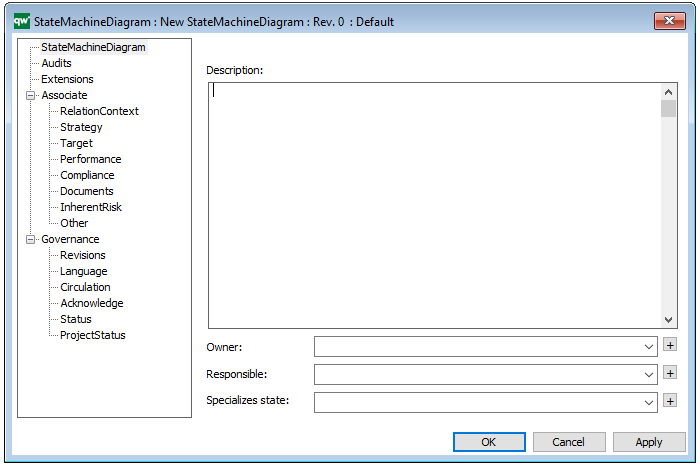
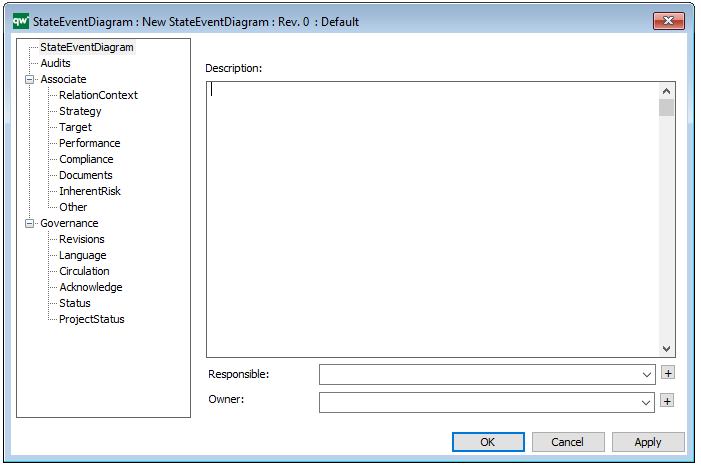
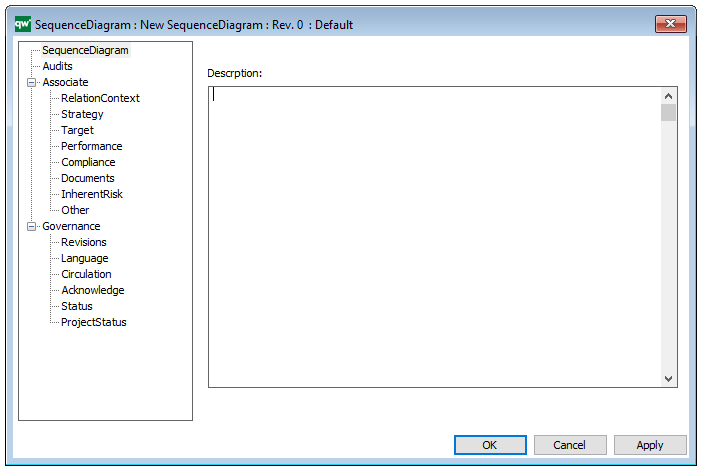
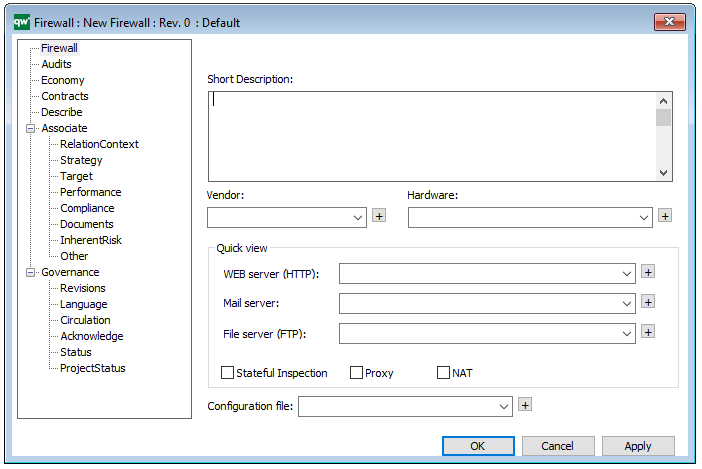
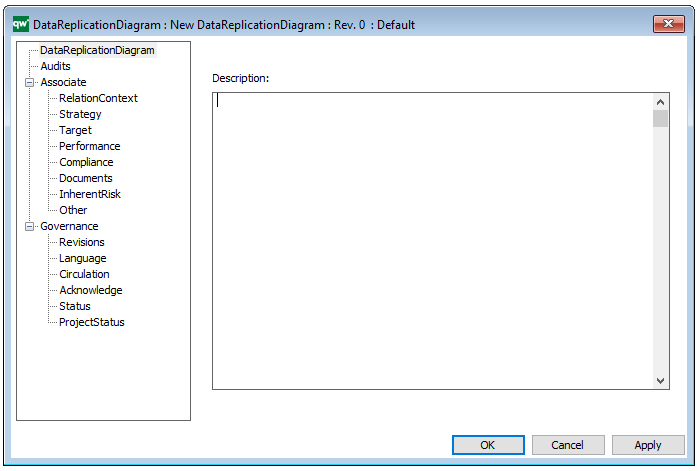
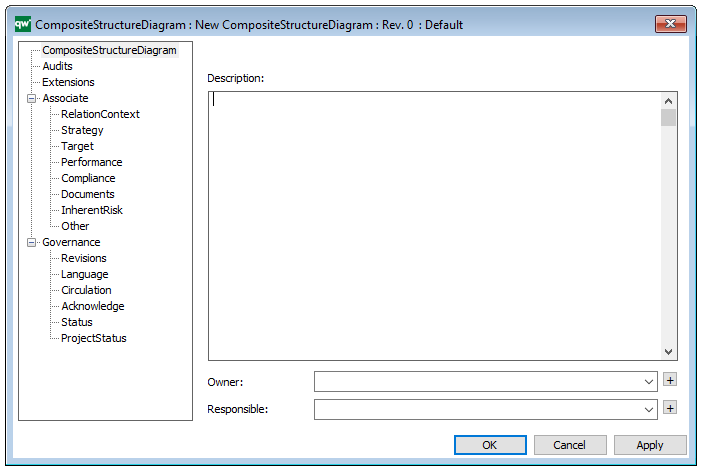
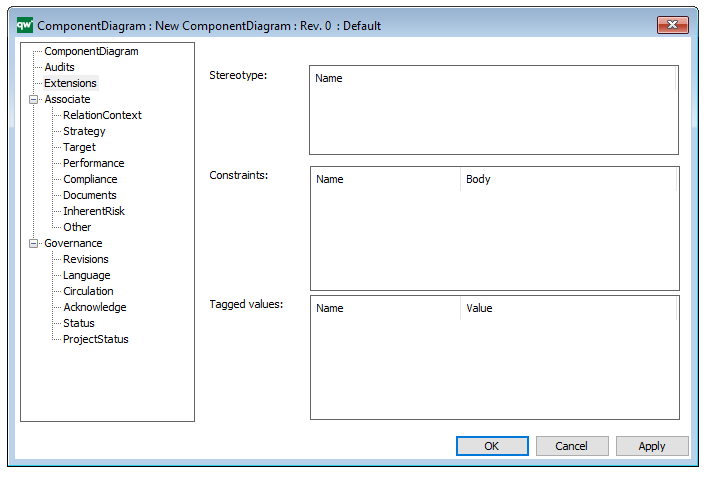
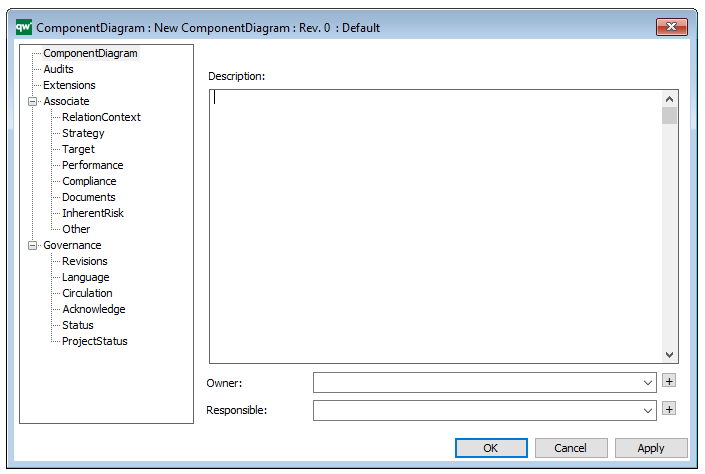
Properties and metadata: The Package Diagram template can for example retain the following information:

  • A description of the diagram
  • Link to the owner of the diagram
  • Link to the one responsible for the diagram
  • Audits (auto generated information regarding its current state and access rights)
  • Associated documents, diagrams and other objects
  • Inherent Risk detailing risk considerations
  • Governance information detailing information about the published diagram and who has been involved in the approval of the diagram

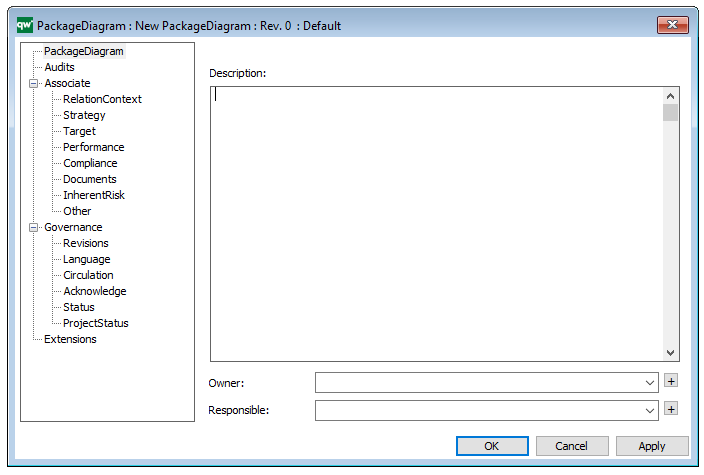
The above picture shows the properties dialogue window for the Package Diagram template, where you can view and edit the diagram’s properties in QualiWare Lifecycle Manager.

Use Case Diagram

Purpose: The purpose of the Use Case Diagram template is to document user interactions in a system context, as well as the context between different cases of user interactions. Below, you can see an example of a Use Case Diagram for the service at a restaurant:

UseCaseDiagram_2

Core concerns: The available objects you have to model use cases include: System Boundary, Actors, Use Cases, and connectors such as Association, Generalization, Include and Extend. Below, you can see an example of a Use Case Diagram for a booking system at a car rental service:

UseCaseDiagram_1

Relation to other diagrams: It is important to break down use cases into other diagrams such as Sequence Diagrams, Communication Diagrams, and Activity Diagrams templates for elaboration.

Properties and metadata: The Use Case Diagram can for example retain the following information:

  • A description of the diagram
  • Link to the owner of the diagram
  • Link to the one responsible for the accuracy of the diagram
  • Audits (auto generated information regarding its current state and access rights)
  • Associated documents, diagrams and other objects
  • Inherent Risk detailing risk considerations
  • Governance information detailing information about the published diagram and who has been involved in the approval of the diagram
  • Project status: information about budgeted and actual man-hours spent, percentage completed and the latest milestone, result and quality control of a change process.

In the picture below you can see the Use Case Diagram’s properties dialogue window, where the properties can be viewed and edited:

State Machine Diagram

Purpose: The purpose of the State Machine Diagram template is to document the dynamic behavior of a class or an object.

Core concerns: The State Machine Diagram template enables you to model States, Pseudo States, History States, Lines and Annotations. These can be connected by Transitions.

As such, the State Machine Diagram can be used to show the different states of a class or an object and how the class or object responds to various events by changing from one state to another.

Below, you can see an example of a State Machine Diagram for an ATM:

StateMachineDiagram_1

Relation to other templates: The State Machine Diagram can be a decomposition of a State and can also be derived from a Class. The State Machine Diagram template is related to, but cannot replace the State Event Diagram, which is used to document Event States and time dependent behavior of systems.

Properties and metadata: The State Machine Diagram can for example retain the following information:

  • A description of the diagram
  • Link to the owner of the diagram
  • Link to the one responsible for the diagram
  • Link to a specific State of an object the diagram specializes
  • Audits (auto generated information regarding its current state and access rights)
  • Associated documents, diagrams and other objects
  • Inherent Risk detailing risk considerations
  • Governance information detailing information about the published diagram and who has been involved in the approval of the diagram

The above picture shows the properties dialogue window for the State Machine Diagram where you can view and edit the diagram’s properties in QualiWare Lifecycle Manager.


State Event Diagram

Purpose: The purpose of the State Event Diagram template is to document the time dependent behavior of a system by showing the different States and State Transitions a system can go through.

Core concerns: The State Event Diagram enables you to model States and connect them with State Transitions. The State can be manipulated by opening its properties dialog and chose ‘Final State’ to illustrate the end of the state. The Start event is created by choosing ‘Start’ in the properties of the State Transition.

Below, you can see an example of a State Event Diagram for an ordering system:

StateEventDiagram_1

Relation to other templates: The State Event Diagram template should not be used to model Machines States. The State Machine Diagram template should be used to model these types of diagrams instead. The State Event Diagram offers a view of a system which is complimentary to those presented by for example, Use Case Diagrams Communication Diagrams, Component diagrams and Sequence Diagrams.

Properties and metadata: The State Event Diagram template ­­­­can for example retain the following information:

  • A description of the diagram
  • Link to the owner of the diagram
  • Link to the one responsible for the diagram
  • Audits (auto generated information regarding its current state and access rights)
  • Associated documents, diagrams and other objects
  • Inherent Risk detailing risk considerations
  • Governance information detailing information about the published diagram and who has been involved in the approval of the diagram

The above picture shows the properties dialogue window for the State Event Diagram template, where you can view and edit the diagram’s properties in QualiWare Lifecycle Manager.

Sequence Diagram

Purpose: The purpose of the Sequence Diagram template is to document interactions between processes over time. Below you can see a Sequence Diagram for a car rental’s booking system:

SquenceDiagram_1

Core concerns: Sequence Diagrams are typically used to document object interactions over time in a use case for an Information System. Objects are situated along vertical Lifelines. Horizontal arrows that travel between the lifelines in a set sequence are used to illustrate how message exchanges occur at a specific point in time. The objects available in this model are Lifelines, Combined Fragments, Interaction Use, Gates, Time Constraints and Duration Constraints and Messages. Below, you can see an alternate example of a Sequence Diagram for a car rental’s booking system:

SquenceDiagram_2

Relation to other templates: Though the customer can be included in this type of diagram, you should use the Customer Journey Map to document and analyze the customers’ interactions with your organization. If you want to map a simpler view of actors’ interactions with a system without details on time constraints, you can use a Use Case Diagram.

Properties and metadata: The Sequence Diagram can for example retain the following information:

  • A description of the diagram
  • Link to the owner of the diagram
  • Link to the one responsible for the accuracy of the diagram
  • Audits (auto generated information regarding its current state and access rights)
  • Associated documents, diagrams and other objects
  • Inherent Risk detailing risk considerations
  • Governance information detailing information about the published diagram and who has been involved in the approval of the diagram
  • Project status: information about budgeted and actual man-hours spent, percentage completed and the latest milestone, result and quality control of a change process.

In the picture below you can see the Sequence Diagram’s properties dialogue window, where the properties can be viewed and edited:

Integration View

Purpose: The purpose of the Integration View template is to document the routing of integrations between systems.

Core concerns: The Integration View template enables you to model Information Systems, System Components and External Entities (a source to or a receiver of information from a system), and connect them using Integration Flows.

Below is an example of an Integration View concerning the flow of test data:

Relation to other templates: The Integration View belongs to the Application layer of the architecture and is as such related to the Application Architecture Diagram, the Data Flow Diagram and the Component Diagram.

Properties and metadata: The Integration View template can for example retain the following information:

  • A description of the model
  • Audits (auto generated information regarding its current state and access rights)
  • Associated documents, diagrams and other objects
  • Inherent Risk detailing risk considerations
  • Governance information detailing information about the published diagram and who has been involved in the approval of the diagram

The above picture shows the properties dialogue window for the Integration View template where you can view and edit the diagram’s properties in QualiWare Lifecycle Manager.


Firewall

Purpose: The purpose of the Firewall template is to document network zones designated by firewalls.

Core concerns: The Firewall template enables you to model Zones, Computers, Networks and Firewall Policies to create a model of a firewall. A firewall is used to control the communication between different networks, typically for security reasons.

Graphical representation of objects:

A Firewall diagram will typically show the Zones of the firewall and the communication policies/rules (Firewall Policies) that exist between the zones. Below, you can see an example of a Firewall diagram containing Zones and Servers (represented by the Computer object):

Firewall_1

Relation to other templates: The Firewall template is a technology template and related to the Infrastructure Diagram.

Properties and metadata: The Firewall template ­­­­can for example retain the following information:

  • A description of the diagram
  • Link to Vendor and Hardware
  • Link to servers
  • Contract information
  • Details about resources, costs and benefits
  • Audits (auto generated information regarding its current state and access rights)
  • Associated documents, diagrams and other objects
  • Inherent Risk detailing risk considerations
  • Governance information detailing information about the published diagram and who has been involved in the approval of the diagram


The above picture shows the properties dialogue window for the Firewall template, where you can view and edit the diagram’s properties in QualiWare Lifecycle Manager.

Data Replication Diagram

Purpose: The purpose of the Data Replication Diagram template is to map a high-level view of the movement and replication of information between data sources.

Core concerns: The Data Replication Diagram template enables you to map Data Sources, Data Files, Data Transformations and Data Warehouses. These elements can then be connected by either a Data Extract or a Data Apply.

Graphical representation of the elements:

Below, is an example of a Data Replication Diagram for a commercial Data Warehouse:

DataReplicationDiagram_1

The model shows that the data is extracted from different data sources, transformed and applied to the Data Warehouse from which it is extracted, aggregated and either applied to sales, production or improvement.

Relation to other templates: The Data Replication Diagram offers a high-level data mapping. The Data Transformations contained in the Data Replication Diagram can be further decomposed into more detailed Data Mapping Diagrams.

Properties and metadata: The Data Replication Diagram template ­­­­can for example retain the following information:

  • A description of the diagram
  • Audits (auto generated information regarding its current state and access rights)
  • Associated documents, diagrams and other objects
  • Inherent Risk detailing risk considerations
  • Governance information detailing information about the published diagram and who has been involved in the approval it

The above picture shows the properties dialogue window for the Data Replication Diagram, where you can view and edit the diagram’s properties in QualiWare Lifecycle Manager.


Composite Structure Diagram

Purpose: The purpose of the Composite Structure Diagram template is to document the internal structure of a class, Class interactions with the environment and behavior of collaborations. The Composite Structure Diagram is part of the UML version 2.5.

Core concerns: The Composite Structure Diagram enables you to model Collaborations, Collaboration Use, Properties, Classes, Interfaces and Ports. These elements can be connected by Connectors, Dependencies, Interface Realizations and Usage.

Below, you can see an example of a Composite Structure Diagram for a car safety inspection:  

The Diagram shows internal structure of the Car-safety inspection class as well as the behavior of collaborations and the different classes’ interactions.

Relation to other templates: The Composite Structure Diagram is part of the UML templates QualiWare supports along with the Activity Diagram, Communication Diagram, Deployment Diagram, Class Diagram, State Diagram, Package Diagram, Component Diagram, Sequence Diagram, Use case diagram and Timing Diagram.

The Composite Structure Diagram can be defined as the components content along with the Component Diagrams, Class Diagrams, Classes, and Interfaces. The Component Object is a representation of a physical part from the system specification.

Properties and metadata: The Composite Structure Diagram ­­­­can for example retain the following information:

  • A description of the diagram
  • Link to the owner of the diagram
  • Link to the one responsible for the diagram
  • Extensions (Stereotypes, constraints and tagged values)
  • Audits (auto generated information regarding its current state and access rights)
  • Associated documents, diagrams and other objects
  • Inherent Risk detailing risk considerations
  • Governance information detailing information about the published diagram and who has been involved in the approval of the diagram

The above picture shows the properties dialogue window for the Composite Structure Diagram where you can view and edit the diagram’s properties in QualiWare Lifecycle Manager.

For more information: about the UML, please visit the Object Management Group’s Website, where you can find the complete specification.

Component Diagram

Purpose: The purpose of the Component Diagram is to specify the structure of and dependencies among the different components that make up a system.

Core concerns: The Component Diagram template enables you to model a system’s Components, Classes, Interfaces, Packages, Artifacts and Ports. They can be connected by Dependency, Interface Realization, Component Realization, Usage, Generalization or a generic Connector. Below, you can see an example of a simple Component Diagram consisting of Components connected by Dependencies.

ComponentDiagram

Using the properties dialogue, you can identify extensions such as Stereotype, Constraints and Tagged values:

Relation to other templates: The Component Diagram is part of the Application domain and shows how a system is structured. To model how users interact with a system you should use a Use Case Diagram, to model how interactions with the system through processes you should use the Sequence Diagram template. To model the structure of an application landscape you should use the Application Architecture Diagram.

Properties and metadata: The Component Diagram can for example retain the following information:

  • A description of the diagram
  • Link to the owner of the diagram
  • Link to the one responsible for the diagram
  • Audits (auto generated information regarding its current state and access rights)
  • Associated documents, diagrams and other objects
  • Inherent Risk detailing risk considerations
  • Governance information detailing information about the published diagram and who has been involved in the approval of the diagram

The above picture shows the properties dialogue window for the Component Diagram where you can view and edit the diagram’s properties in QualiWare Lifecycle Manager.