Business Process Diagram

Purpose: The purpose of the Business Process Diagram template is to enable workflow modelling using the industry standard BPMN (Business Process Modeling Notation).

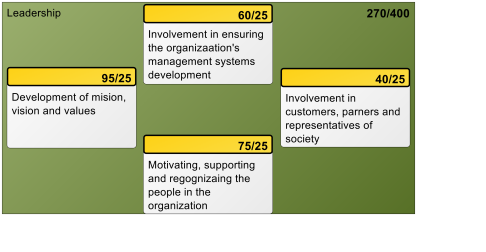
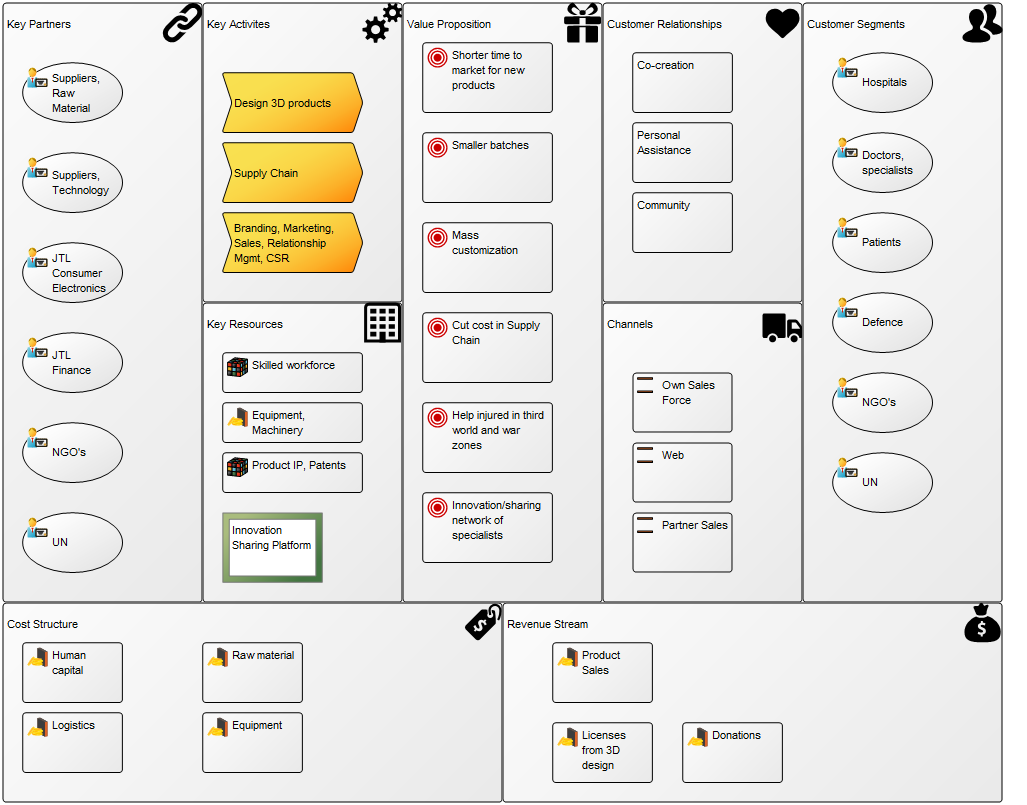
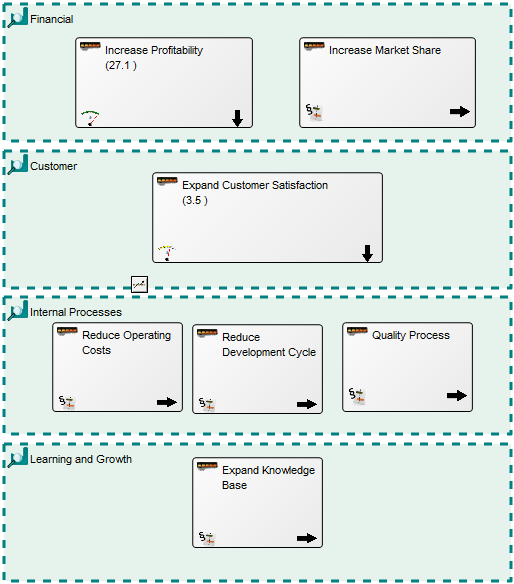
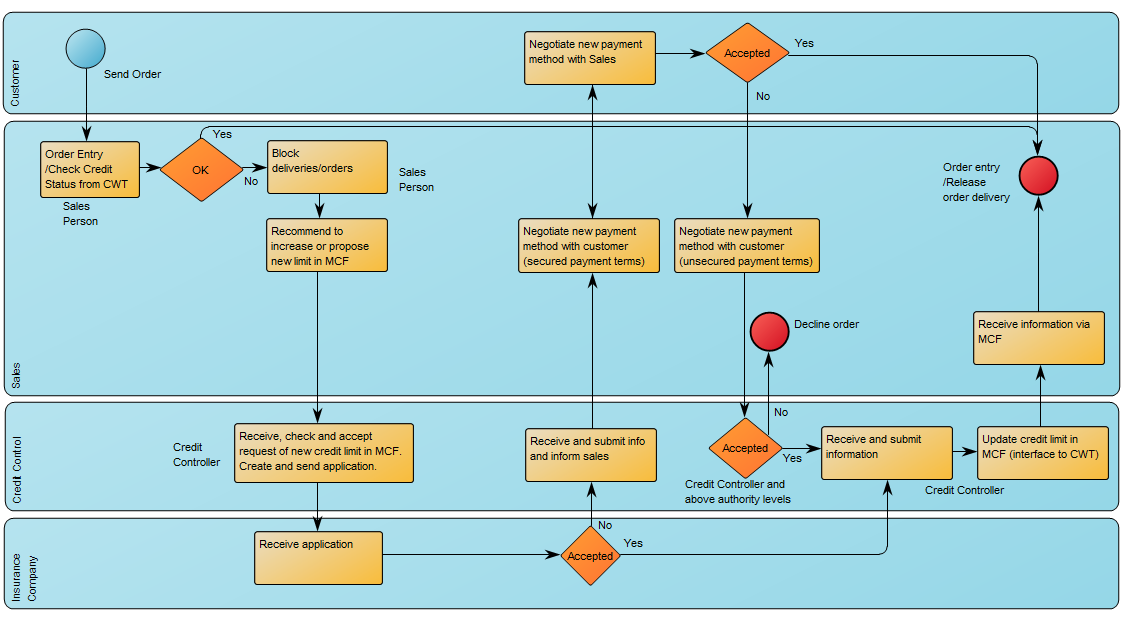
Core concerns: The Business Process Diagram template supply you with the BPMN icons that enable you to draw a workflow diagram. These icons include different types of events, activities, gateways, connectors, as well as pools, lanes and artifacts such as data objects and messages. The Business Process Diagram is typically used to illustrate business processes and software processes used in requirement documentation. Below is an example of a classic BPMN diagram with swimlanes:

BusinessProcessDiagram_1

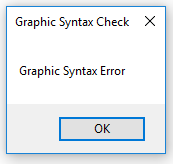
To ensure the right BPMN syntax, the Business Process Diagram template will continuously perform Graphic Syntax Checks while you model. When a graphic syntax error occurs, you will be met with an error message like the one shown below:

Other functionalities: The Business Process Diagram can enable the execution and automation of a process when the diagram is converted into XML type files.

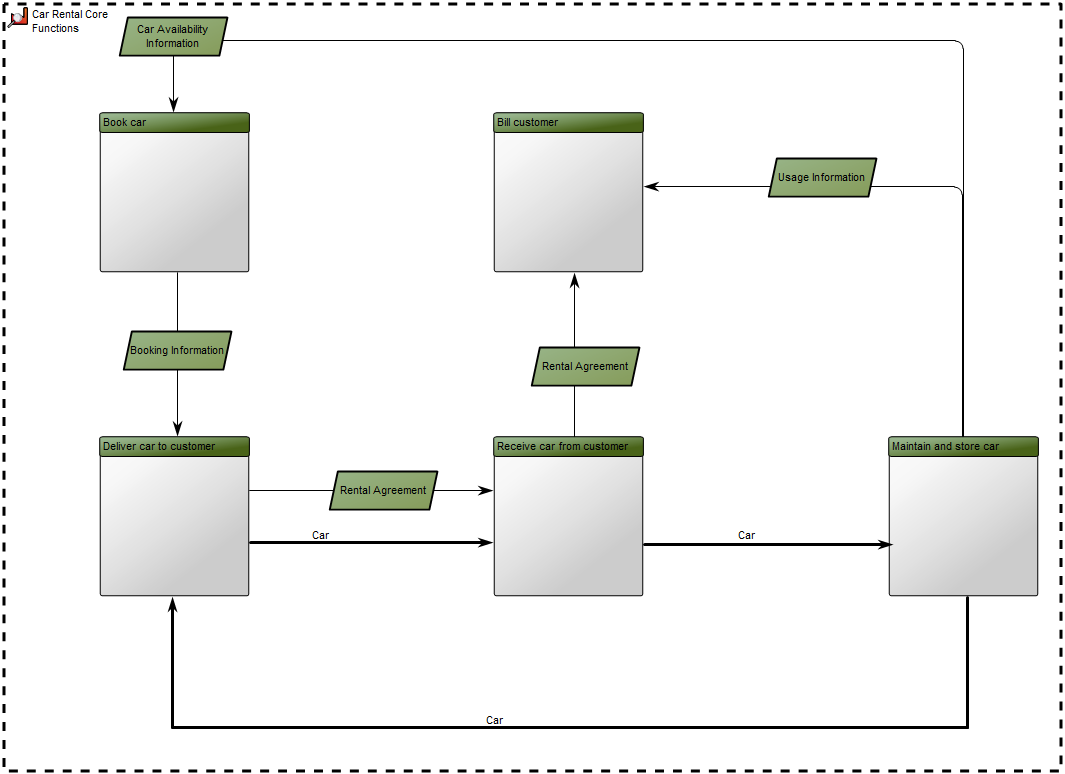
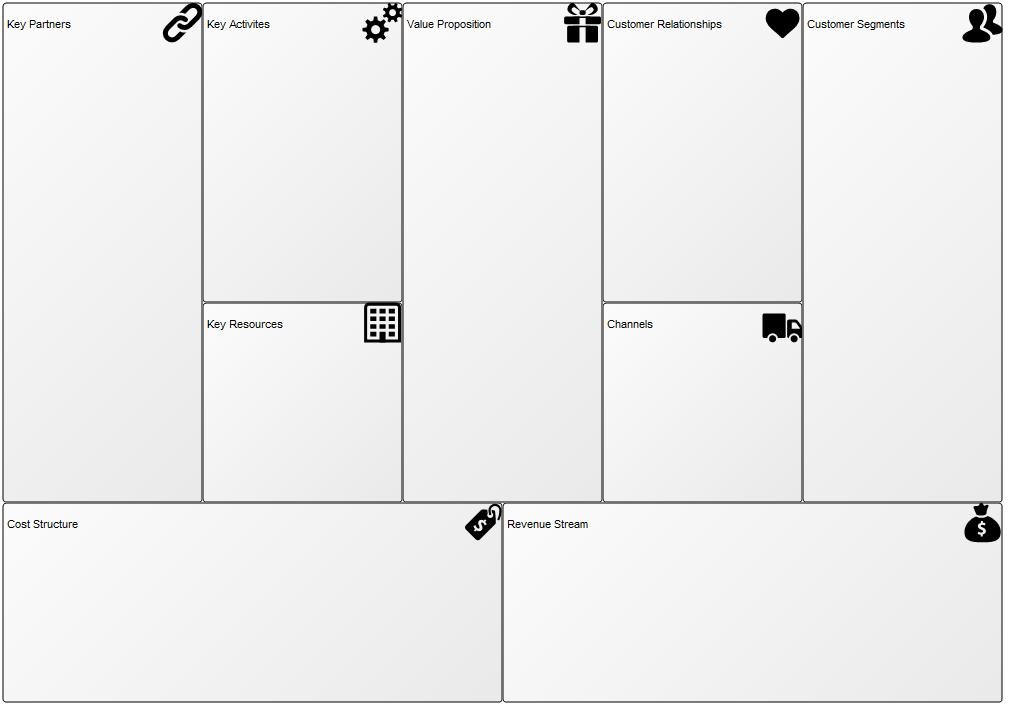
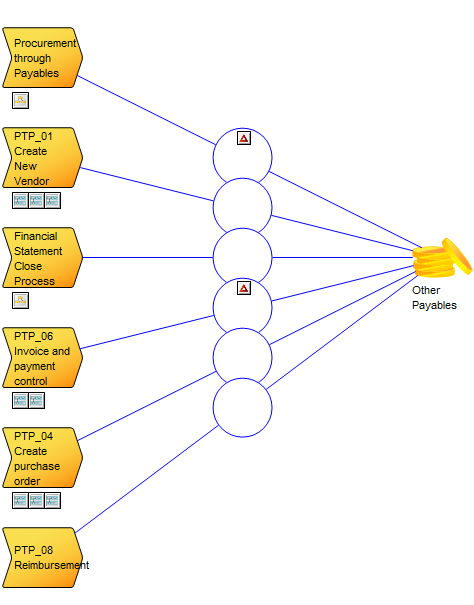
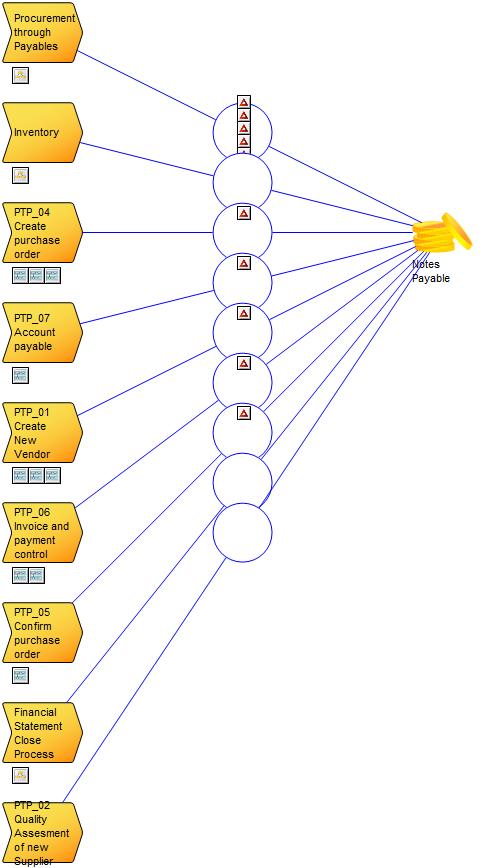
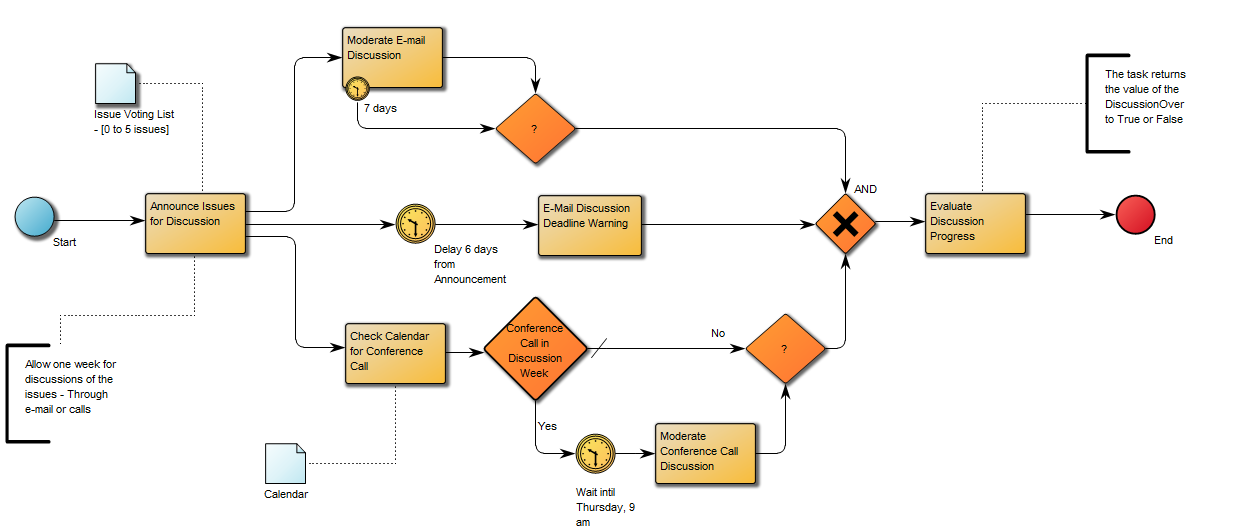
If you don’t wish to have a visible pool in your diagram, you can choose to have a ‘default pool’ that doesn’t have to be graphically represented. You can see an example of a diagram without pool and lanes below:

BusinessProcessDiagram_2

Relation to other templates: The Business Process Diagram template is exclusively aimed at modeling using the BPMN standard. If the BPMN is not chosen as a mandatory standard, the WorkFlow Diagram template, which has fewer syntax limitations, can be used instead.

The Business Process Diagram is typically linked as a decomposition of a Business Process contained in a Business Process Network template.

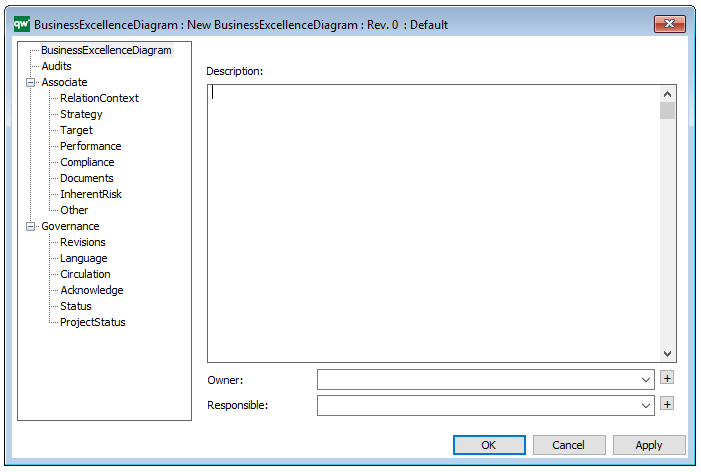
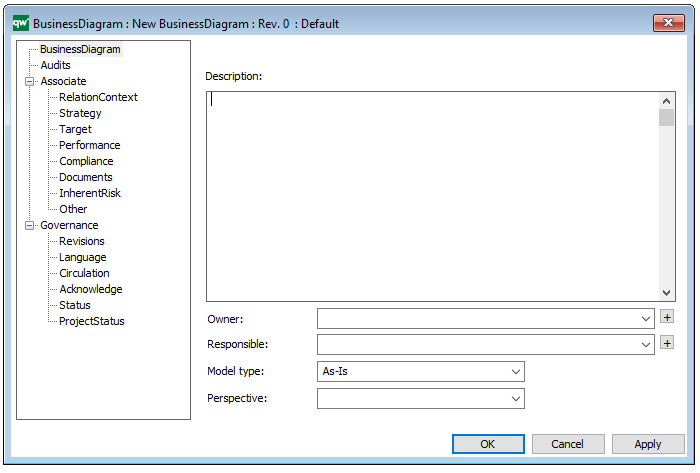
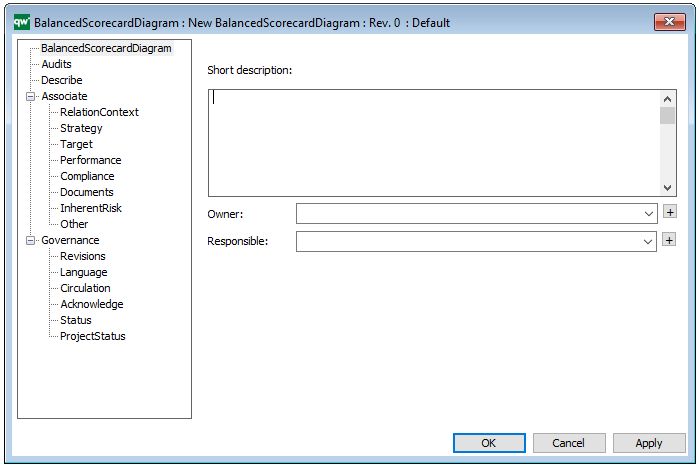
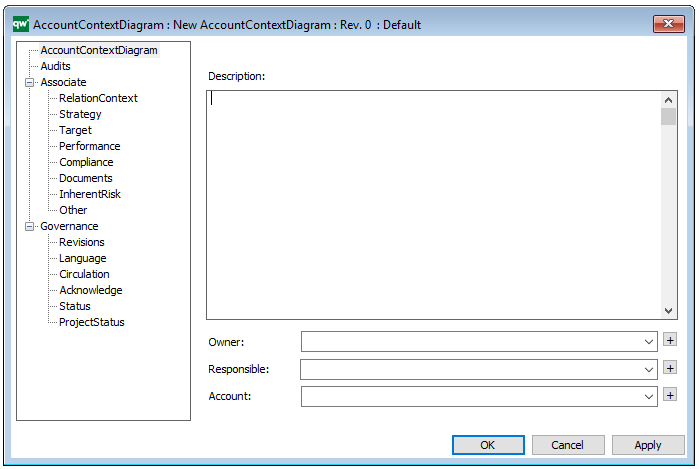
Properties and metadata: The Business Process Diagram can for example retain the following information:

  • Description of the diagram
  • Expression and query language
  • Link to the owner of the process
  • Link to the one responsible for executing the process
  • Audits (auto generated information regarding its current state and access rights)
  • Associated documents, diagrams and other objects
  • Inherent Risk detailing risk considerations
  • Governance information detailing information about the published diagram and who has been involved in the approval of the diagram

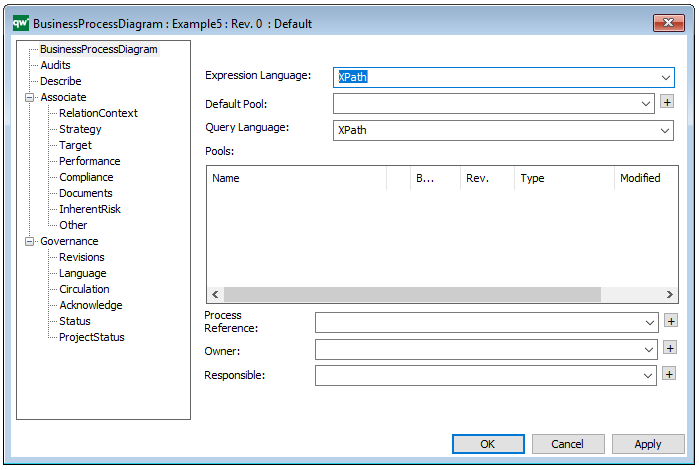
In the picture above you can see the Business Process Diagram’s properties dialogue window, where the diagram’s properties can be viewed and edited:

For more information: about the BPMN standard please visit OMG’s dedicated website.

Business Excellence Diagram

Purpose: The purpose of the Business Excellence Diagram template is to describe a measuring tool based on The European Foundation for Quality Management Excellence Model (EFQM).

Core concerns: The Business Excellence Diagram enables you to model Business Scopes, Criterion and Sub Criterion. These aspects can then be connected by Criterion Influencers.

Below, you can see an example of a Business Excellence Diagram for the Leadership of an organization. The diagram is structured according to the EFQM and shows the overall scores for the leaderships performance:

Other areas covered in the EFQM are Policy & Strategy, People, Partnerships & Resources, Processes, Customer Results, People Results, Society Results and Key Performance Indicators.

Relation to other templates: The Business Excellence Diagram is a strategic template that is complimentary to the Business Capability Model, Stakeholder Model, Business Canvas, and Strategy Model

Properties and metadata: The Business Excellence Diagram ­­­­can for example retain the following information:

  • A description of the diagram
  • Link to the owner of the diagram
  • Link to the one responsible for the diagram
  • Audits (auto generated information regarding its current state and access rights)
  • Associated documents, diagrams and other objects
  • Inherent Risk detailing risk considerations
  • Governance information detailing information about the published diagram and who has been involved in the approval of the diagram

The above picture shows the properties dialogue window for the Business Excellence Diagram template, where you can view and edit the diagram’s properties in QualiWare Lifecycle Manager.

For more information: To learn more about the EFQM, please visit their website, where you can also find an overview of the EFQM Excellence Model.

Business Diagram

Purpose: The purpose of a Business Diagram is to show the functional structure and relationships of the whole or part of an organization.

Core concerns: The Business Diagram template enables you to model Business Functions, Information Systems, Inventory, Business Scope, Lines of Business, Information Flow and Logistical Flow. The diagram’s syntax can be extended to also include strategic elements such as Goals, Objectives, Stakeholders and Performance Indicators.

The Business Diagram should be broken down into several levels of recurring Business Diagram templates. In the model below, you can see an example of a high-level Business Diagram showing Business Functions and their Information Flows and Logistical Flows –  describing the flow of products and services – in this case for a car rental service.

The Business Functions are placed with the operational functions in the bottom together with the Logistical Flow and with management control at the top of the Business Diagram.

On lower levels (decompositions) of Business Diagrams, Information Systems are placed close to the Business Functions that are responsible for or own the Information Systems.

Relation to other templates: The Business Diagram can be used as an addition to a Business Process Network and Strategy Models, giving a practical view of how the organizations functions fit together, illuminating interdependencies.

Properties and metadata: The Business Diagram can for example retain the following information:

  • A description of the diagram
  • Link to the owner of the Diagram
  • Link to the one responsible for the Diagram
  • Indication of the diagram portrays an as-is situation or a to-be situation
  • The Perspective can be defined as either: Holistic, Sub-functional, Process, or IT Focused.
  • Audits (auto generated information regarding its current state and access rights)
  • Associated documents, diagrams and other objects
  • Inherent Risk detailing risk considerations
  • Governance information detailing information about the published diagram and who has been involved in the approval of the diagram

The above picture shows the properties dialogue window for the Business Diagram where you can view and edit the diagram’s properties in QualiWare Lifecycle Manager.

Business Canvas

Purpose: The Business Canvas, is a strategic management and entrepreneurial template. It allows you to describe, design, challenge, invent, and pivot your business model.

Core Concerns: The core elements of the business canvas are framework cells that define a strategic or organizational entities and, if needed, connections between them. The Business Model can be structured any way you wish. The most well know structure of a business model is Alexander Osterwalder’s Business Model Canvas.

BusinessCanvas_1

The above picture shows a blank Business Model Canvas where each area is represented by a framework cell.

The strategic or organizational entities can then be enriched with an extended portfolio of strategic symbols such as vision, mission, goals, stakeholders, information systems and business processes.

Full content list of the extended portfolio:

  • Vision
  • Mission
  • Business Object
  • Market
  • Competitive Advantage
  • Technology
  • Competence
  • Capability
  • Performance Indicator
  • Business Function
  • Business Process
  • Organization Unit
  • Stakeholder
  • Information System
  • External Entity
  • Location
  • Channel
  • Goal
  • Opportunity
  • Threat
  • Trend
  • Material Asset
  • Intellectual Capital Asset
  • Business Rule
  • Key Performance Indicator


The picture below shows a Business Model Canvas that is filled out with symbols from the extended portfolio.

BusinessCanvas_2

Relation to other templates: The Business Canvas can link to multiple related templates detailing the businesses capabilities, business processes, strategy and more.

Properties and metadata: The Business Canvas Diagram can for example retain the following information:

  • A description of the diagram
  • Link to the owner of the application architecture
  • Link to the one responsible for the application architecture
  • Audits (auto generated information regarding its current state and access rights)
  • Associated documents, diagrams and other objects
  • Inherent Risk detailing risk considerations
  • Governance information detailing information about the published diagram and who has been involved in the approval of the diagram


Balanced Scorecard Diagram

Purpose: The purpose of the Balanced Scorecard Diagram is to model Balanced Scorecards, as described by Robert Kaplan and David Norton in 1992.

Core concern: Usually, a Balanced Scorecard Diagram template measures the state of the enterprise via Key Performance Indicators that are categorized into four different perspectives using Business Scopes. Aside from this, the template enables you to model general concepts and cause/effect.

Below, you can see an example of a Balanced Scorecard Diagram:

BalancedScoracardDiagram_1

Relation to other templates: The Balanced Scorecard Diagram can be used to create a Performance Evaluation Model or a Strategic Management Diagram the Key Performance Indicators it contains can be broken down into Performance Diagrams offering a detailed view of how the organization performs. If CXO dashboards are to be created, the Strategy Model should be used instead.

Properties and metadata: The Balanced Scorecard Diagram can for example retain the following information:

  • A description of the diagram
  • Link to the owner of the diagram
  • Link to the one responsible for the diagram
  • Audits (auto generated information regarding its current state and access rights)
  • Associated documents, diagrams and other objects
  • Inherent Risk detailing risk considerations
  • Governance information detailing information about the published diagram and who has been involved in the approval of the diagram.

The above picture shows the properties dialogue window for the Balanced Scorecard Diagram, where you can view and edit the diagram’s properties in QualiWare Lifecycle Manager.

Account Context Diagram

Purpose: The purpose of the Account Context Diagram is to enable financial risk management by illustrating which processes create transactions on a given account, and which risks are related to this transaction.

Core concerns: The Account Context Diagram enables you to model Accounts, Business Processes and link them with influences.

Below, you can see an example of an Account Context Diagram for the account ‘Other Payables’:

The risks are linked to the influencers and shown on the diagram. For example, in the above diagram, both risks are: ‘Goods received not invoiced, not recognized as a liability at period end’.

It is possible to link multiple risks to each influence. In the following diagram, you can see a similar Account Context Diagram, where several risks are connected to a single influence:

Relation to other templates: The Account Context diagram is for financial risk management. It is related to the Control Coverage Map and the Heat Map templates, which can be generated based on the information in the Account Context Diagram.

Properties and metadata: The Account Context Diagram ­­­­can for example retain the following information:

  • A description of the diagram
  • Link to the owner of the diagram
  • Link to the one responsible for the diagram
  • Link to the Account shown in the diagram
  • Audits (auto generated information regarding its current state and access rights)
  • Associated documents, diagrams and other objects
  • Inherent Risk detailing risk considerations
  • Governance information detailing information about the published diagram and who has been involved in the approval of the diagram

The above picture shows the properties dialogue window for the Account Context Diagram where you can view and edit the diagram’s properties in QualiWare Lifecycle Manager.