Environmental Impact Diagram

Purpose: The purpose of the Environmental Impact Diagram template is to document the environmental aspects and impacts for an Activity or Business Process.

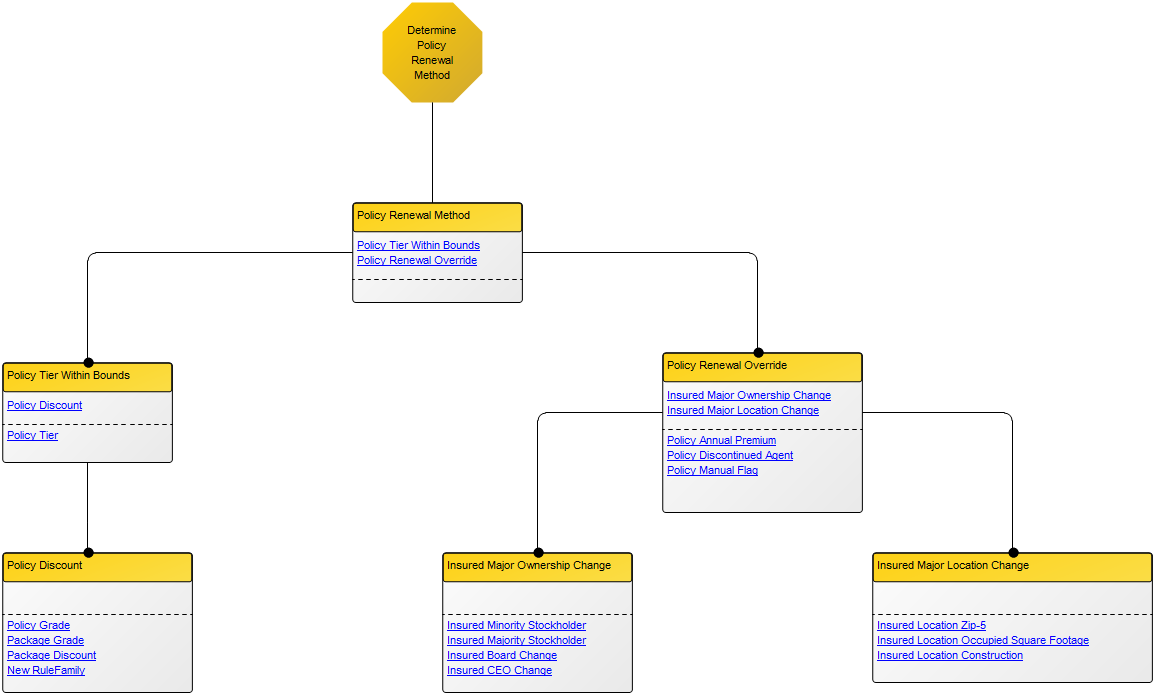
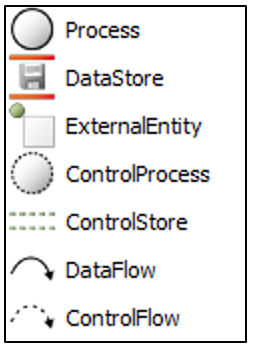
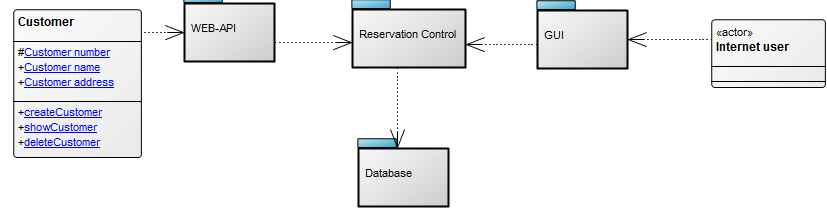
Core concerns: The Environmental Impact Diagram enables you to model Business Functions, Activities, Business Objects, Environmental Aspects (Environmental Aspect, Environmental Impact, Health and safety impact) and Business Scopes. These elements can then be connected by Impact Quantities.

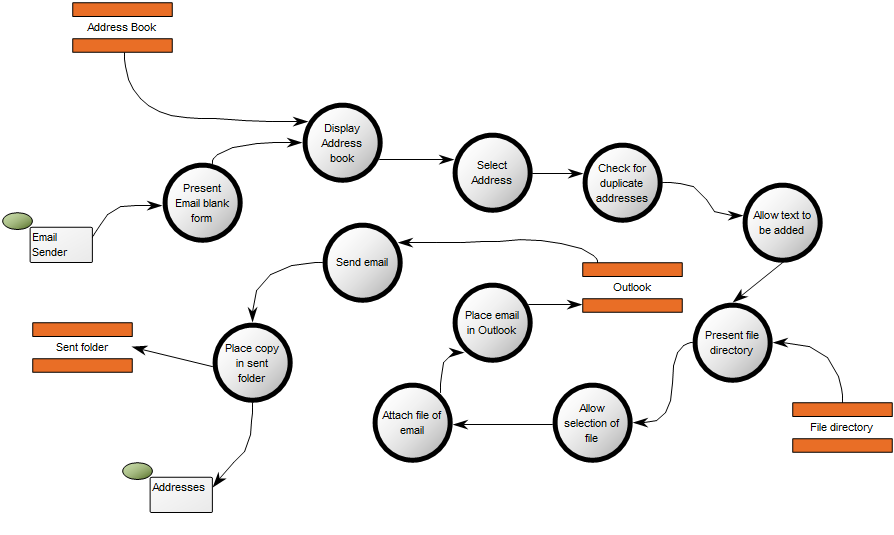
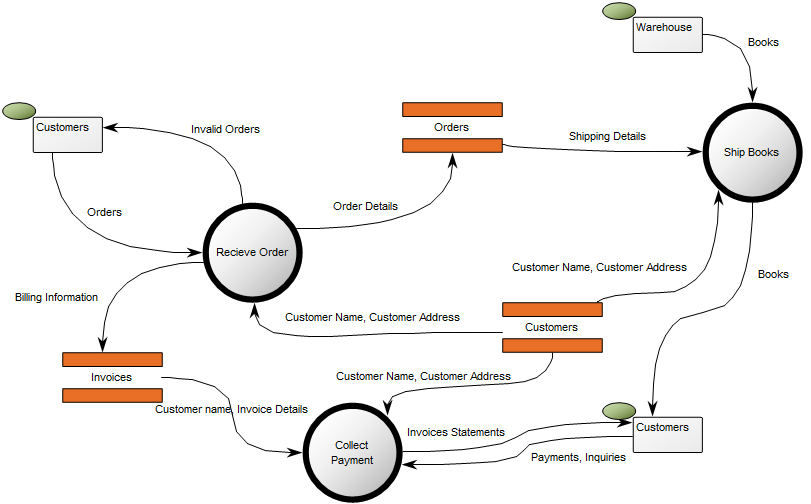
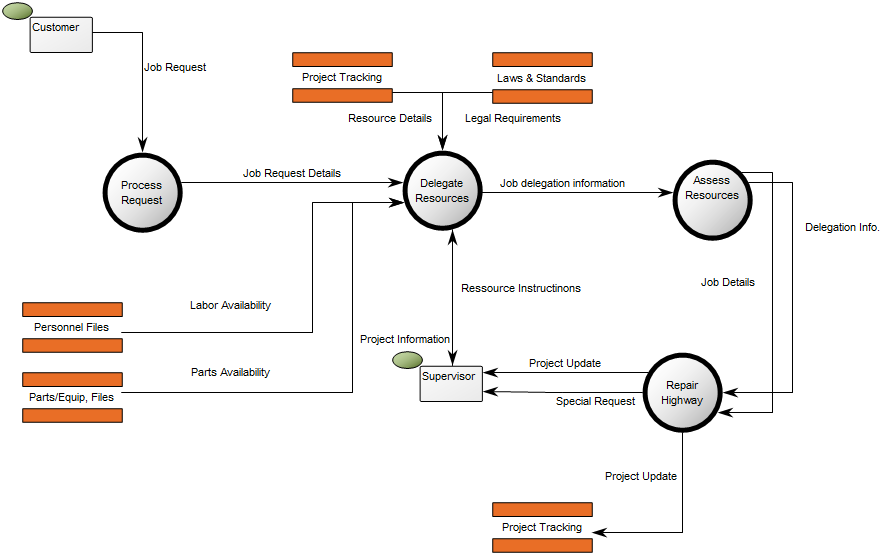
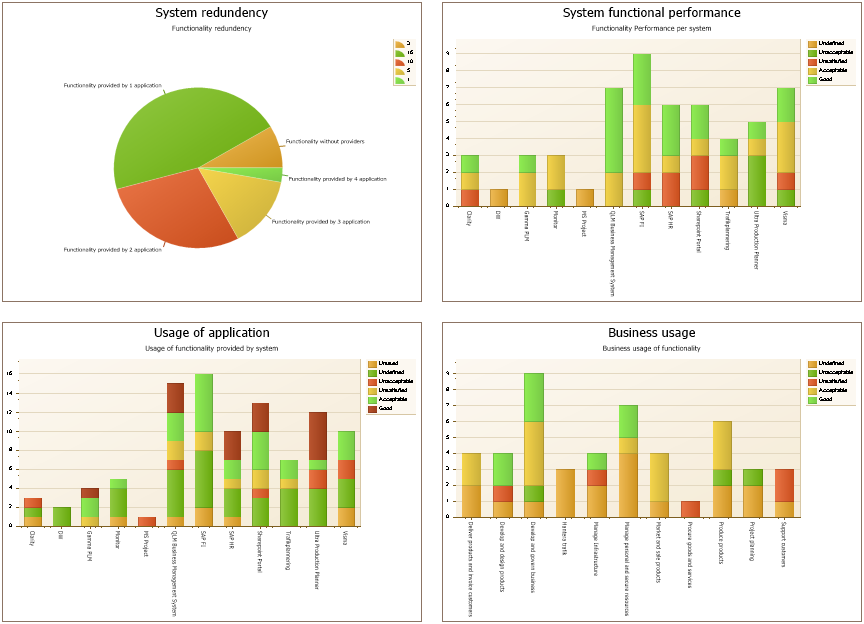
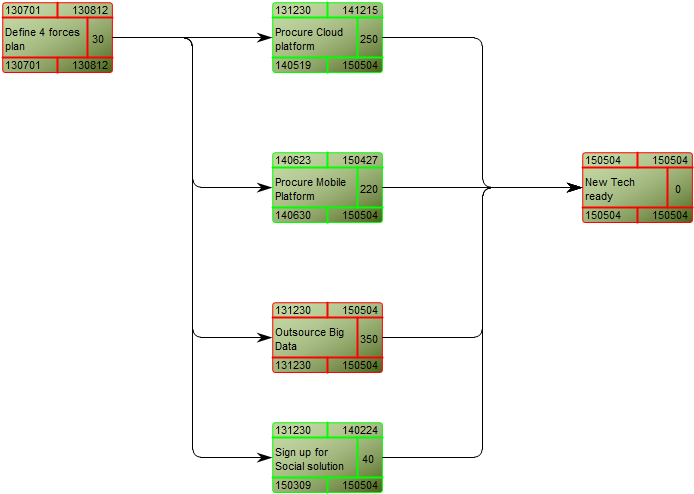
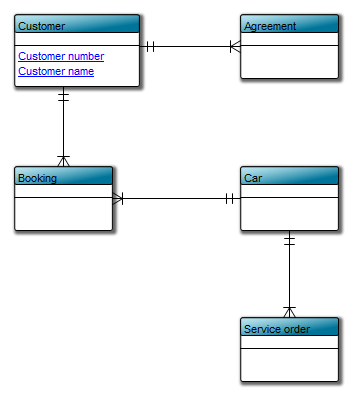
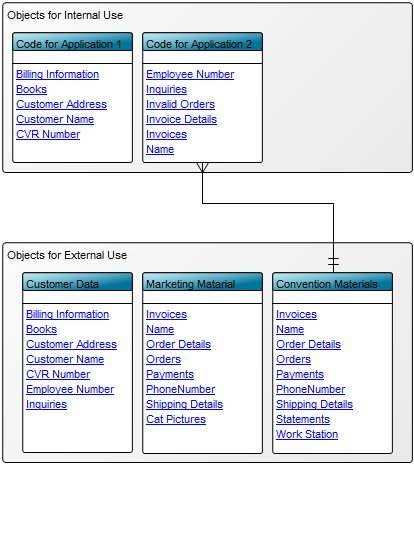
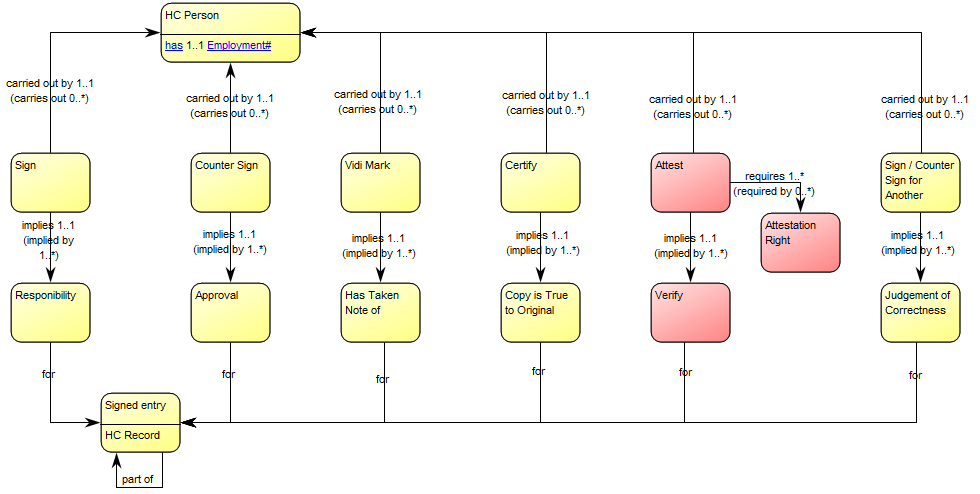
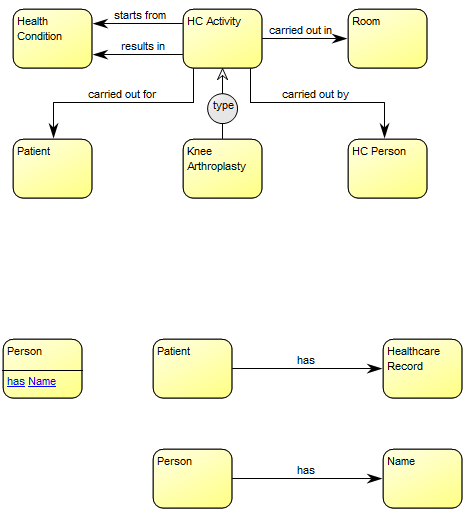
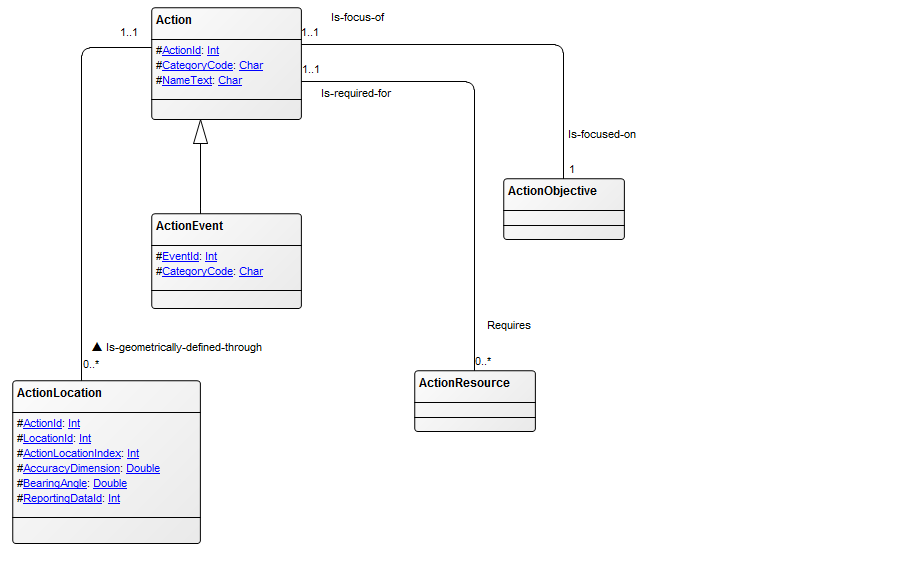
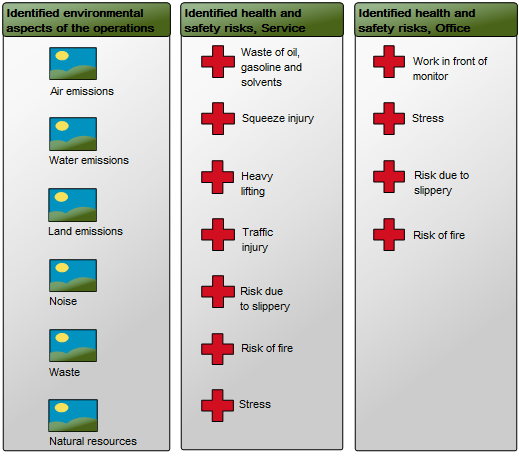
Below, you can see an example of an Environmental Impact Diagram, detailing the Environmental aspects and Health and safety impact:

EnvironmentalImpactDiagram_1

The diagram shows all identified aspects and modes of impact for one or more specific processes.

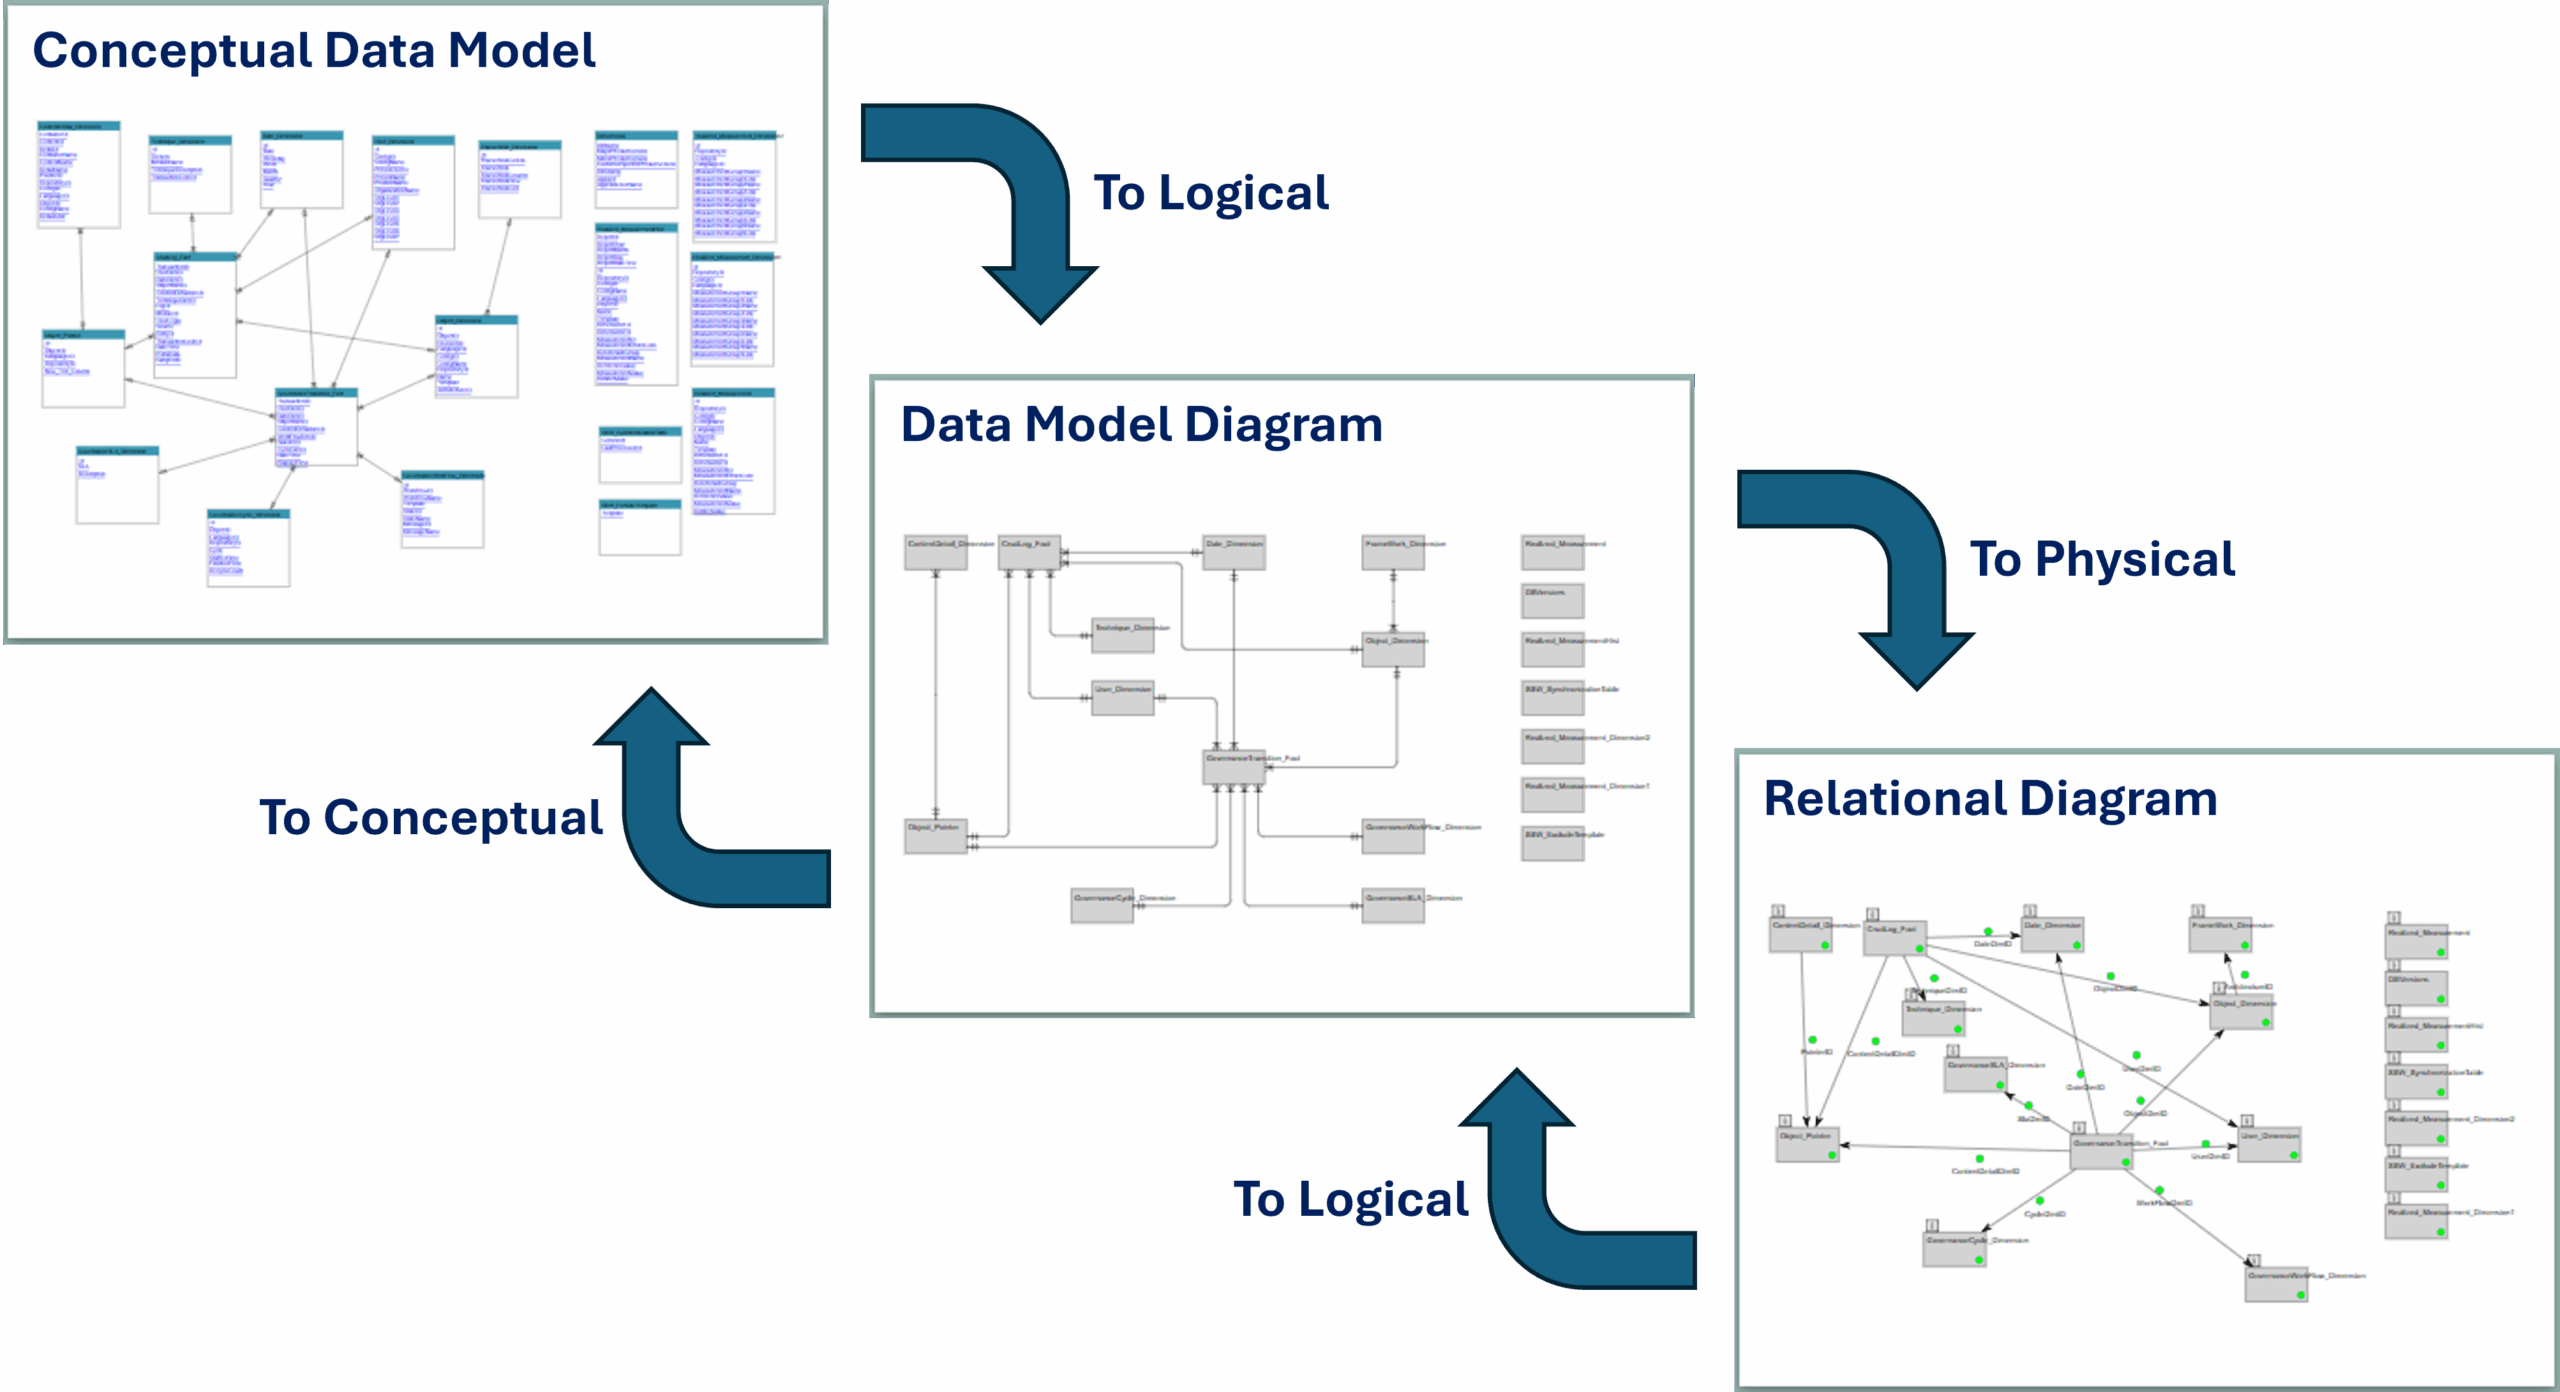
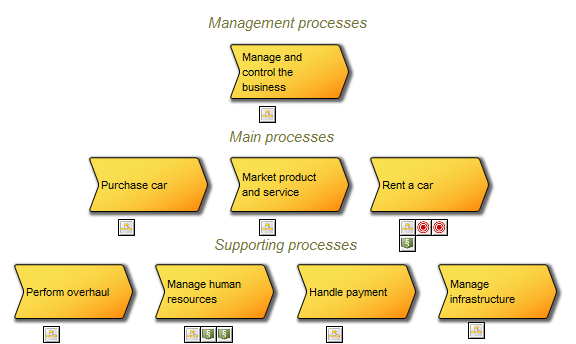
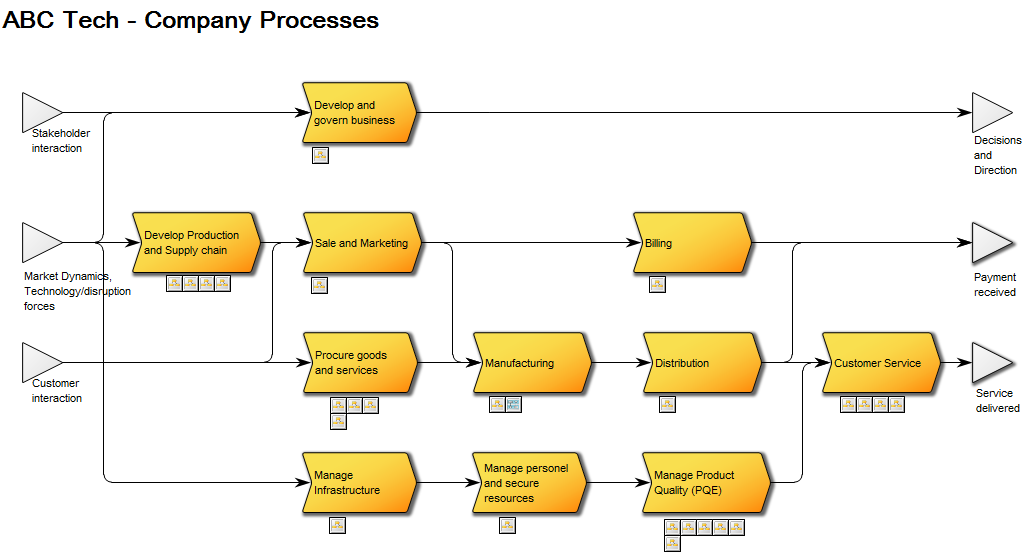
Relation to other templates: The Environmental Impact Diagram is related to the Lifecycle Assessment diagram as well as templates containing Activities, Business Functions, Lines of Business, and Logistical Flows. As such, it is related to, for example, Business Process Diagrams, Workflow Diagrams, Business Diagrams, and Strategy Models.

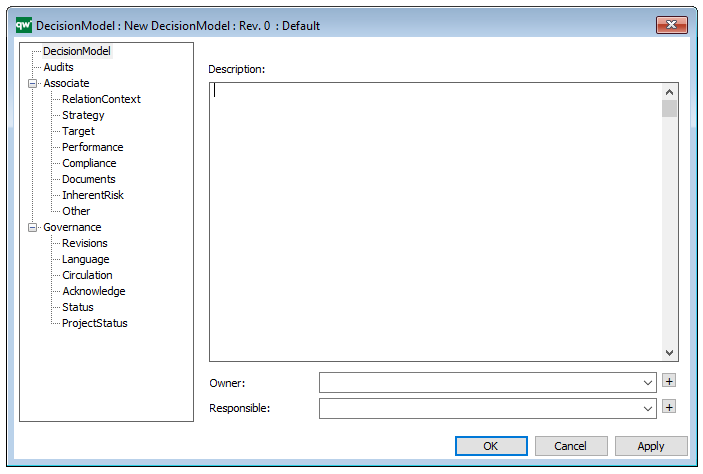
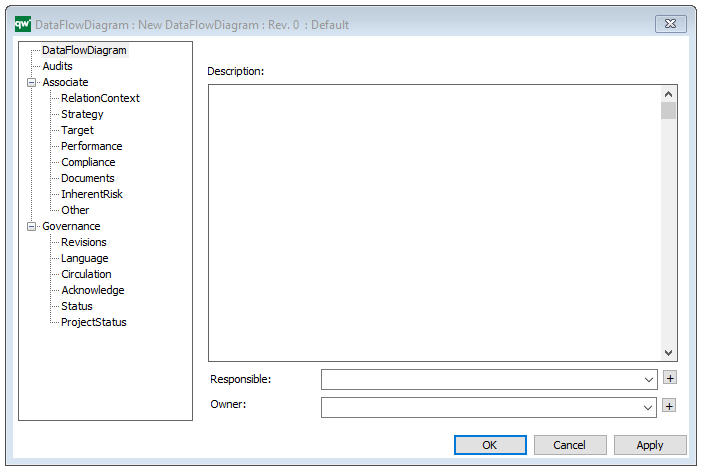
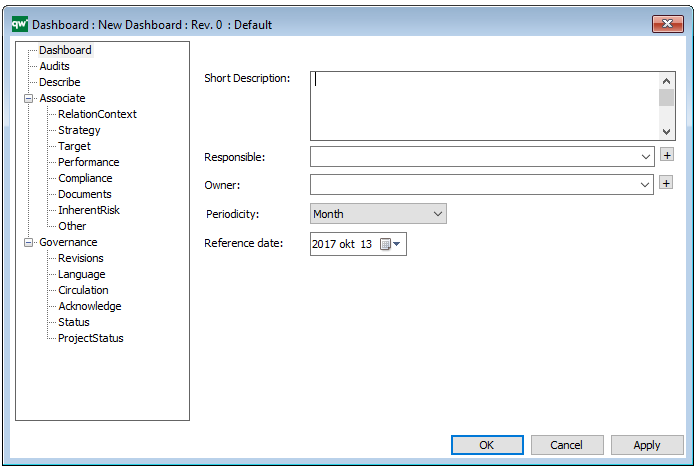
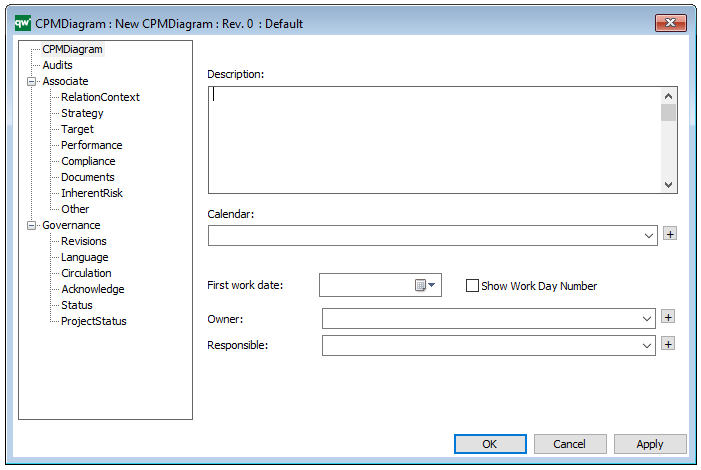
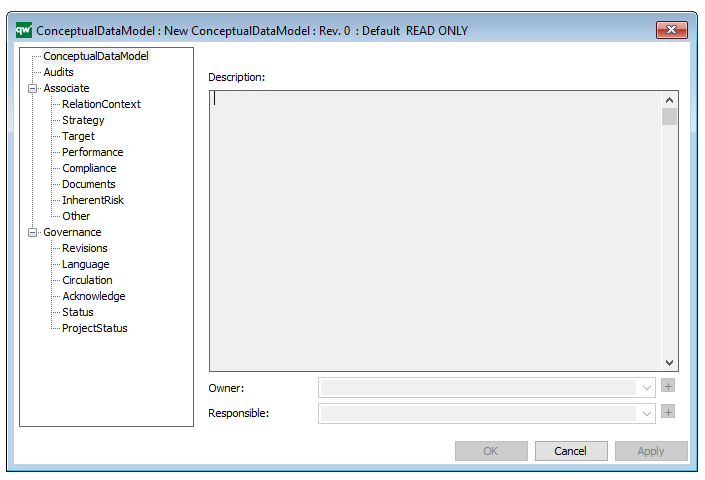
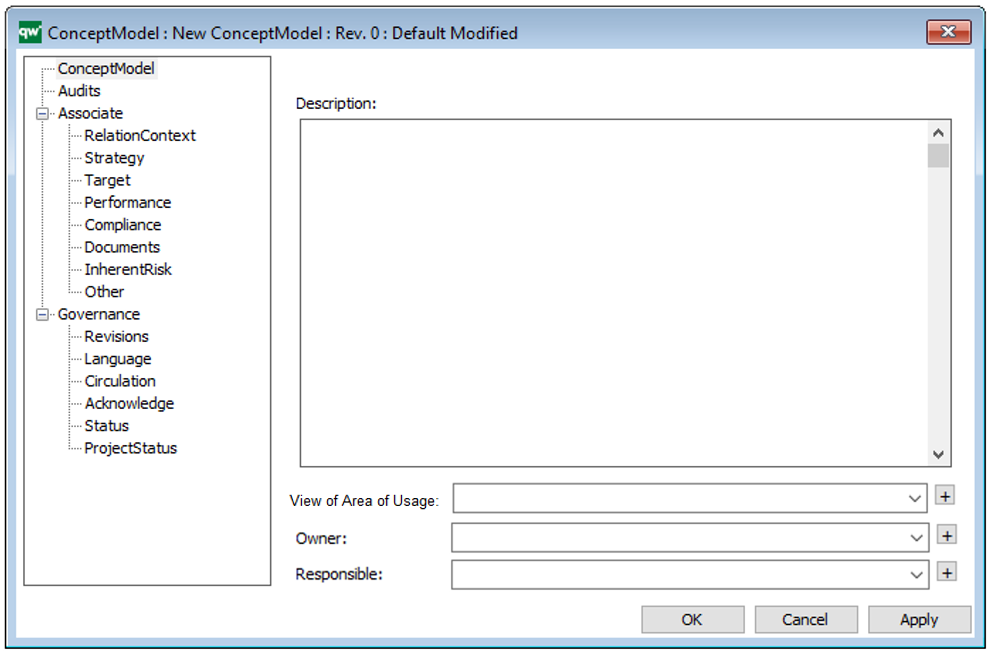
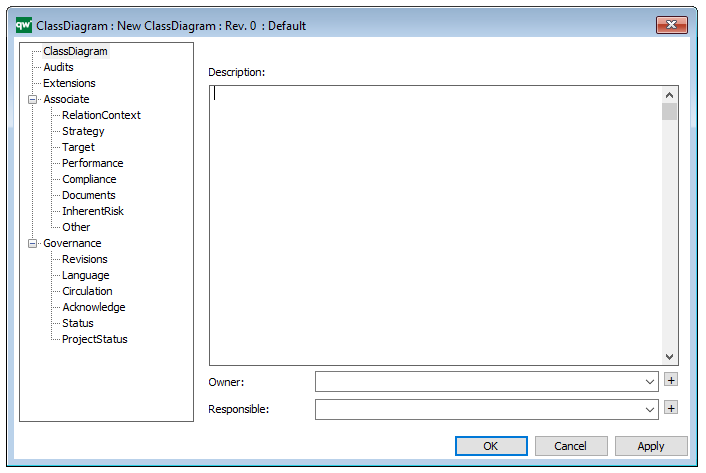
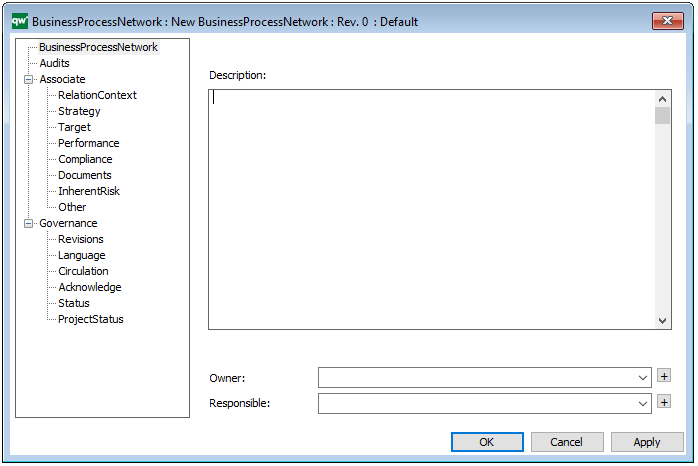
Properties and metadata: The Environmental Impact Diagram template ­­­­can for example retain the following information:

  • A description of the diagram
  • Link to the owner
  • Link to the responsible
  • Audits (auto generated information regarding its current state and access rights)
  • Associated documents, diagrams and other objects
  • Inherent Risk detailing risk considerations
  • Governance information detailing information about the published diagram and who has been involved in the approval of the diagram

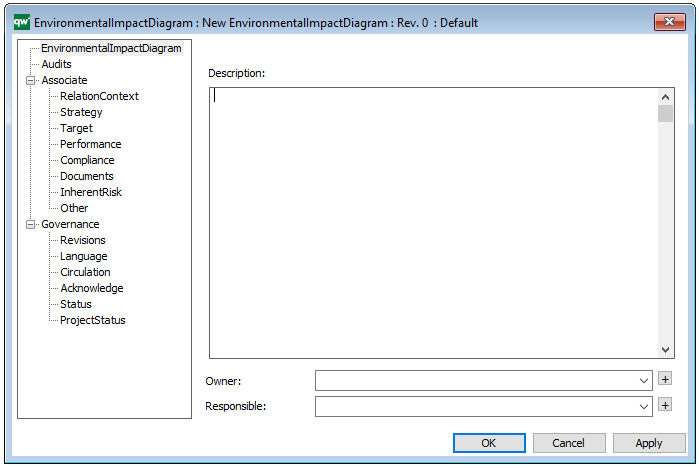
The above picture shows the properties dialogue window for the Environmental Impact Diagram, where you can view and edit the diagram’s properties in QualiWare Lifecycle Manager.

Decision Model

Purpose: The purpose of the Decision Model template is to document complex decisions by modelling decision trees that illustrates decision gates. Below you can see an example of a Decision Model:

DecisionModel_1

Core concerns: Complex decisions can be documented as decision trees. The model illustrates the Business Decision and its underlying Rule Families. The Rule Families can contain Rule Family Tables, that precisely describe the outcome of a given set of variables. Below you can see an example of a Rule Family Table:

DecisionModel_2

Relation to other templates: Where the Decision Model template illustrates the decision gates, the end to end process is described in either a Work Flow Diagram or a Business Process Diagram.

Properties and metadata: The Decision Model can for example retain the following information:

  • A description of the diagram
  • Link to the owner of the diagram
  • Link to the one responsible for the accuracy of the diagram
  • Audits (auto generated information regarding its current state and access rights)
  • Associated documents, diagrams and other objects
  • Inherent Risk detailing risk considerations
  • Governance information detailing information about the published diagram and who has been involved in the approval of the diagram
  • Project status: information about budgeted and actual man-hours spent, percentage completed and the latest milestone, result and quality control of a change process.

In the picture below you can see the Decision Model’s properties dialogue window, where the information can be viewed and edited:


Data Flow Diagram

Purpose: The purpose of the Data Flow Diagram is to document a system’s or part of a system’s data flows; the data input the system (or a process within the system) consumes and the data output the system produces.

Core concerns: The Data Flow Diagram enables you to model Processes, Data Stores, External Entities, Control Processes and Control Stores. These elements can then be connected by either Data Flows or Control Flows.

Graphical representation of the elements:

The Data Flow Diagram can show different levels of processes within a system that exchange data, and illustrate how those exchanges occur. As such, the model can document a system’s functional hierarchies.

Below, you can see an example of a Data Flow Diagram showing the Data Flows between several Data Stores, Processes and External Entities in a Bookshop:

DataFlowDiagram_2

The next example shows the Data Flow between process, Data Stores and External Entities for a Highway Repair Service:

DataFlowDiagram_1

The final example shows the Data Flows between Processes, Datastores and External Entities in an Outlook Mailbox:

dfd

Relation to other templates: The Processes in the Data Flow Diagram can be decomposed into more detailed Data Flow Diagrams to comprise the total functional model. The top level of a Data Flow Diagram is sometimes called a Context Diagram. However, in QLM we use the Data Flow Diagram template for the higher levels as well as the more detailed ones.

The Data Flow Diagram can be a decomposition of an Information System. It can offer a more detailed view of Data Flows than, for example, the Application Architecture Diagram.

An Information System could likewise be decomposed into a Business Process Diagram which offers a complimentary view less concerned with Data Stores and Data Flow, and more concerned with Activity Flow.

Properties and metadata: The Data Flow Diagram template ­­­­can for example retain the following information:

  • A description of the diagram
  • Link to the owner of the diagram
  • Link to the one responsible for diagram
  • Audits (auto generated information regarding its current state and access rights)
  • Associated documents, diagrams and other objects
  • Inherent Risk detailing risk considerations
  • Governance information detailing information about the published diagram and who has been involved in the approval of the diagram

The above picture shows the properties dialogue window for the Data Flow Diagram template, where you can view and edit the diagram’s properties in QualiWare Lifecycle Manager.

Dashboard

Purpose: The purpose of the Dashboard template is to publish selections of Business Charts targeting different stakeholders. It should be used to gather a series of relevant or connected Business Charts to provide a dashboard-like overview.

Core concerns: The Dashboard template enables you to gather Business Charts, Key Performance Indicators, Performance Indicators and General Concepts to create stakeholder specific views of analyzed data. For example, an Enterprise Architect could find a Dashboard containing Business Charts relevant to the usage and governance of the Enterprise Architecture useful.

Below, you can see examples of different Dashboards presenting an array of Business Charts:

Dashboard_1


Dashboard_2

Relation to other templates: The Dashboard template is closely connected to the Business Chart template, as the Dashboard publishes the charts the Business Chart template generates.

Properties and metadata: The Dashboard can for example retain the following information:

  • A description of the Dashboard
  • Link to the owner of the Dashboard
  • Link to the one responsible for the Dashboard
  • Audits (auto generated information regarding its current state and access rights)
  • Associated documents, diagrams and other objects
  • Inherent Risk detailing risk considerations
  • Governance information detailing information about the published diagram and who has been involved in the approval of the diagram

The above picture shows the properties dialogue window for the Dashboard template where you can view and edit the dashboard’s properties in QualiWare Lifecycle Manager.

CPM Diagram

Purpose: The Purpose of the Critical Path Method Diagram (CPM Diagram) is to reveal the critical path through a project, i.e. the list of activities that needs special attention since a delay in these activities will delay the whole project.

Core concerns: The CPM Diagram enables you to model Project Activities and connect them with Activity Paths. The Project Activities are then enriched with information about latest and earliest dates for start and finish as well as information about duration and slack for each Project Activity.

This makes it possible to calculate the probability of finishing the project within the planned timeframe, and to successively improve and detail the plan.

Below, you can see an example of a CPM Diagram about how to develop an organization to support a strategic change. It concerns the incoming and outgoing flow of employees as well as their training across several locations:


CPMDiagram_2

As you can see, the critical path is marked with red.

The following example is of a technology roadmap, where the critical path shows the three most critical project activities for on-time completion:

Other functionalities: A Calendar can be linked to the Property Dialog of the diagram showing holidays for the project.

Relation to other templates: The CPM Diagram template should be used after a project has been broken down into Project Activities. As such, it can be a decomposition of a Project Activity from a Business Canvas, Value Proposition, Work Model, Strategy Model or Innovation Canvas.

Properties and metadata: The CPM Diagram ­­­­can for example retain the following information:

  • A description of the diagram
  • Link to owner
  • Link to responsible
  • Link to calendar
  • Audits (auto generated information regarding its current state and access rights)
  • Associated documents, diagrams and other objects
  • Inherent Risk detailing risk considerations
  • Governance information detailing information about the published diagram and who has been involved in the approval of the diagram

The above picture shows the properties dialogue window for the CPM diagram where you can view and edit the diagram’s properties in QualiWare Lifecycle Manager.

Control Coverage Map

Purpose: The purpose of the Control Coverage Map is to provide an overview of uncovered risks, residual risks and potential cost of the risk occurring.

Core concerns: The Control Coverage Map concerns itself with Financial Risk Management and is created using the Actions tabs in QLM. It can be created based on the information in a Risk Heatmap or by using information from a diagram which contains risks that also have control actions.

Below, you can see an example of a Control Coverage map for four risks related to a Bellhouse, a Pump, a Suction pipe and using Check lists:

ControlCoverageMap

The Blue column represents the likelihood of the risk before the control action, the green column represents the likelihood of the risk after the implementation of a control action. The red columns represent the estimated cost if the risk is realized.

Relation to other templates: The Control Coverage Map presents graphical views of information from other diagrams the same as the Heatmap, Business Charts and the Graphical Matrix. It can be used by any diagram containing Activities with attached risks that have control activities.

Properties and metadata: The Control Coverage Map ­­­­can for example retain the following information:

  • A description
  • Link to the owner
  • Link to the one responsible
  • Graphical specification for the headers of the X-axis and Y-axis
  • Audits (auto generated information regarding its current state and access rights)
  • Associated documents, diagrams and other objects
  • Inherent Risk detailing risk considerations
  • Governance information detailing information about the published diagram and who has been involved in the approval of the Control Coverage Map

The above picture shows the properties dialogue window for the Control Coverage Map template where you can view and edit the template’s properties in QualiWare Lifecycle Manager.

Conceptual Data Model

Purpose: The Conceptual Data Model template is used to describe a high-level business oriented structure of the information concept used in a specific business area. Below yo can se an example of a Conceptual Data Model where the data is divided into data for internal and external use:

ConceptualDataModel_2

Core concerns: The conceptual data model template enables you to model a preliminary high level data model. It may be abstract in content and sparse in attributes. Its preliminary structure allows for many-to-many relationships. When using the Conceptual Data Model, you can model Information Concepts, Subject Areas, and their interrelationships. Below, you can see a car rental service’s Conceptual Data Model for a customer’s data.

ConceptualDataModel_1

Relation to other templates: The conceptual data model is a means of communicating information structures between participants in a project or documenting the overall Information Concept of a specific organization. For a more detailed model you should use a Data Model Diagram.

Properties and metadata: The Conceptual Data Model can for example retain the following metadata:

  • A description of the diagram
  • Link to the owner of the diagram
  • Link to the one responsible for the accuracy of the diagram
  • Audits (auto generated information regarding its current state and access rights)
  • Associated documents, diagrams and other objects
  • Inherent Risk detailing risk considerations
  • Governance information detailing information about the published diagram and who has been involved in the approval of the diagram
  • Project status: information about budgeted and actual man-hours spent, percentage completed and the latest milestone, result and quality control of a change process.

In the picture below you can see the Conceptual Data Model’s properties dialogue window, where the information can be viewed and edited:

Concept Model

Purpose: The purpose of a Concept Model is to organize an enterprise’s vocabulary to support cPonsistent and unambiguous communication about specific problem domains across business units.

Core concerns: The Concept Model template enables you to model Concepts, Specialization Aspects and Subject Areas. They can be linked by Concept Associations, Concept Aggregations, Concept Generalizations, Type Relationships, and Relationship Constraints.

You are also able to link the diagram to its area of usage through the model’s property dialogue. This area of usage can by default be set to be either an Organization Unit, Role, Actor or External Entity.

Below you can see some examples of Concept Models from a healthcare domain:

The model above shows the concepts related to the healthcare activity ‘knee arthroplasty’. The model below shows the concepts related to a signature in the healthcare domain:

ConceptModel_1

The model above shows the concepts related to the healthcare activity ‘knee arthroplasty’.

The model below shows the concepts related to a signature in the healthcare domain:

ConceptModel_2

Relation to other templates: A Concept Model should enable the identification of the right terms to use in communications where high precision is needed. This is useful when creating large sets of business rules or processes that need to fit together without ambiguity and when creating complex Data Models. As such, it could be advantageous to link to a concept model from the affected Business Process Networks, Workflow Diagrams, Requirements Models and Regulation Diagrams.

Properties and metadata: The Concept Model can for example retain the following information:

  • A description of the diagram
  • Link to the owner of the model
  • Link to the one responsible for the model
  • Link to view of area of usage
  • Audits (auto generated information regarding its current state and access rights)
  • Associated documents, diagrams and other objects
  • Inherent Risk detailing risk considerations
  • Governance information detailing information about the published diagram and who has been involved in the approval of the diagram

The above picture shows the properties dialogue window for the Concept Model, where you can view and edit the diagram’s properties in QualiWare Lifecycle Manager.

For more information: to learn more about Concept Models, you can read the following article:

Ronald G. Ross , “What Is a Concept Model?” Business Rules Journal Vol. 15, No. 10, (Oct. 2014). URL: http://www.brcommunity.com/a2014/b779.html

Class Diagram

Purpose: The primary objective of the Class Diagram template is to visually represent and document the structural components of a system utilizing the Unified Modeling Language (UML). Displayed below is an example of a straightforward Class Diagram:

ClassDiagram_2

Core concerns: The Class Diagram effectively captures the various classes within a system, their attributes, operations, and the relationships between classes and other objects, such as packages. This comprehensive representation enables a clear understanding of the system’s structure, promoting efficient communication among stakeholders and facilitating system design and maintenance.

Example: In the Class Diagram below, the relationships between the classes “Customer” and “Internet User” and the packages “WEB-API”, “Reservation Control”, “GUI” (Graphical User Interface), and “Database” are illustrated. This example highlights the connections among different components and provides a visual overview of how they interact within the system:

ClassDiagram_1

Relation to other templates: The Class Diagram presents a detailed structural view of information. It can for example be a decomposition of an Information System which typically is presented in an Application Architecture Diagram. If a Class Diagram becomes too complex or large, a Package Diagram, where the classes are grouped into Packages, could be modelled instead.

Properties and metadata: The Class Diagram can for example retain the following information:

  • A description of the diagram
  • Link to the owner of the diagram
  • Link to the one responsible for the diagram
  • Audits (auto generated information regarding its current state and access rights)
  • Extensions regarding constraints and tagged values
  • Associated documents, diagrams and other objects
  • Inherent Risk detailing risk considerations
  • Governance information detailing information about the published diagram and who has been involved in the approval of the diagram

In the picture below you can see the Class Diagrams properties dialogue window, where the information can be viewed and edited:


Business Process Network

Purpose: The purpose of the Business Process Network is to at document a mid- to high-level view of Business Processes and their interrelationships.

Core concerns: The Business Process Network template enables the documentation of top to mid-level processes. The core objects available to model with are Business Processes, Business Events, Business Objects, Business Scope, Information Systems, and different types of connections. Below you can see two examples of a Business Process Network modelled in different styles.

High level process view without business events or connections between processes:

BusinessProcessNetwork_2

High-level process view where business events and connections indicate a flow between processes, stakeholders and customers:

BusinessProcessNetwork_1

Relation to other templates: The top-level processes would typically be broken down to one or more levels of mid-level processes. The last level of Business Process Networks can then be broken down to several Workflow Diagrams or Business Process Diagrams detailing the activities contained within the business process

Properties and metadata: The Business Process Network can for example retain the following information:

  • Description of the diagram
  • Link to the owner of the diagram
  • Link to the one responsible for executing the processes in the diagram
  • Audits (auto generated information regarding its current state and access rights)
  • Associated documents, diagrams and other objects
  • Inherent Risk detailing risk considerations
  • Governance information detailing information about the published diagram and who has been involved in the approval of the diagram

In the picture below you can see the Business Process Network’s properties dialogue window, where the diagrams properties can be viewed and edited: