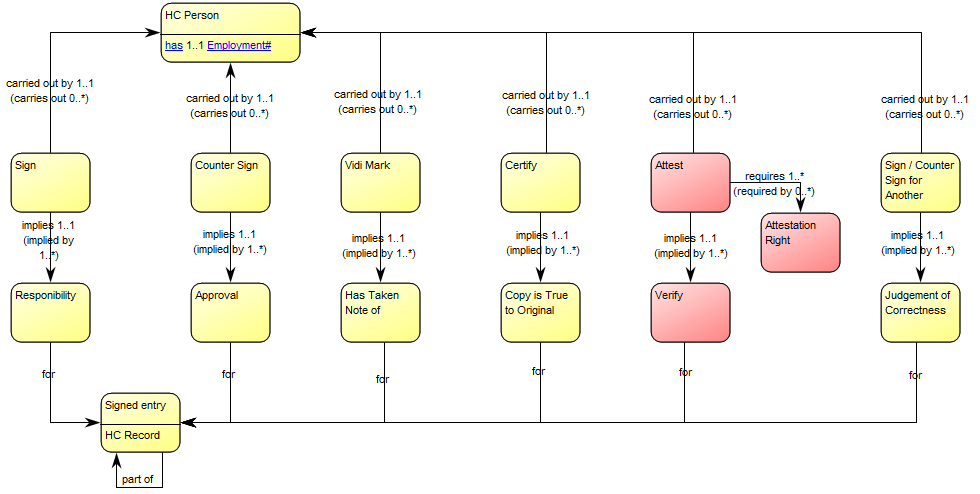
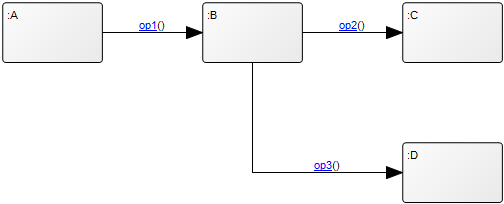
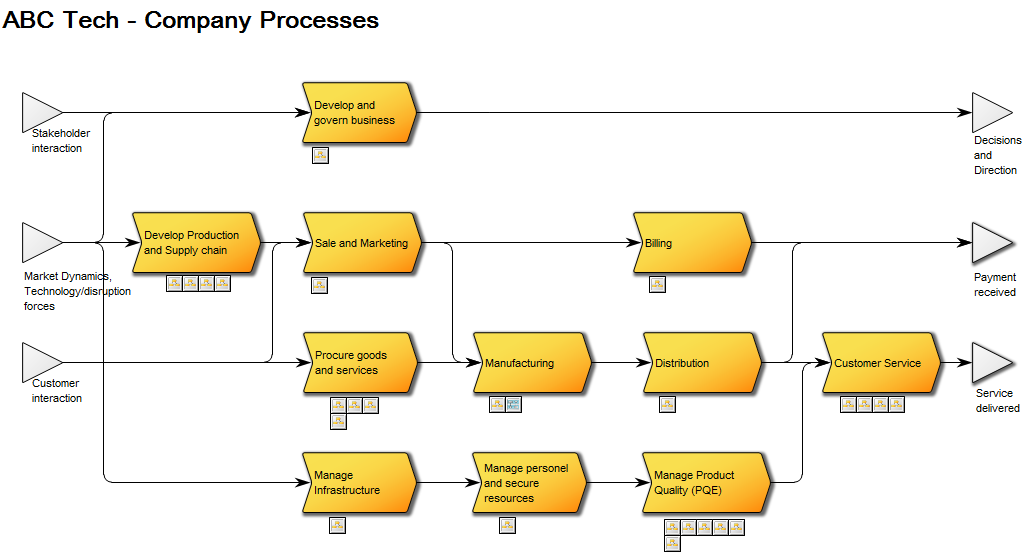
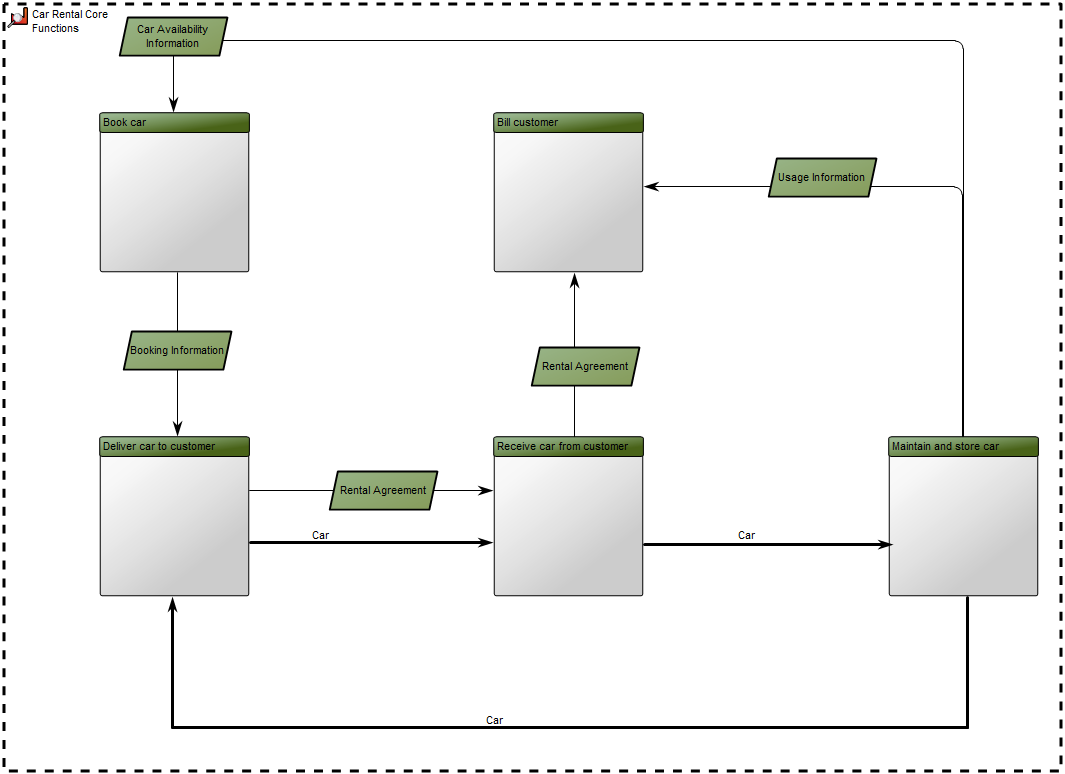
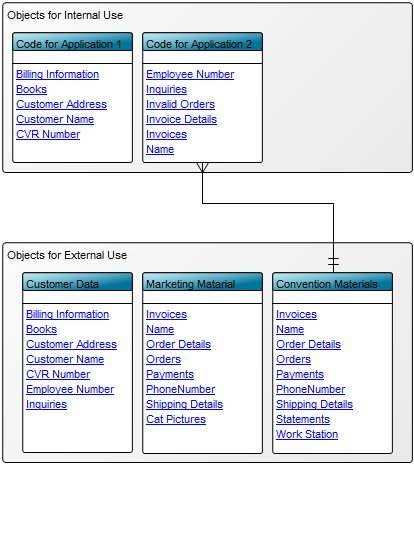
Purpose: The Conceptual Data Model template is used to describe a high-level business oriented structure of the information concept used in a specific business area. Below yo can se an example of a Conceptual Data Model where the data is divided into data for internal and external use:
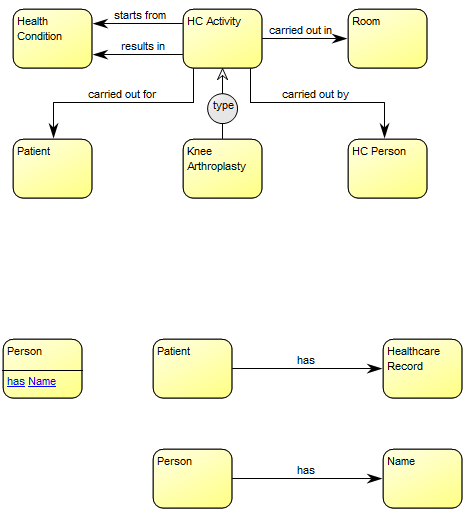
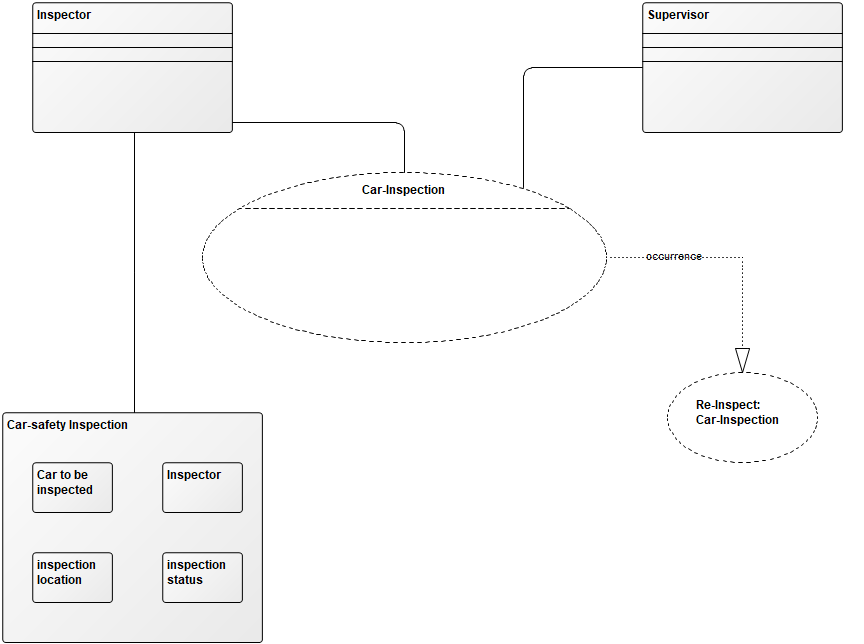
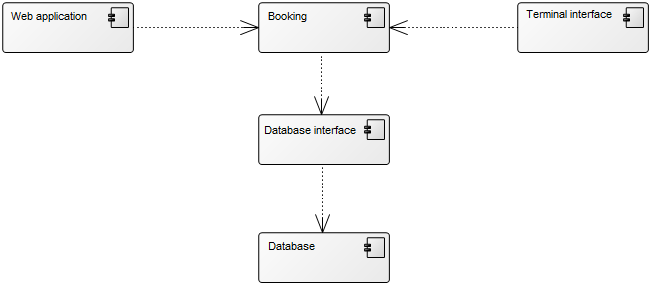
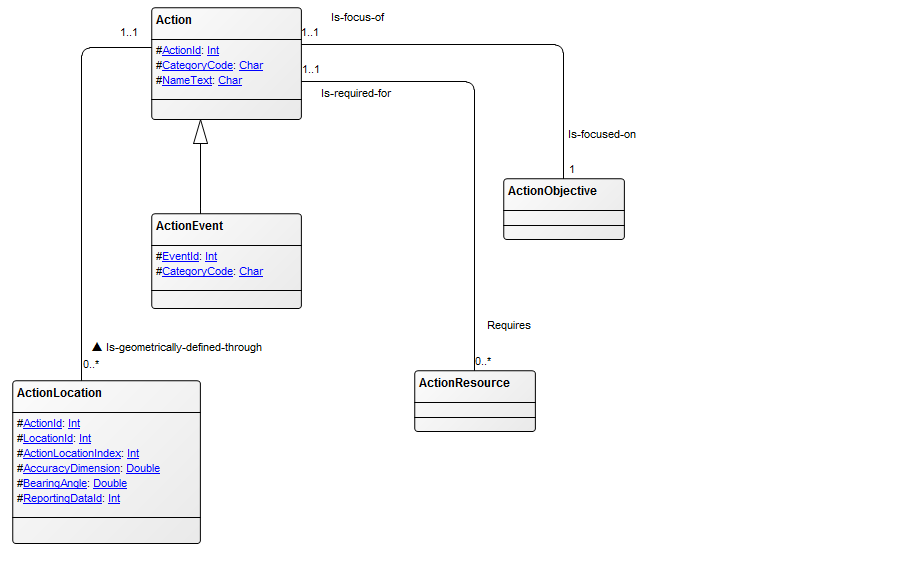
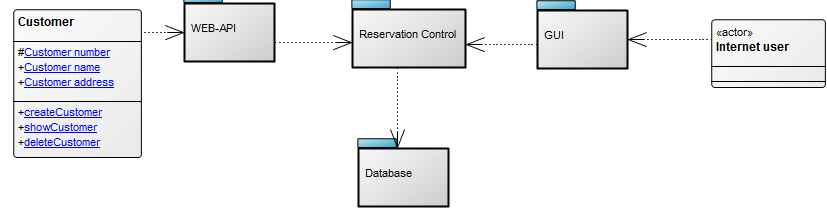
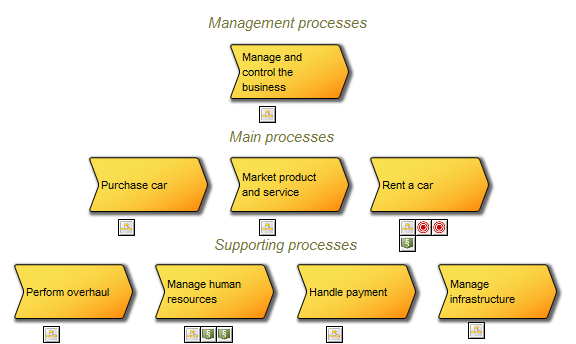
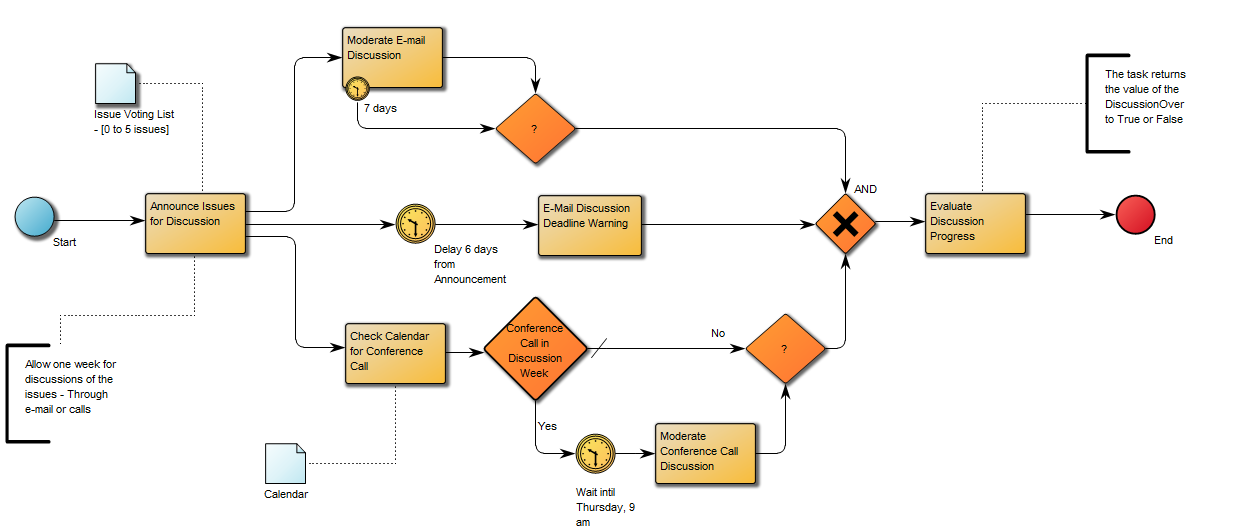
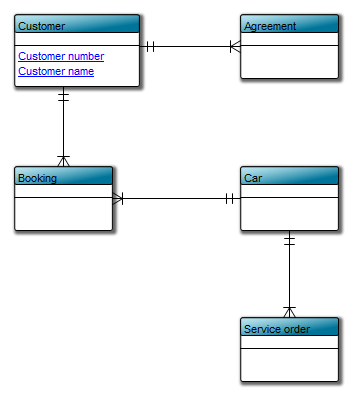
Core concerns: The conceptual data model template enables you to model a preliminary high level data model. It may be abstract in content and sparse in attributes. Its preliminary structure allows for many-to-many relationships. When using the Conceptual Data Model, you can model Information Concepts, Subject Areas, and their interrelationships. Below, you can see a car rental service’s Conceptual Data Model for a customer’s data.
Relation to other templates: The conceptual data model is a means of communicating information structures between participants in a project or documenting the overall Information Concept of a specific organization. For a more detailed model you should use a Data Model Diagram.
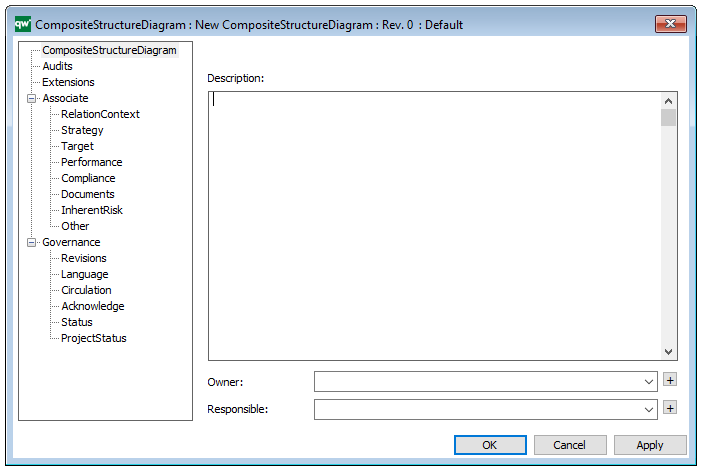
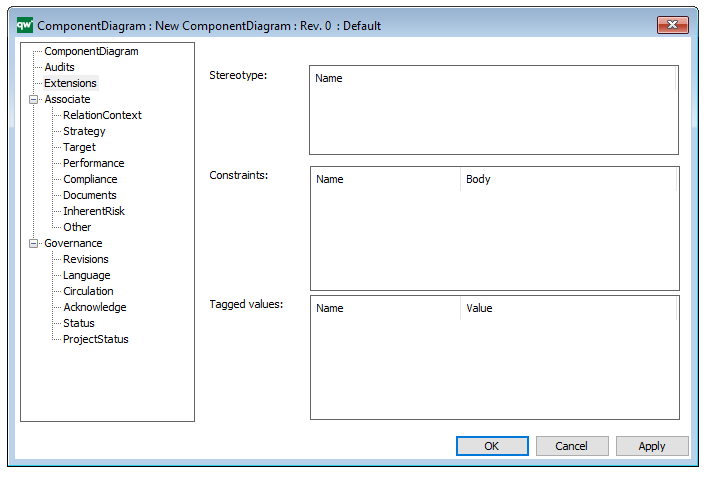
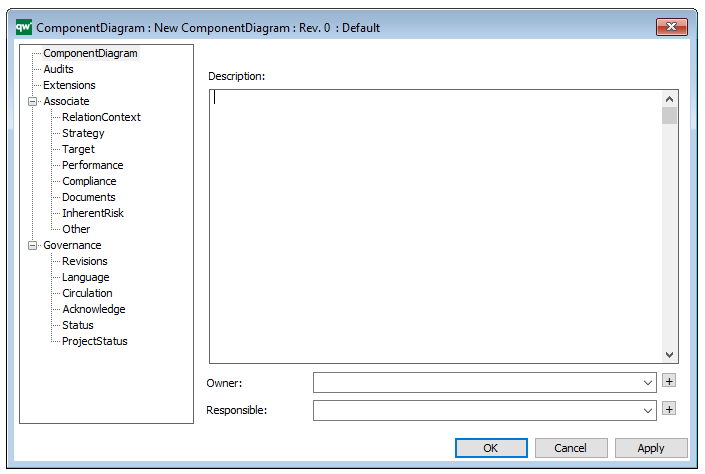
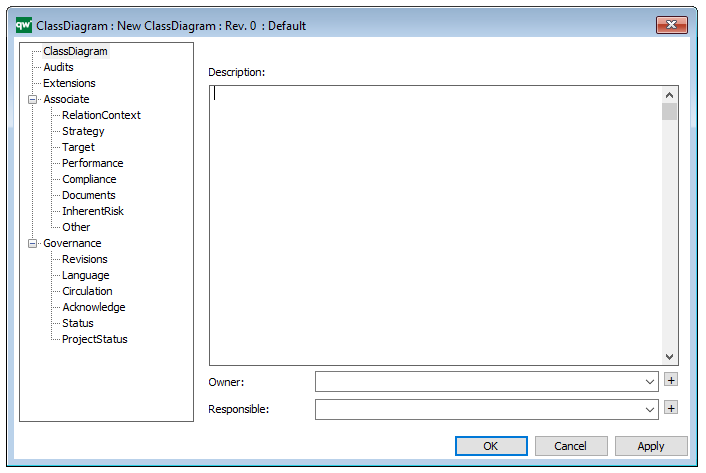
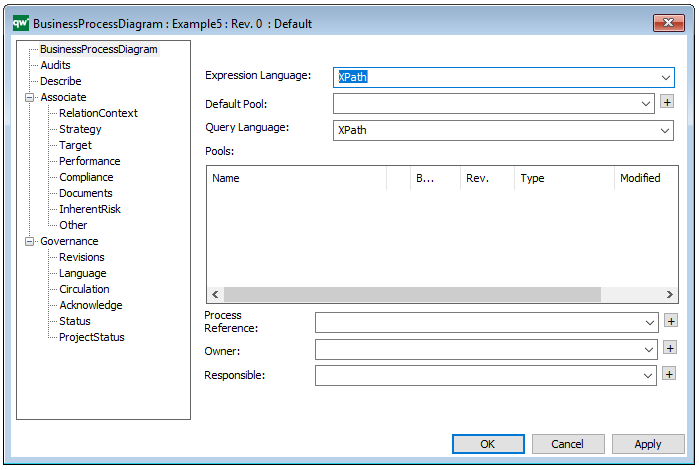
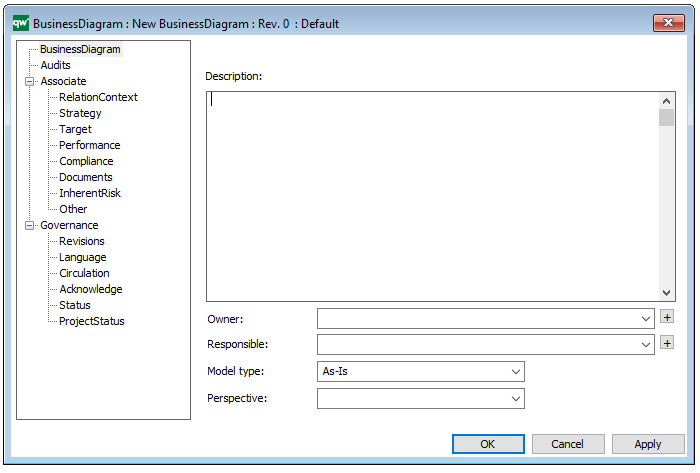
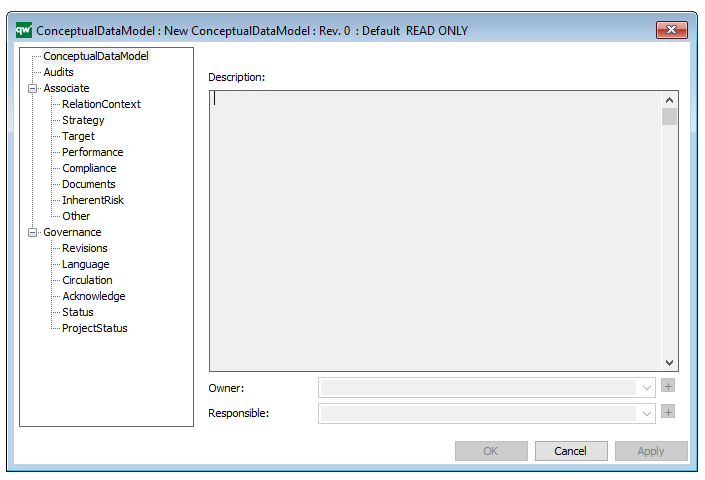
Properties and metadata: The Conceptual Data Model can for example retain the following metadata:
- A description of the diagram
- Link to the owner of the diagram
- Link to the one responsible for the accuracy of the diagram
- Audits (auto generated information regarding its current state and access rights)
- Associated documents, diagrams and other objects
- Inherent Risk detailing risk considerations
- Governance information detailing information about the published diagram and who has been involved in the approval of the diagram
- Project status: information about budgeted and actual man-hours spent, percentage completed and the latest milestone, result and quality control of a change process.
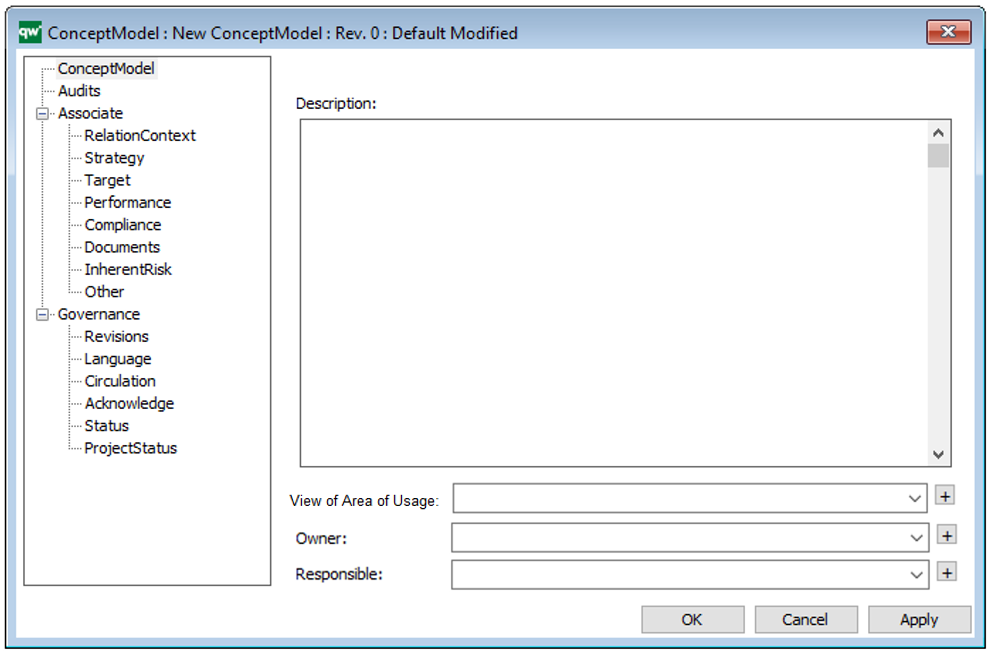
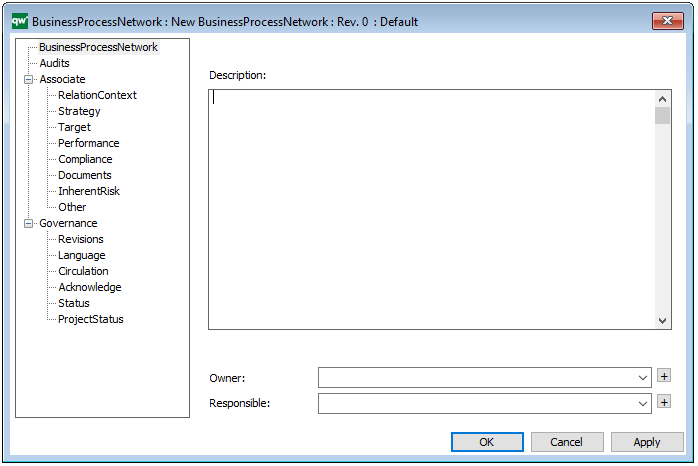
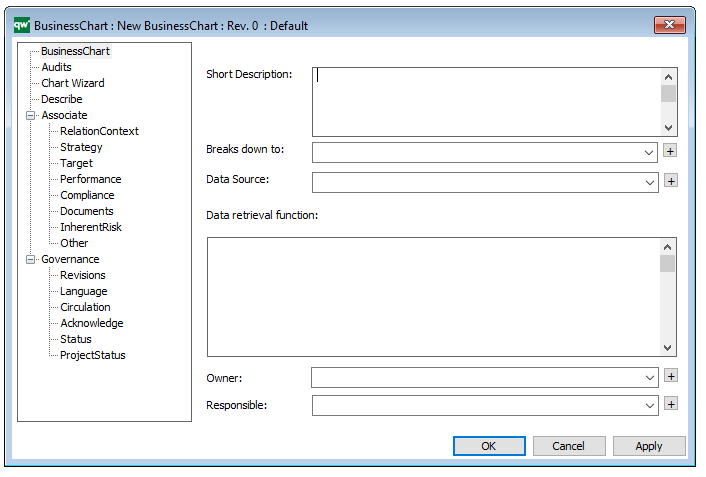
In the picture below you can see the Conceptual Data Model’s properties dialogue window, where the information can be viewed and edited:
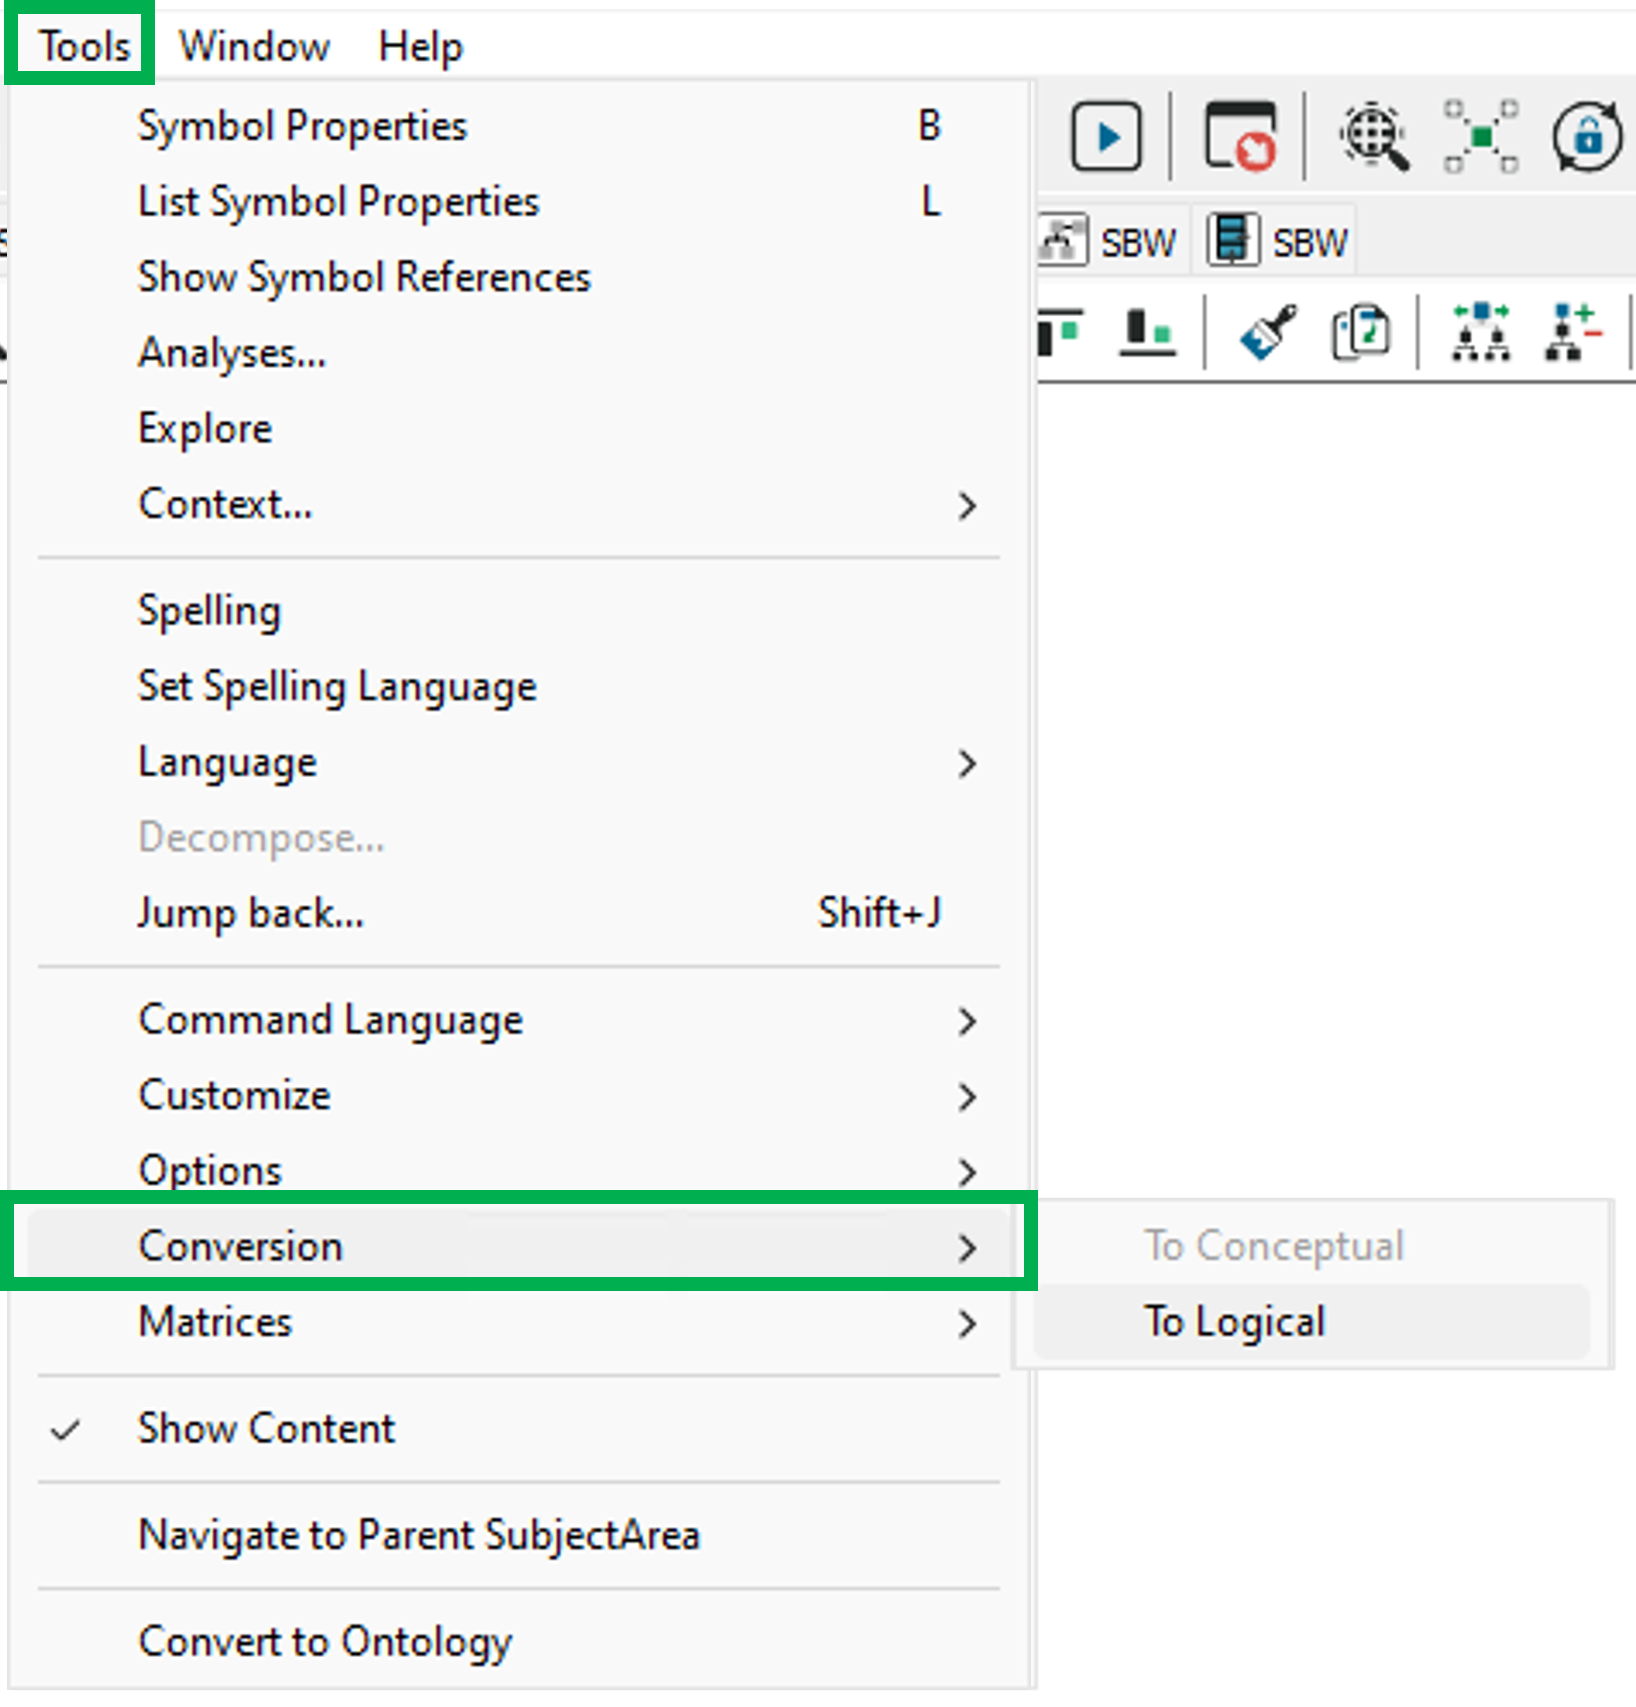
Conversion
It is possible to convert between the different models.
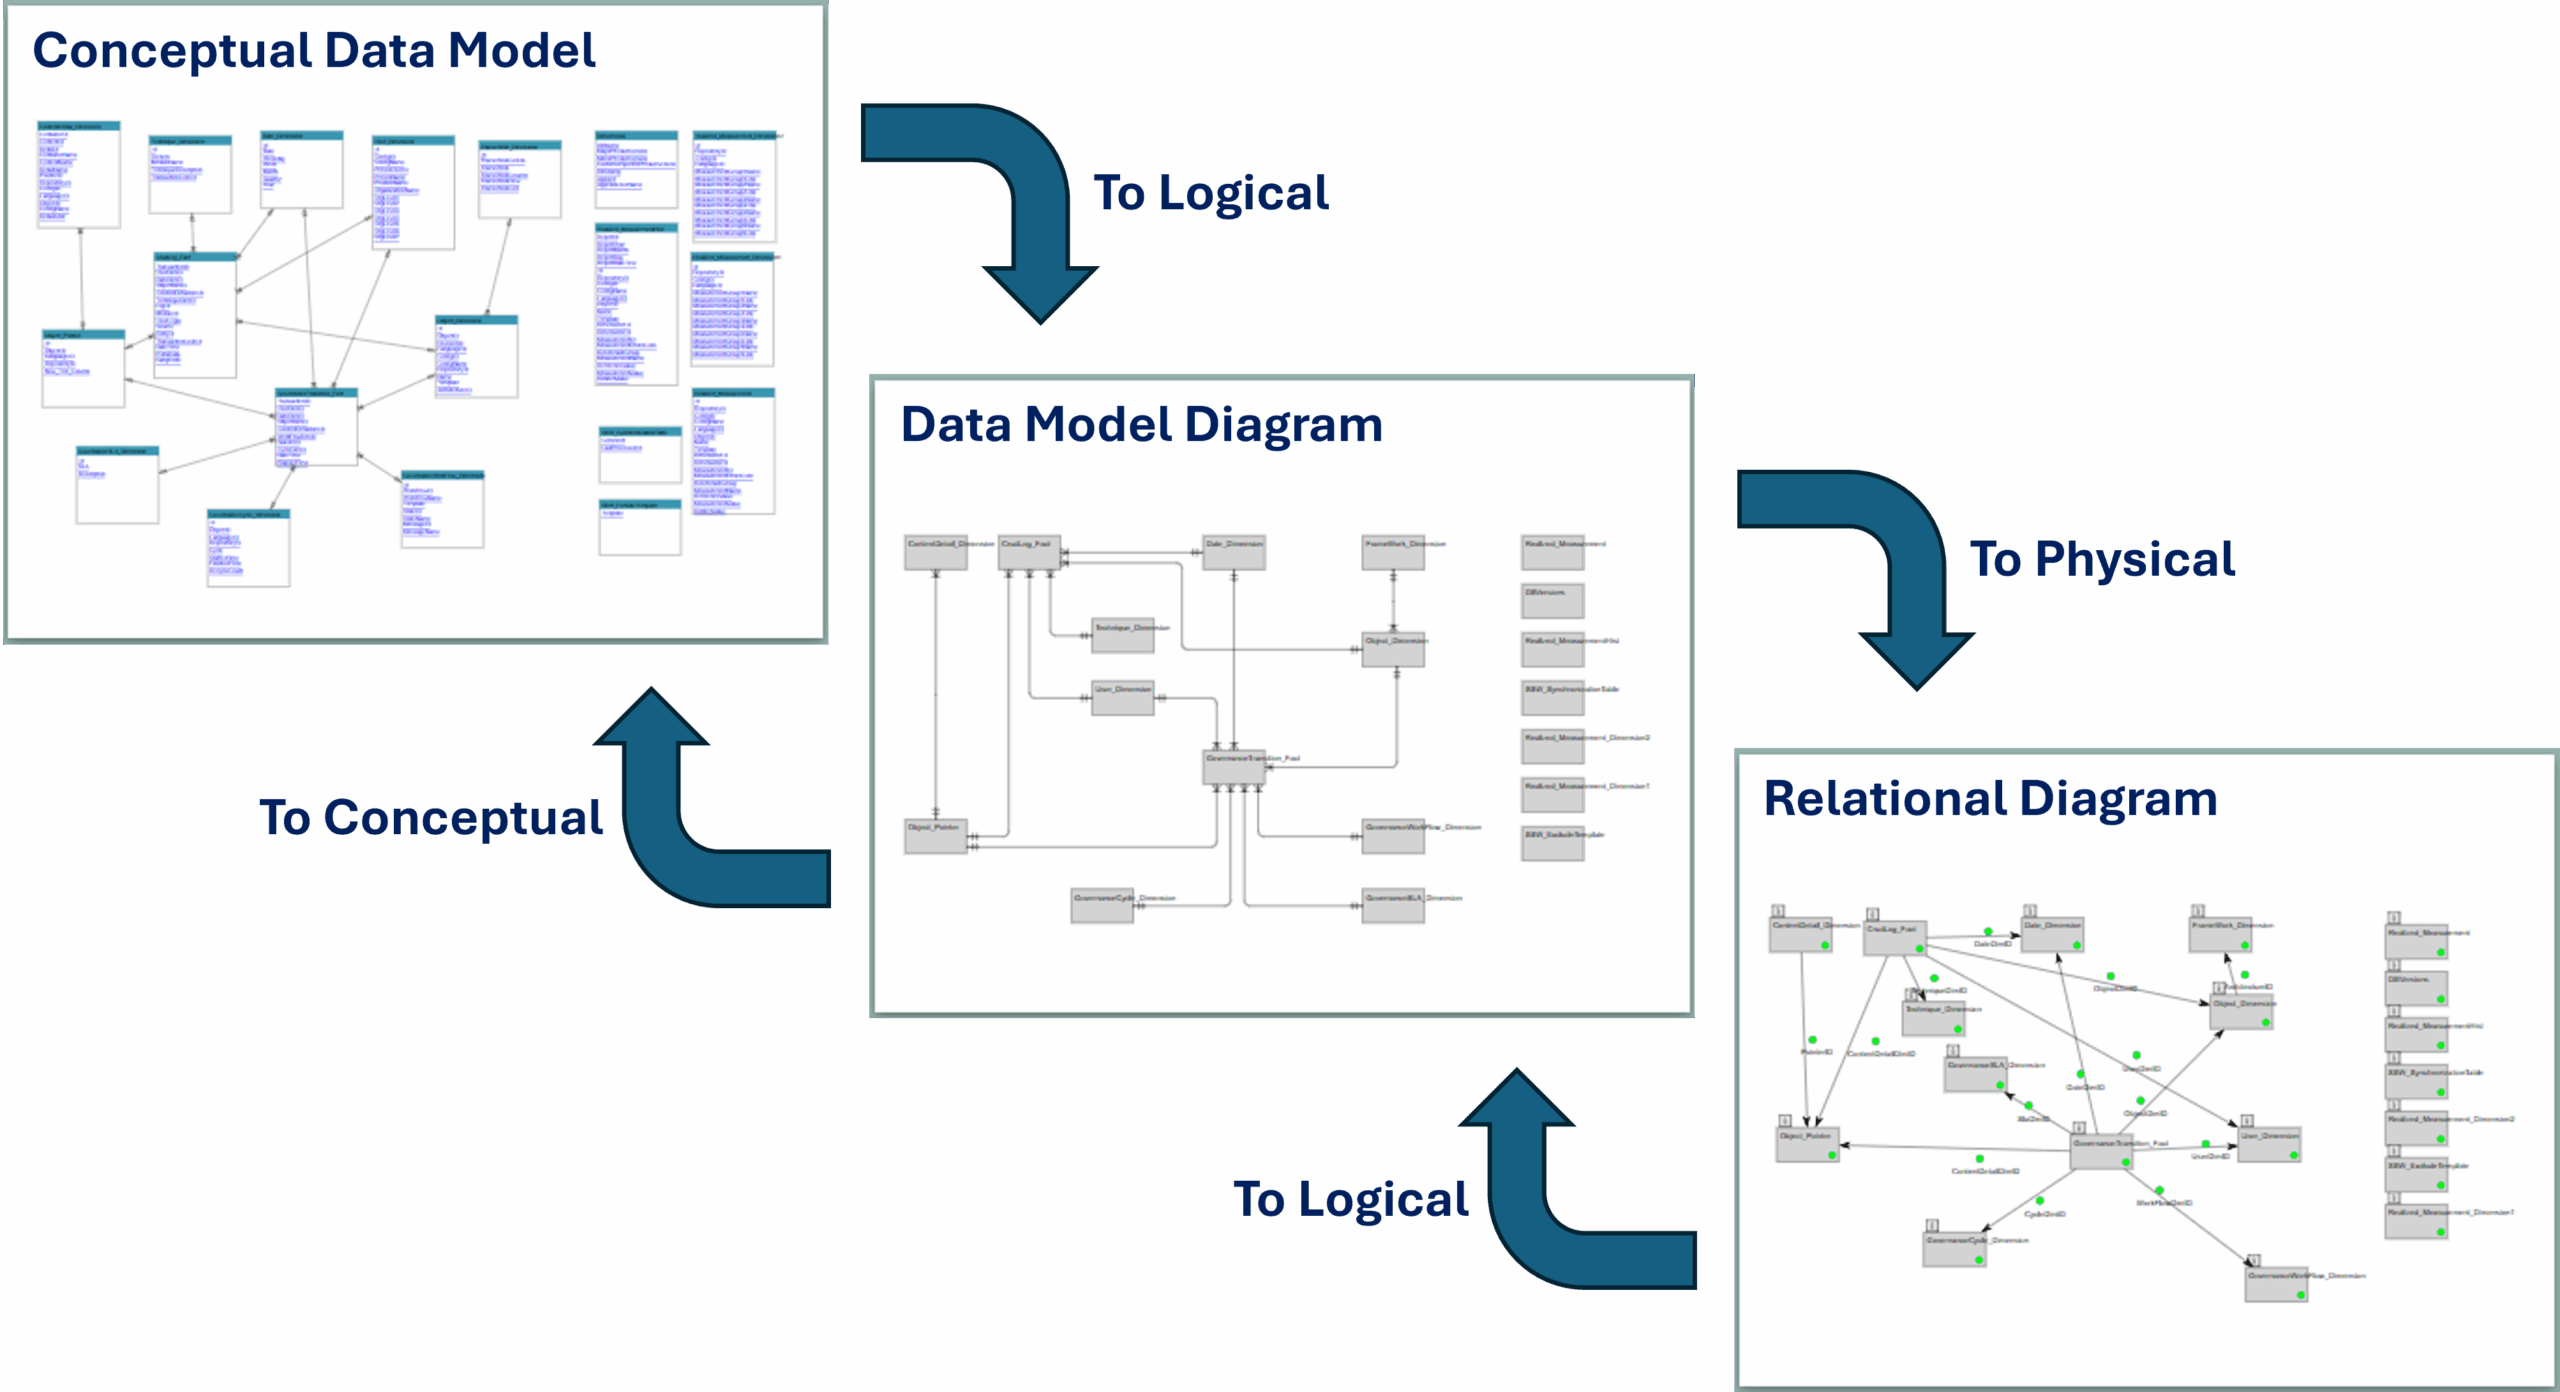
It is possible to convert a from the ConceptualDataModel conceptual model to a logical (DataModelDiagram) from the tools menu in QLM.
From the same menu the model can also be converted to an OntologyDiagram, read more here: