Deployment Diagram

Purpose: The purpose of the Deployment Diagram is to document the configuration of run-time processing nodes and the components they contain.

Core concerns: The Deployment Diagram template is structural UML diagram that enables you to model Packages, Components, Artifacts, Instance Specifications, Properties, Nodes, Devices, Execution Environments, Deployment Specifications, Objects, Classes, Interfaces, and Annotations. They can then be connected through Association, Dependency, Generalization, Deployment or Manifestation.

The Deployment Diagram models how the different hardware component and software components are connected. Below you can see an example of a Deployment Diagram for a booking service:

DeploymentDiagram_1

In the next example, you can see how Packages and Components would be included in a Deployment Diagram:
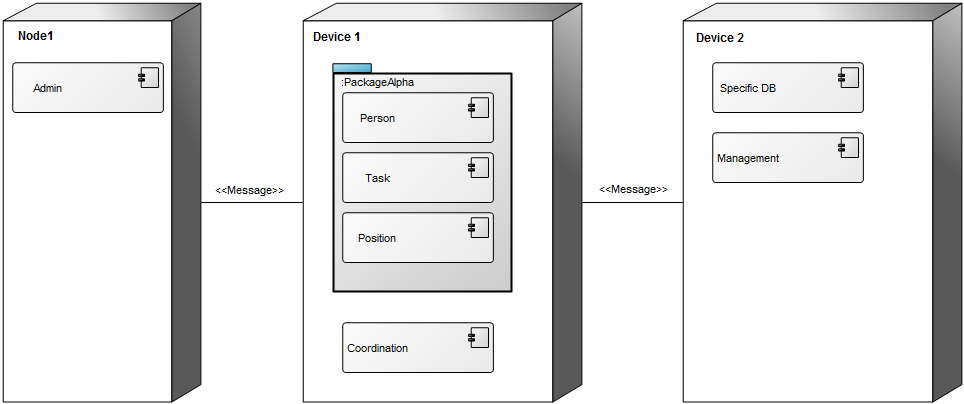
DeploymentDiagram_2

Relation to other templates: The Deployment Diagram is, as a component model, part of the application domain on the operational level. As such, it offers a complimentary view to those of the Application Architecture Diagram, Class Diagram, Component Diagram, Data Flow Diagram, Data Mapping Diagram, Data Replication Diagram, Sequence Diagram, State Event Diagram, Structure Chart, and Use Case Diagram.

Properties and metadata: The Deployment Diagram can for example retain the following information:

  • A description of the diagram
  • Link to the owner of the diagram
  • Link to the one responsible for the diagram
  • Links to extensions such as Stereotypes and Constraints
  • Audits (auto generated information regarding its current state and access rights)
  • Associated documents, diagrams and other objects
  • Inherent Risk detailing risk considerations
  • Governance information detailing information about the published diagram and who has been involved in the approval of the diagram
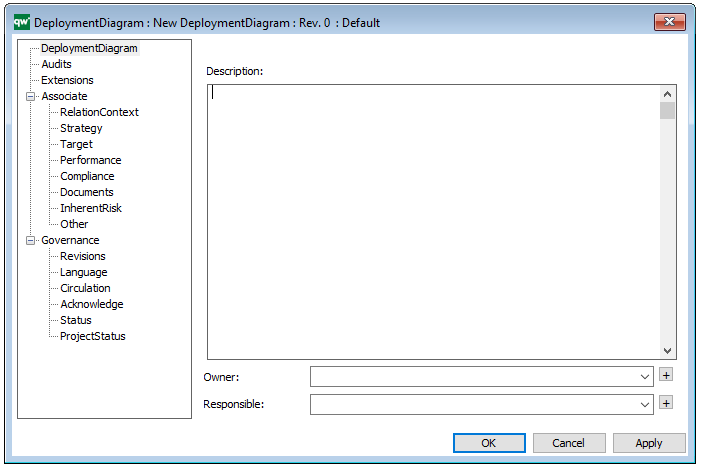
The above picture shows the properties dialogue window for the Deployment Diagram where you can view and edit the diagram’s properties in QualiWare Lifecycle Manager.



Data Flow Diagram

Purpose: The purpose of the Data Flow Diagram is to document a system’s or part of a system’s data flows; the data input the system (or a process within the system) consumes and the data output the system produces.

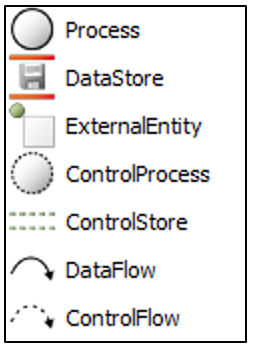
Core concerns: The Data Flow Diagram enables you to model Processes, Data Stores, External Entities, Control Processes and Control Stores. These elements can then be connected by either Data Flows or Control Flows.

Graphical representation of the elements:

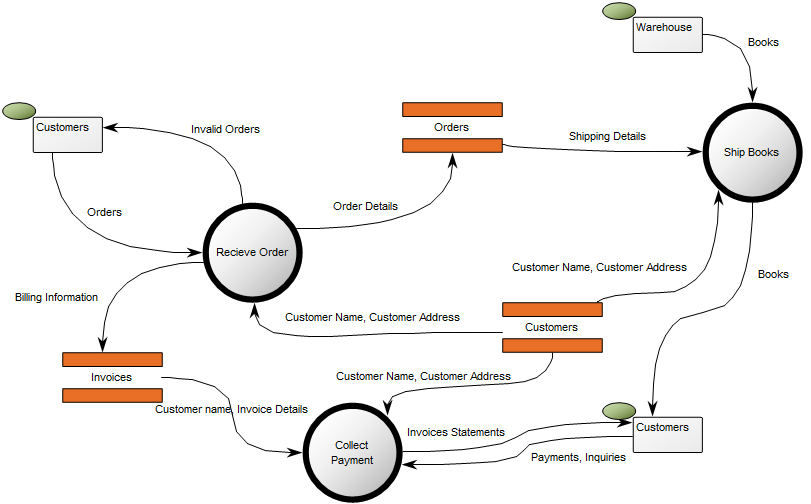
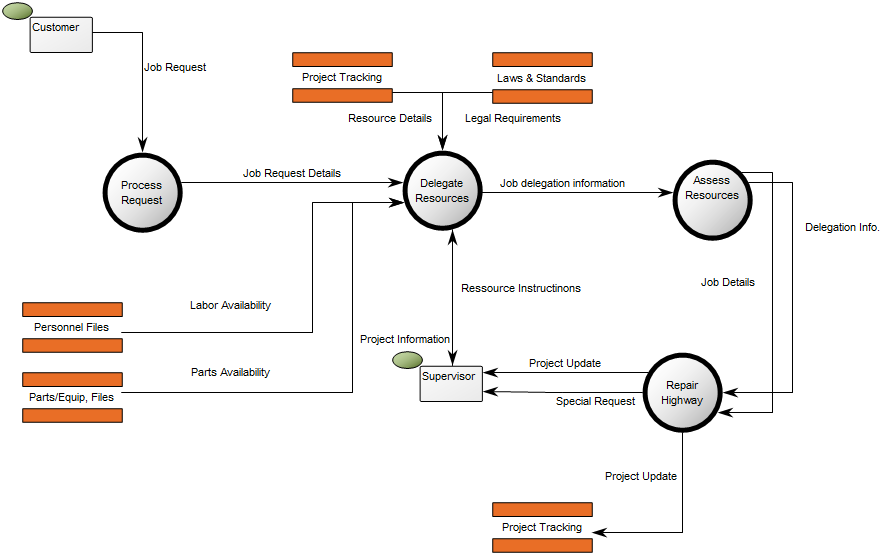
The Data Flow Diagram can show different levels of processes within a system that exchange data, and illustrate how those exchanges occur. As such, the model can document a system’s functional hierarchies.

Below, you can see an example of a Data Flow Diagram showing the Data Flows between several Data Stores, Processes and External Entities in a Bookshop:

DataFlowDiagram_2

The next example shows the Data Flow between process, Data Stores and External Entities for a Highway Repair Service:

DataFlowDiagram_1

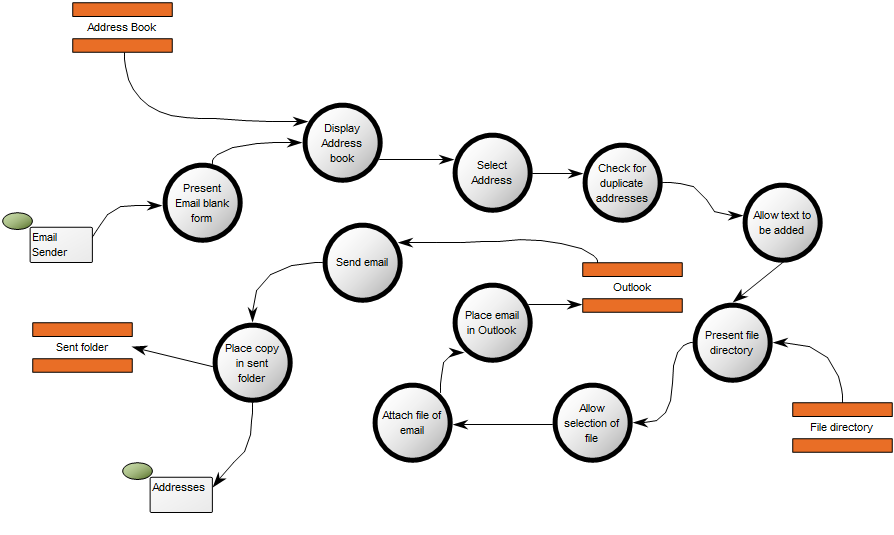
The final example shows the Data Flows between Processes, Datastores and External Entities in an Outlook Mailbox:

dfd

Relation to other templates: The Processes in the Data Flow Diagram can be decomposed into more detailed Data Flow Diagrams to comprise the total functional model. The top level of a Data Flow Diagram is sometimes called a Context Diagram. However, in QLM we use the Data Flow Diagram template for the higher levels as well as the more detailed ones.

The Data Flow Diagram can be a decomposition of an Information System. It can offer a more detailed view of Data Flows than, for example, the Application Architecture Diagram.

An Information System could likewise be decomposed into a Business Process Diagram which offers a complimentary view less concerned with Data Stores and Data Flow, and more concerned with Activity Flow.

Properties and metadata: The Data Flow Diagram template ­­­­can for example retain the following information:

  • A description of the diagram
  • Link to the owner of the diagram
  • Link to the one responsible for diagram
  • Audits (auto generated information regarding its current state and access rights)
  • Associated documents, diagrams and other objects
  • Inherent Risk detailing risk considerations
  • Governance information detailing information about the published diagram and who has been involved in the approval of the diagram

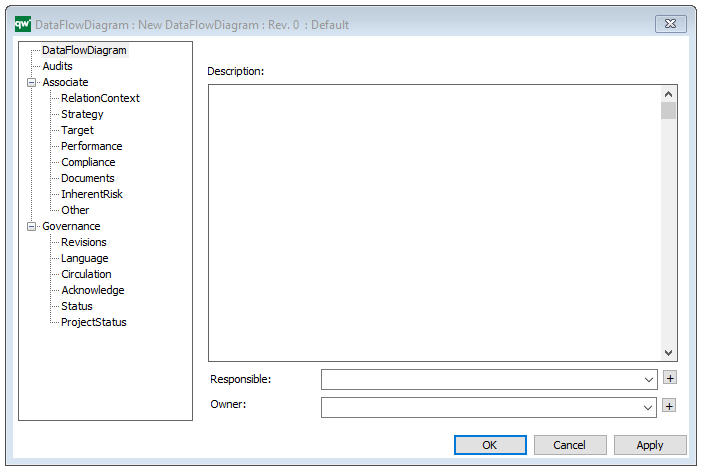
The above picture shows the properties dialogue window for the Data Flow Diagram template, where you can view and edit the diagram’s properties in QualiWare Lifecycle Manager.
Composite Structure Diagram

Purpose: The purpose of the Composite Structure Diagram template is to document the internal structure of a class, Class interactions with the environment and behavior of collaborations. The Composite Structure Diagram is part of the UML version 2.5.

Core concerns: The Composite Structure Diagram enables you to model Collaborations, Collaboration Use, Properties, Classes, Interfaces and Ports. These elements can be connected by Connectors, Dependencies, Interface Realizations and Usage.

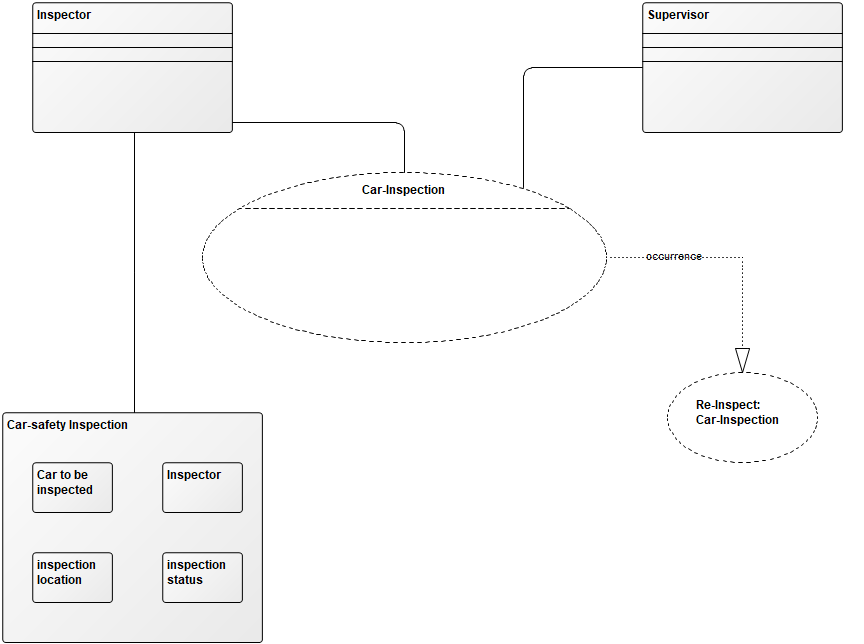
Below, you can see an example of a Composite Structure Diagram for a car safety inspection:  

The Diagram shows internal structure of the Car-safety inspection class as well as the behavior of collaborations and the different classes’ interactions.

Relation to other templates: The Composite Structure Diagram is part of the UML templates QualiWare supports along with the Activity Diagram, Communication Diagram, Deployment Diagram, Class Diagram, State Diagram, Package Diagram, Component Diagram, Sequence Diagram, Use case diagram and Timing Diagram.

The Composite Structure Diagram can be defined as the components content along with the Component Diagrams, Class Diagrams, Classes, and Interfaces. The Component Object is a representation of a physical part from the system specification.

Properties and metadata: The Composite Structure Diagram ­­­­can for example retain the following information:

  • A description of the diagram
  • Link to the owner of the diagram
  • Link to the one responsible for the diagram
  • Extensions (Stereotypes, constraints and tagged values)
  • Audits (auto generated information regarding its current state and access rights)
  • Associated documents, diagrams and other objects
  • Inherent Risk detailing risk considerations
  • Governance information detailing information about the published diagram and who has been involved in the approval of the diagram

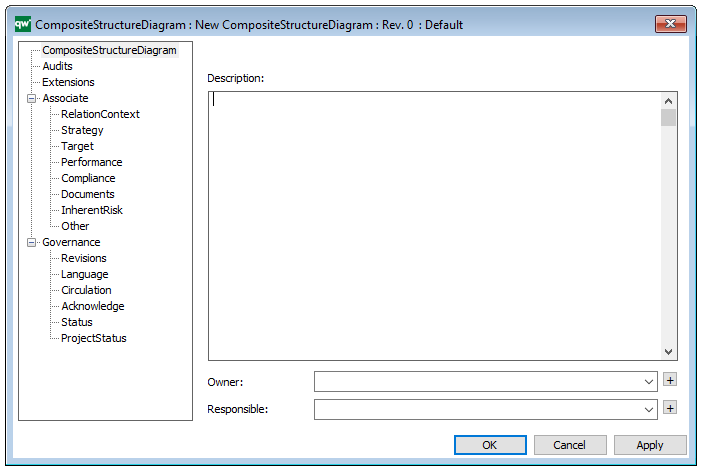
The above picture shows the properties dialogue window for the Composite Structure Diagram where you can view and edit the diagram’s properties in QualiWare Lifecycle Manager.
For more information: about the UML, please visit the Object Management Group’s Website, where you can find the complete specification.

Communication Diagram

Purpose: The purpose of the Communication Diagram template is to document interactions between objects or parts, focusing on sequenced messages.

Core concerns: The Communication Diagram template is a simplified UML 2.0 alternative to the UML Collaboration Diagram. It enables you to model Lifelines and Annotation, which can be connected by messages.

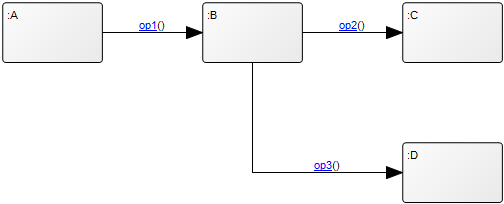
Below you can see a simple example of a Communication Diagram:

CommunicationDiagram_1

Relation to other templates: Usually, Communication Diagrams would be modeled using information from Class Diagram, Sequence Diagram, and Use case diagram. It is related to the other UML interaction diagrams: Sequence Diagram, Interaction overview diagram and Timing Diagram.

While the Communication Diagram show much of the same information a Sequence Diagram does, the Communication Diagram conveys which elements each one interacts with better, while sequence diagrams show the order in which the interactions take place more clearly.

Other UML diagrams that QualiWare support include: Activity Diagram, Communication Diagram, Deployment Diagram, , Composite Structure Diagram, State Diagram, Package Diagram, Component Diagram, Composite structure Diagram, and Object Diagram.

Properties and metadata: The Communication Diagram ­­­­can for example retain the following information:

  • A description of the diagrams
  • Link to related sequence diagram
  • Extensions (Stereotype, Constraints and Tagged values)
  • Audits (auto generated information regarding its current state and access rights)
  • Associated documents, diagrams and other objects
  • Inherent Risk detailing risk considerations
  • Governance information detailing information about the published diagram and who has been involved in the approval of the diagram

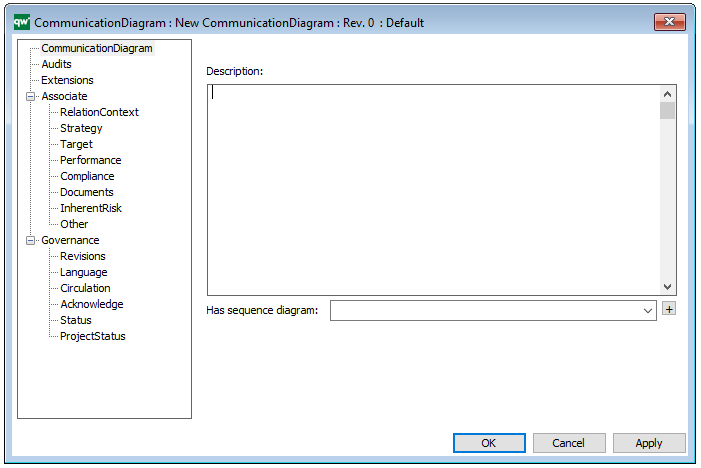
The above picture shows the properties dialogue window for the Communication diagram, where you can view and edit the diagram’s properties in QualiWare Lifecycle Manager.
For more information: about the UML, please visit the Object Management Group’s Website, where you can find the complete specification.

Application Functionality Context

Purpose: The purpose of the Application Functionality Context template is to document the in which Activities and/or Business Processes a given Application Functionality is used.

Core concerns: The Application Functionality Context template can be used to create graphical views showing where Application Functionalities are used. The template enables you to model Application Functionalities, Activities and Business Processes. The Business Processes and Activities are connected to Application Functionalities using Functionality Usage.

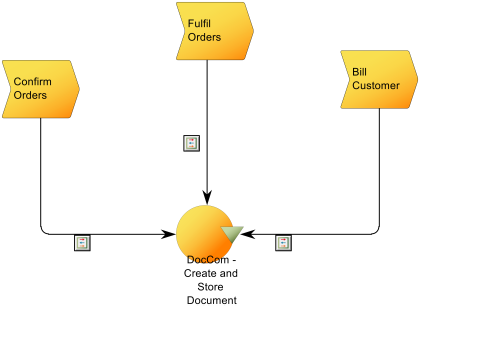
Below, you can see an example of an Application functionality contest diagram, where the context for the DocCom – Create and Store Document functionality is shown:

The diagram shows which Business Processes use the Application Functionality as well as which Information System delivers it.

Relation to other templates: To map applications hardware, the Application Architecture Diagram or Infrastructure Diagram template should be used. The Application Functionality Context template graphically connects functionalities of Information Systems to the Processes and Activities in which they are used. It offers an additional view to Application Architecture Diagrams, Workflow Diagrams, Business Process Diagrams and Business Process Networks.

Properties and metadata: The Application Functionality Context template ­­­­can for example retain the following information:

  • A description of the diagram
  • Audits (auto generated information regarding its current state and access rights)
  • Associated documents, diagrams and other objects
  • Inherent Risk detailing risk considerations
  • Governance information detailing information about the published diagram and who has been involved in the approval of the diagram

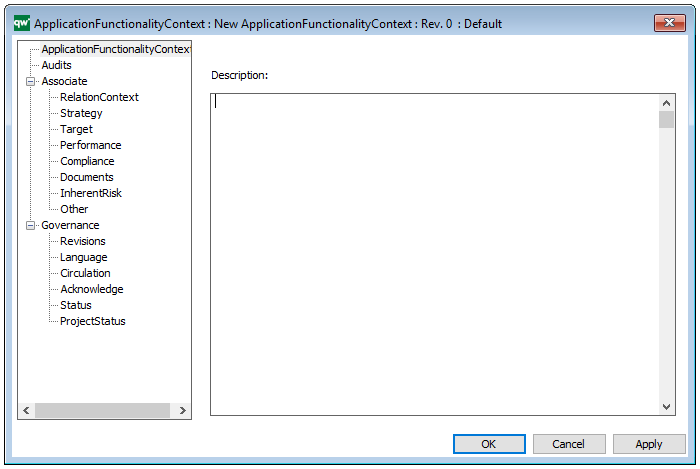
The above picture shows the properties dialogue window for the Application Functionality Context template where you can view and edit the diagram’s properties in QualiWare Lifecycle Manager.

Application Architecture Diagram

Purpose: The purpose of an Application Architecture Diagram is to show the structure of an Information System and its relations to other Information Systems.

Core concerns: The Application Architecture Diagram is used to document the application/systems layer. It can show information flows and system dependencies between Information Systems as well as depict system components and system areas.

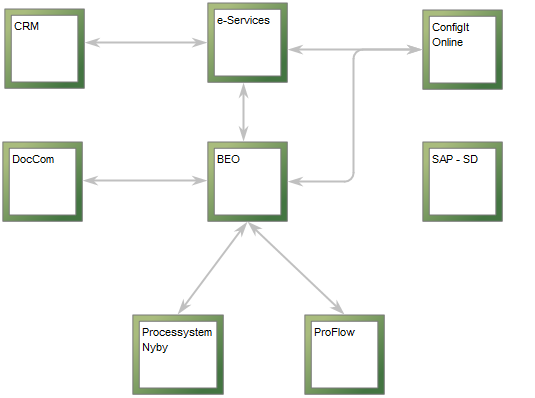
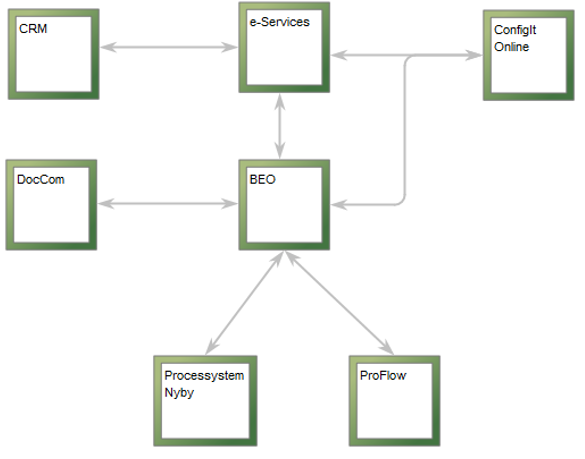
The above picture shows an example of an Application Architecture Diagram depicting an overview of the Information Systems related to BEO. The information systems are connected by arrows that symbolize system dependencies.

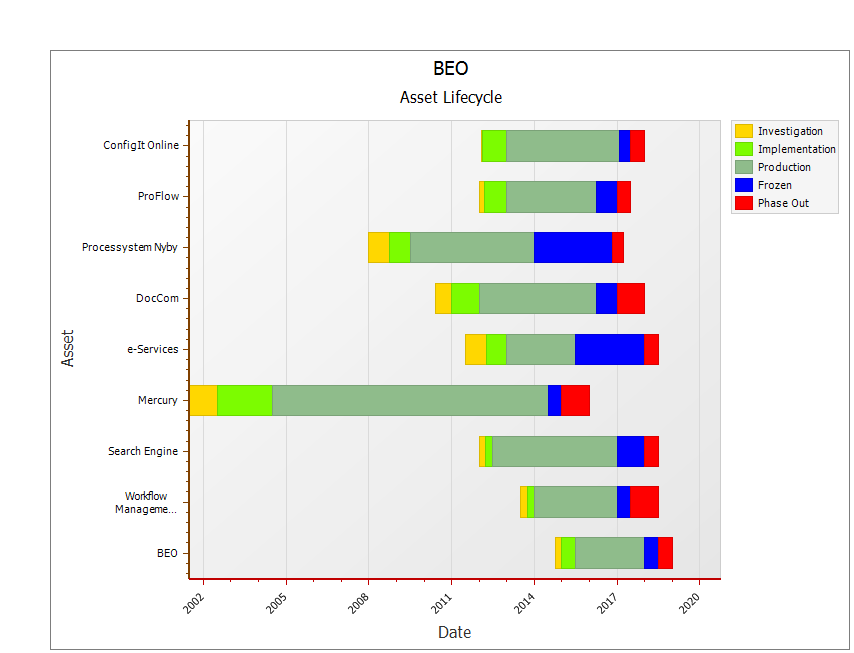
Other functionalities: Application Architecture Diagrams can be analyzed in QualiWare via the toolbar for Application Portfolio Management. The Application Portfolio Management tools offers analysis for redundant functionalities, performance matrix generation, system heat map generation, asset lifecycle view (se below picture), lifecycle dependencies, and capabilities delivered by multiple information systems.

The above picture shows the Asset Lifecycle of the Information System ‘BEO’ and the Information Systems related to it is shown. The information depicted is pulled from the Information Systems’ metadata.

Relation to other templates: The elements depicted in the Application Architecture Diagram can be described in further detail in another Application Architecture Diagram, or in related diagrams such as a Data Flow Diagram.

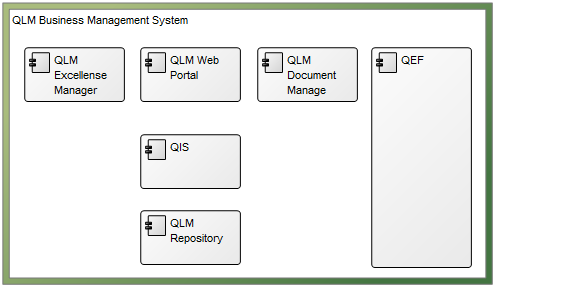
The above picture shows an example of a more detailed view of an information system. In this Application Architecture Diagram the System Components are visible.

For documentation of a physical or hardware layer, the Infrastructure Diagram template can be used.

Properties and metadata: The Application Architecture Diagram can for example retain the following information:

  • A description of the diagram
  • Link to the owner of the application architecture
  • Link to the one responsible for the application architecture
  • Associated documents, diagrams and other objects
  • Inherent Risk detailing risk considerations
  • Governance information detailing information about the published diagram and who has been involved in the approval of the diagram

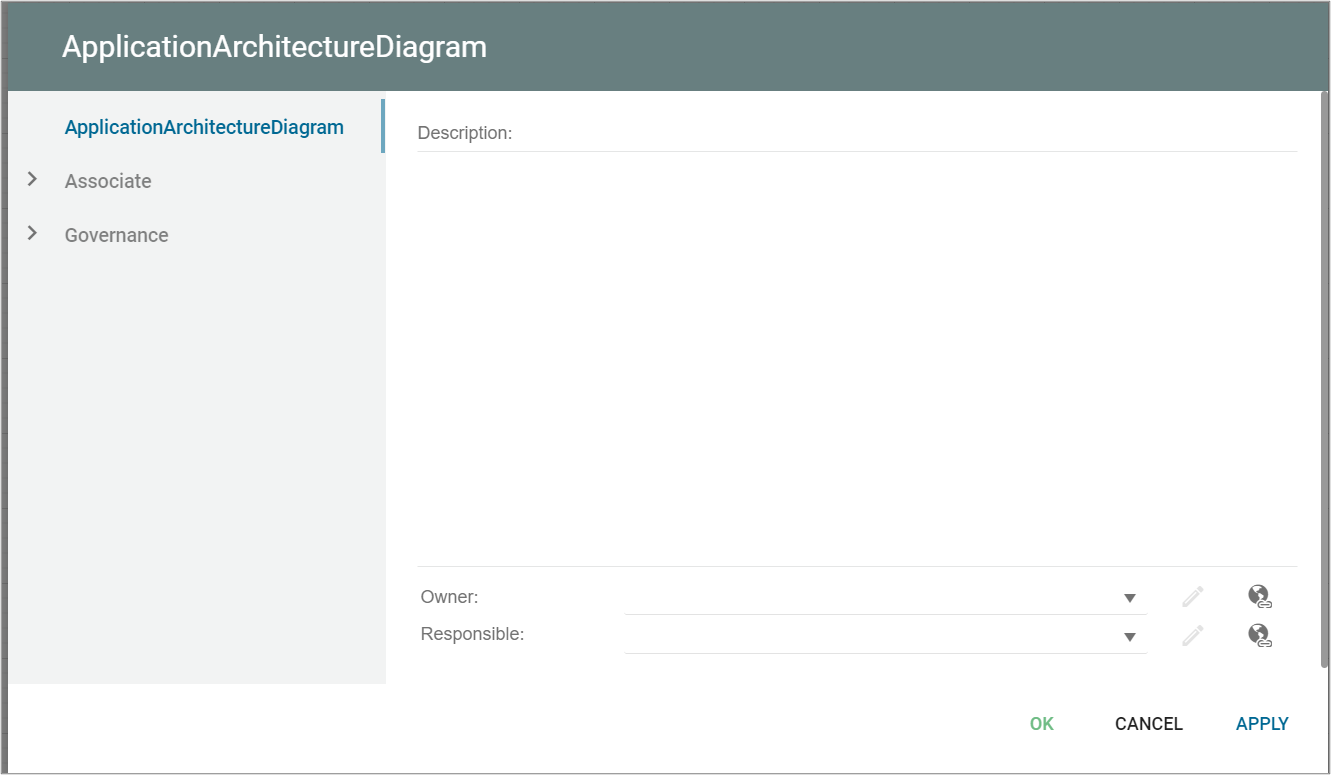
The above picture shows the properties dialogue window for the Application Architecture Diagram where you can view and edit the diagram’s properties.