Business Operating Model

Purpose: The purpose of the Business Operating Model is to visualize how an organization functions and delivers value to its customers. The model presents a ‘one-page-overview’ of the organization and offers a quick way to communicate an organization’s value structure to different types of stakeholders.

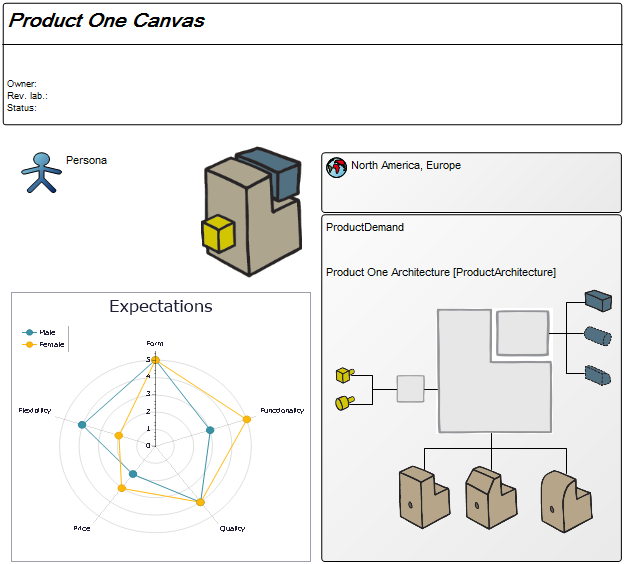
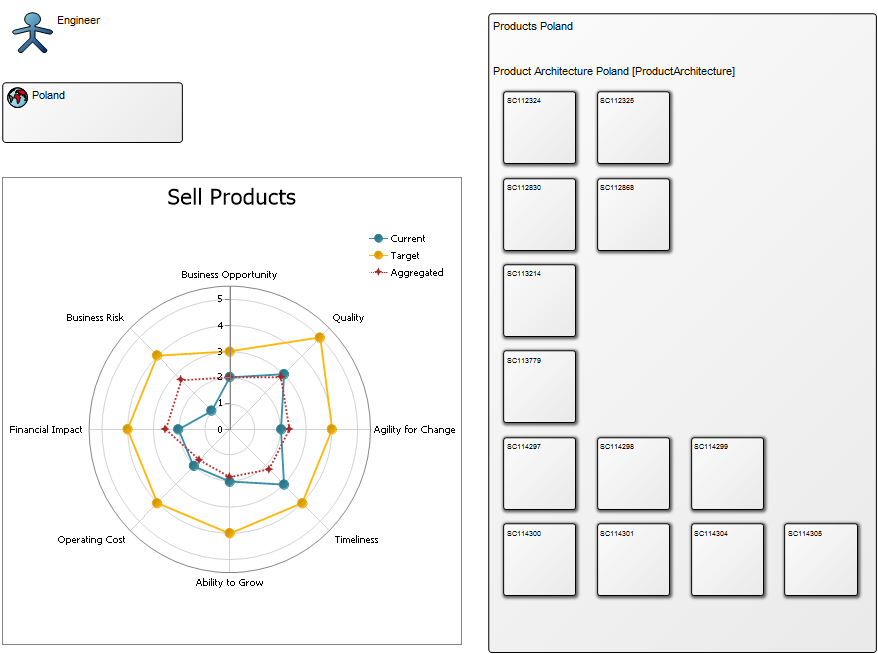
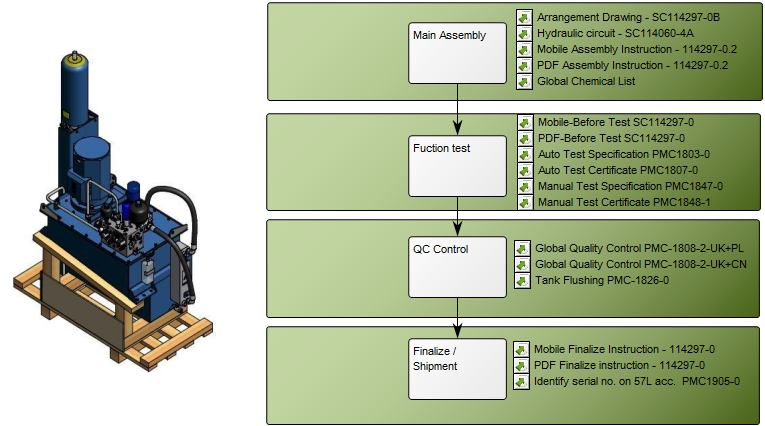
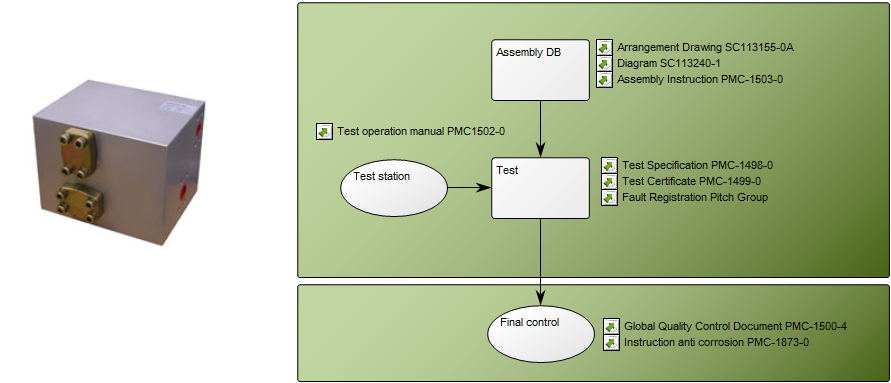
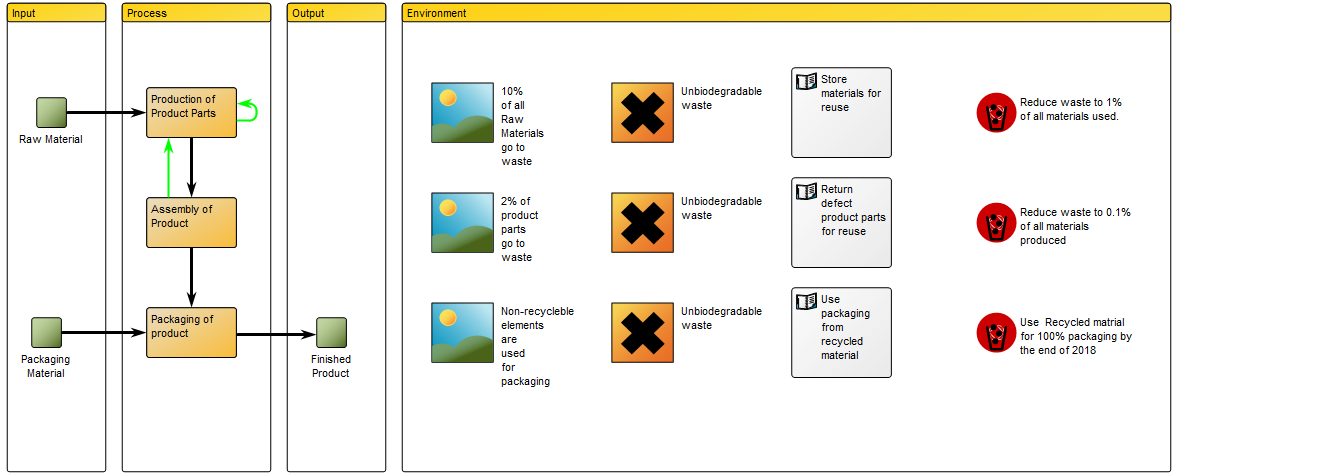
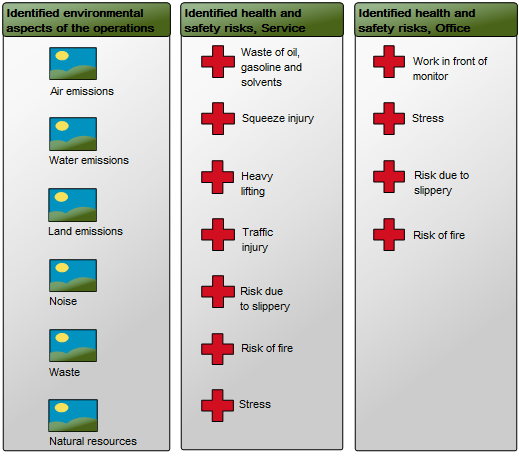
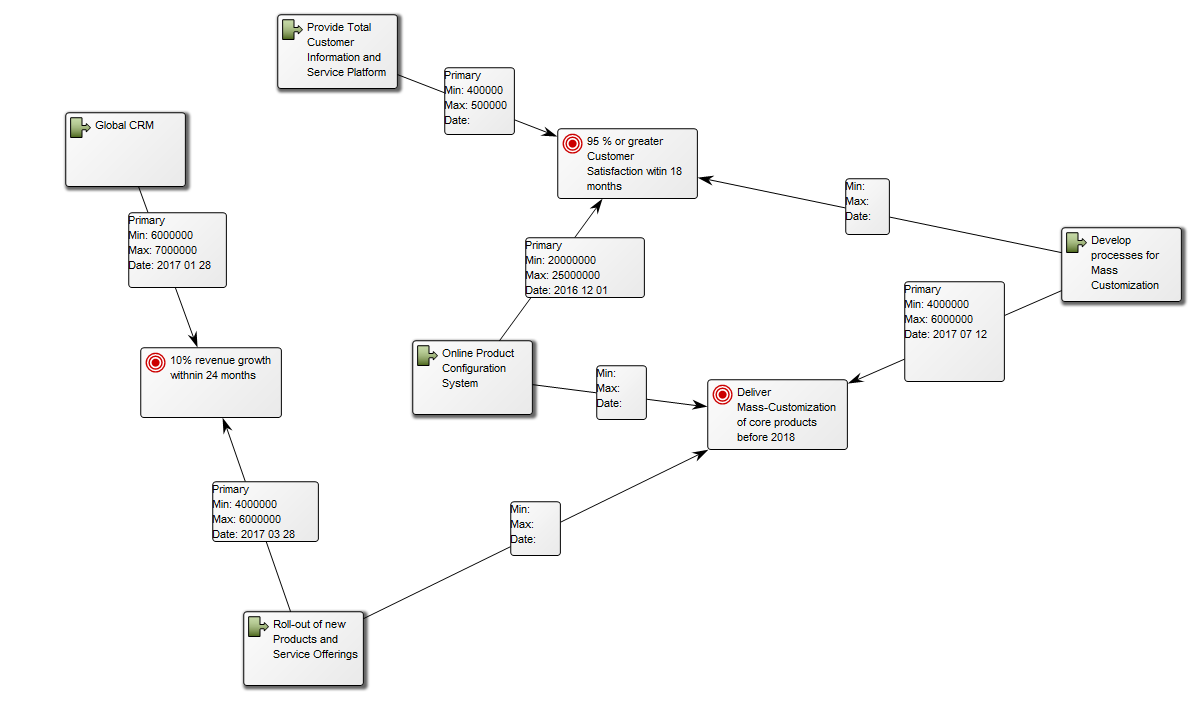
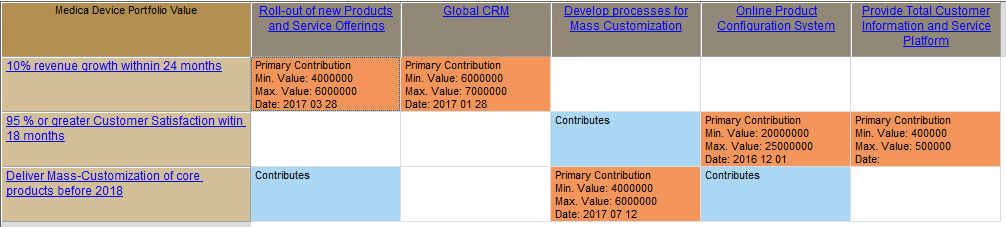
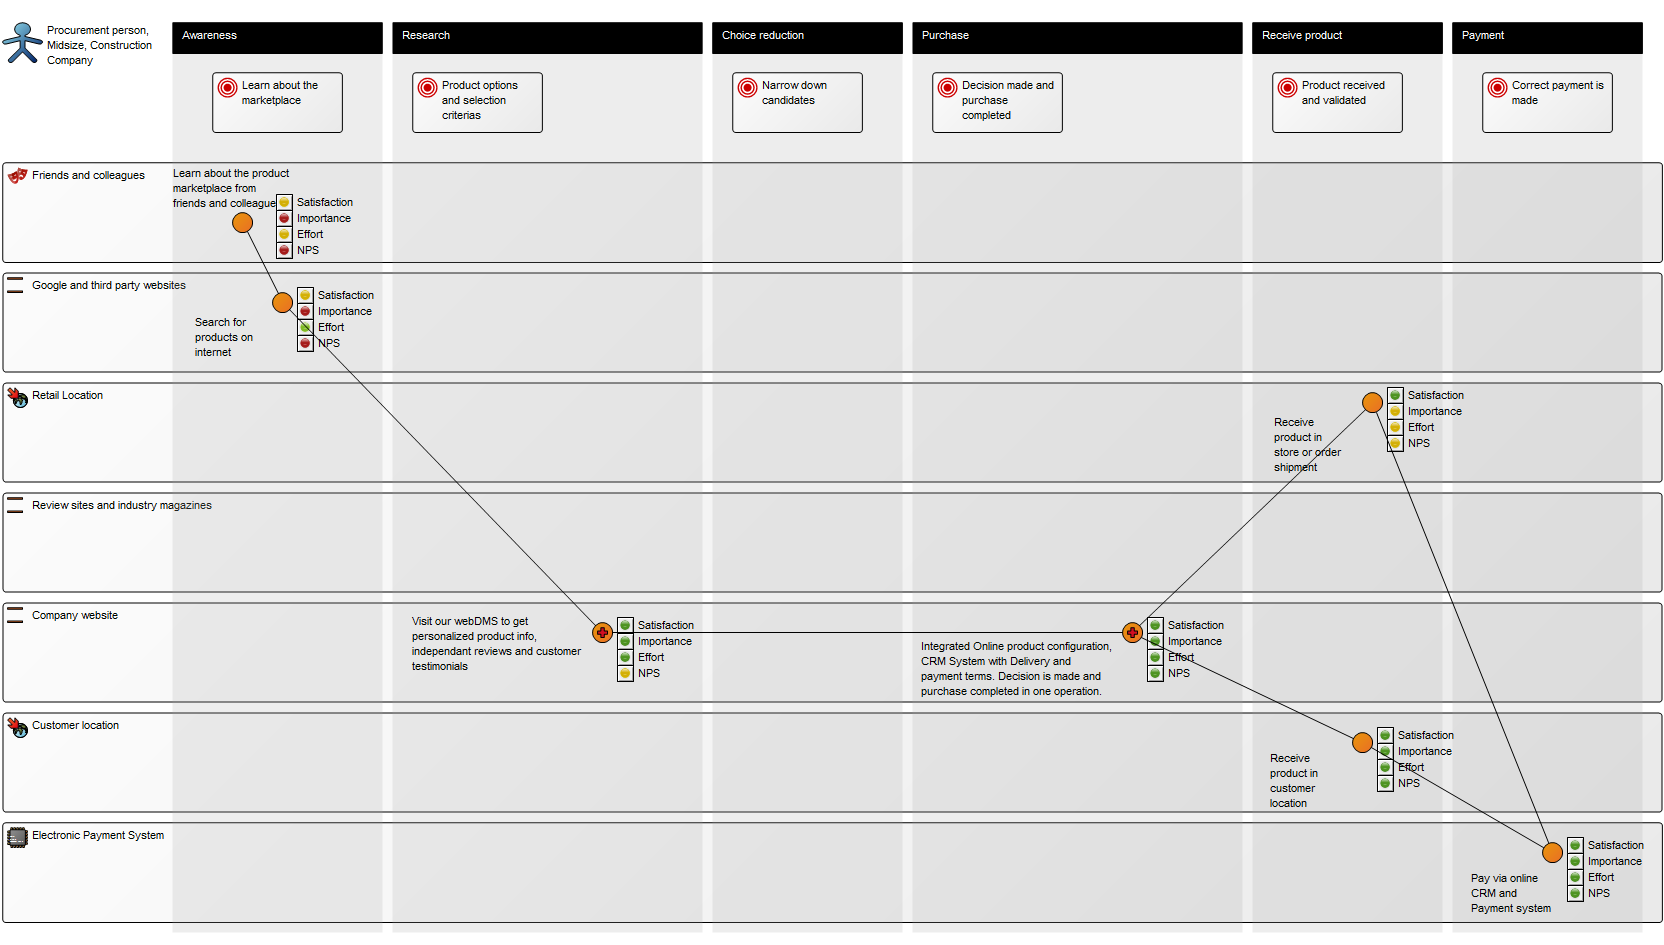
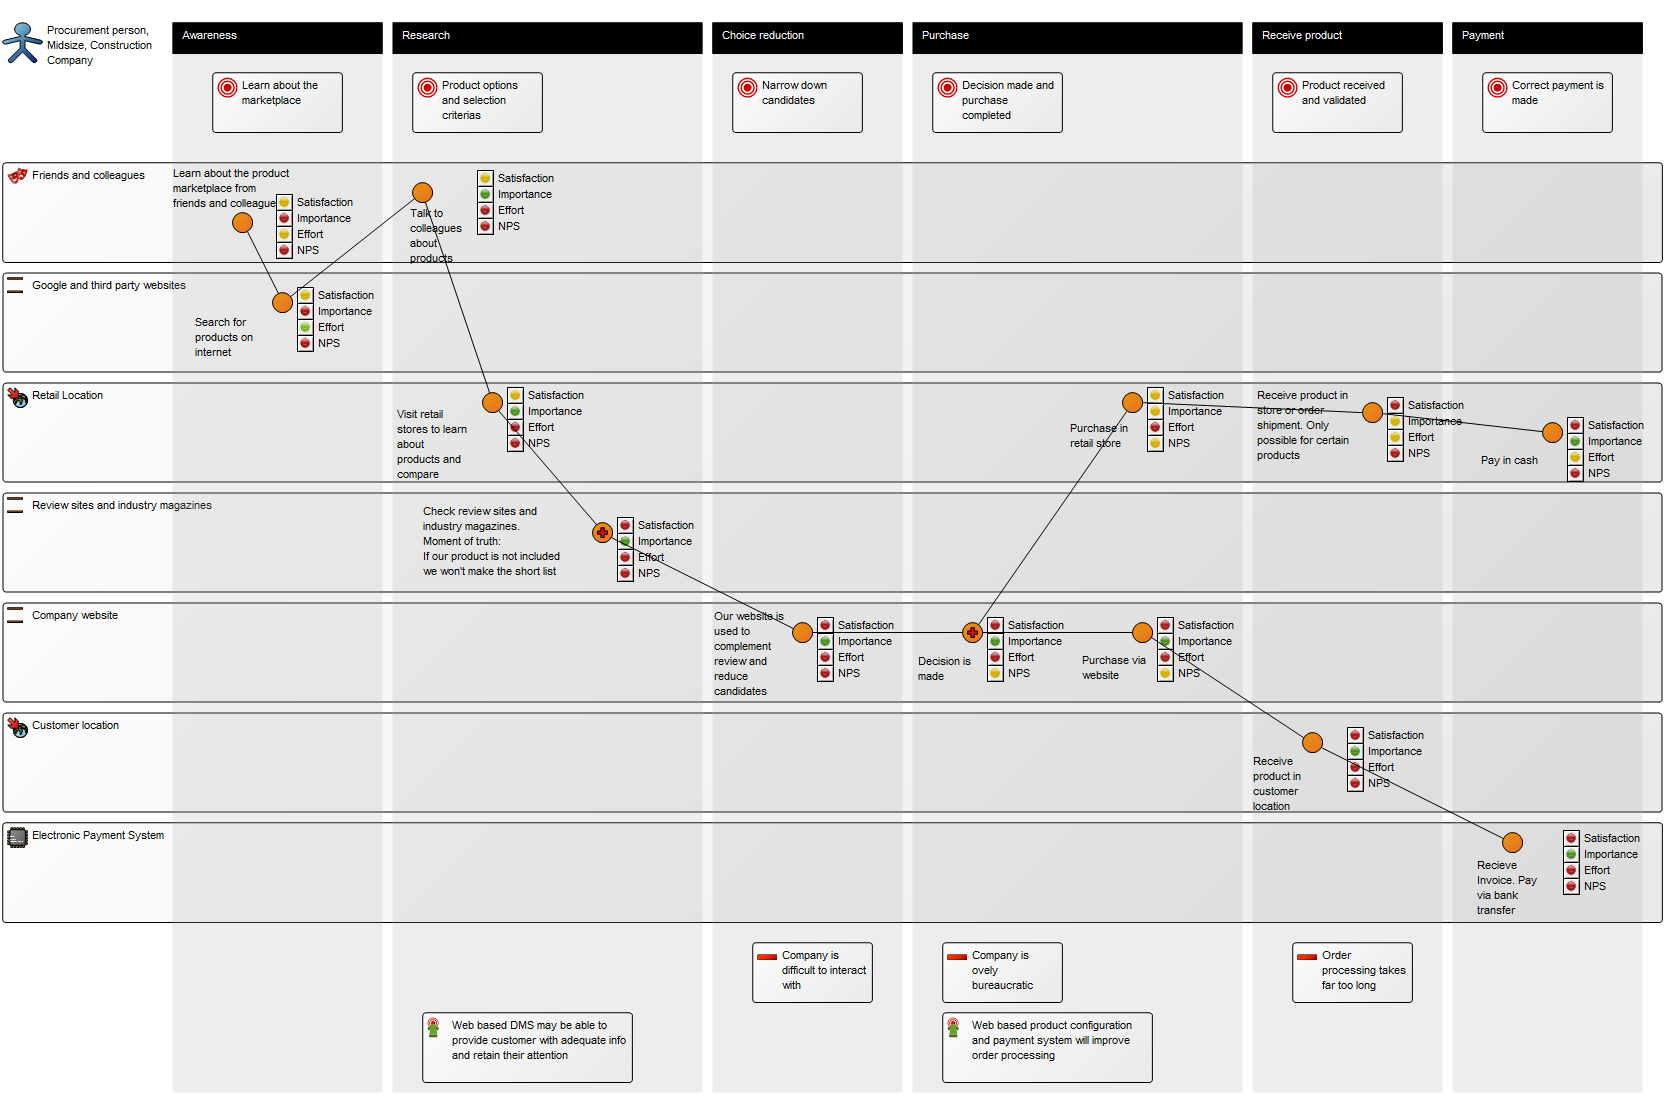
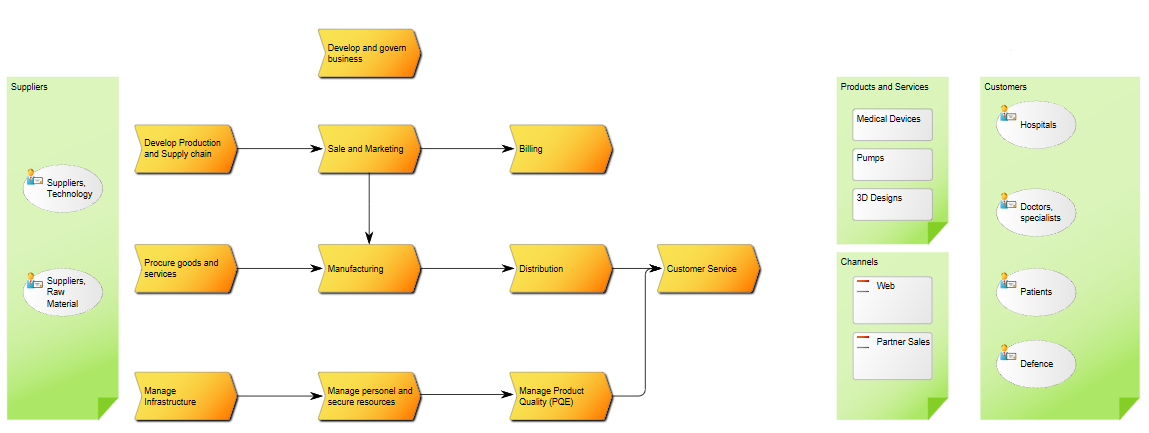
Core concerns: The Business Operating Model can be put together in numerous ways including information on Stakeholders, Business Processes, Products, Projects, Channels, Key Performance Indicators and more. This enables you to create a Business Operating Model that reflects your organization’s specific value chain in detail. Below is an example of a Business Operating Model that shows a business’s suppliers, high-level processes, products & services, channels and customer segments:

Relation to other templates: The Business Operating Model is a strategic model that can be supplied with more detailed models such as a Business Capability Model, Requirement Models, Stakeholder Models and the Business Ecosystem Model.

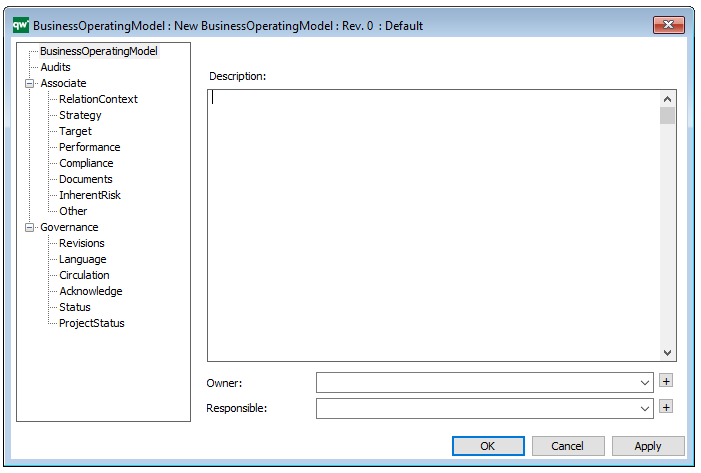
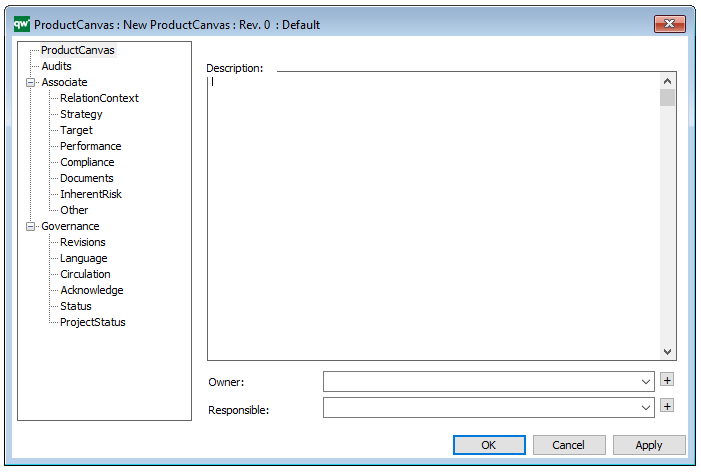
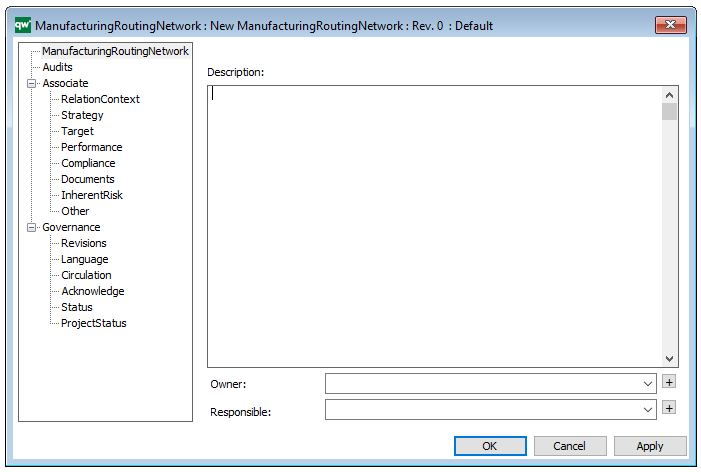
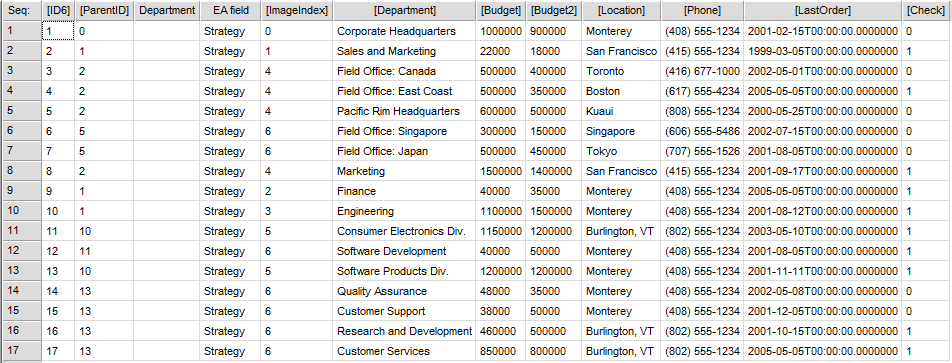
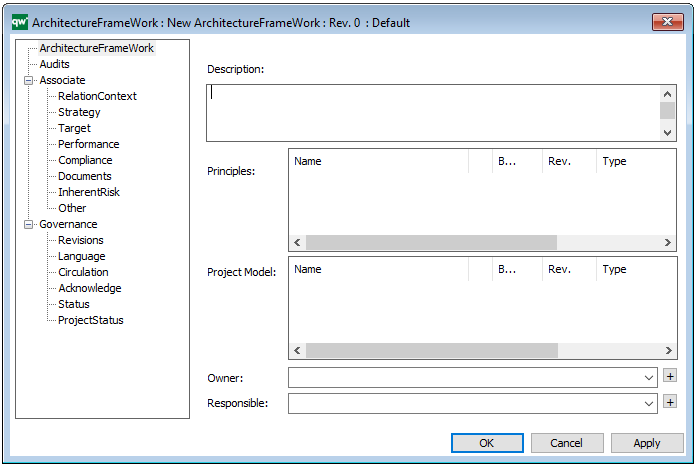
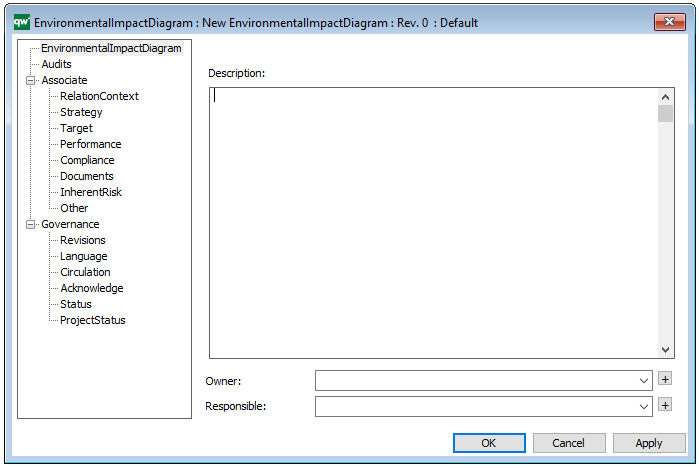
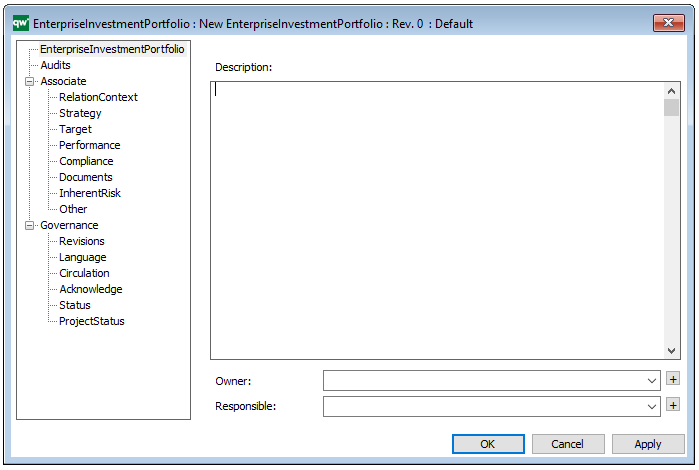
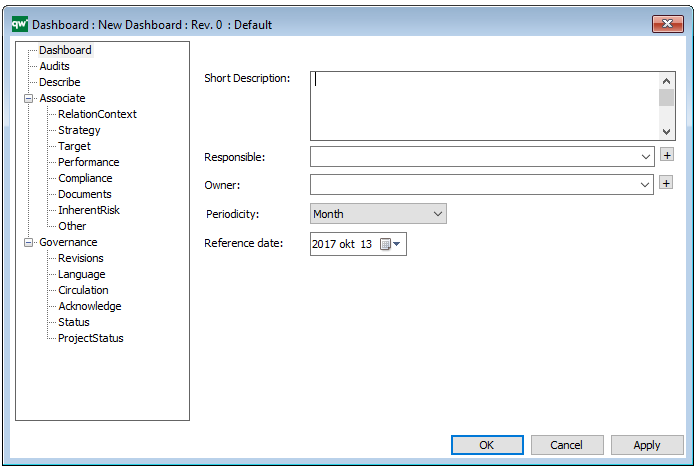
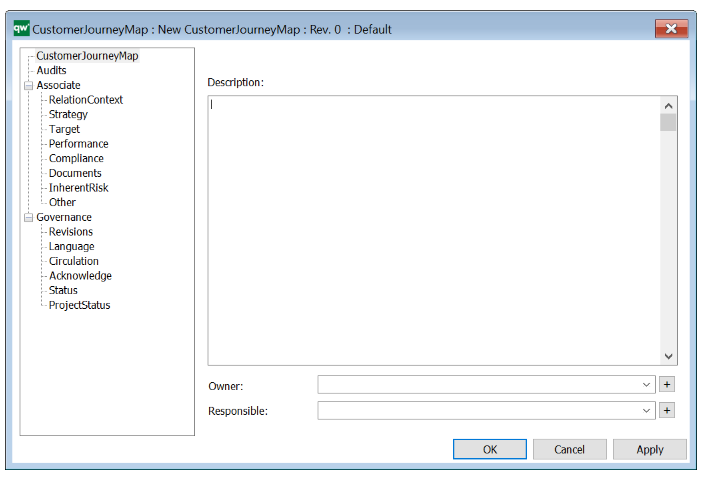
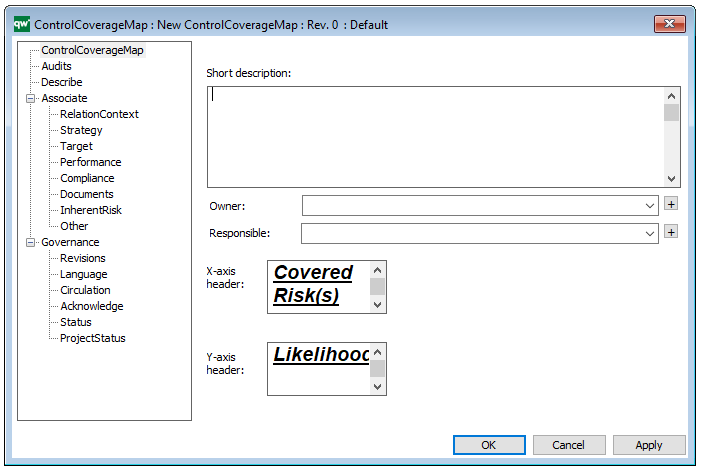
Properties and metadata: The Business Operating Model can for example retain the following information:

  • A description of the diagram
  • Link to the owner of the diagram
  • Link to the one responsible for the accuracy of the diagram
  • Audits (auto generated information regarding its current state and access rights)
  • Associated documents, diagrams and other objects
  • Inherent Risk detailing risk considerations
  • Governance information detailing information about the published diagram and who has been involved in the approval of the diagram
  • Project status: information about budgeted and actual man-hours spent, percentage completed and the latest milestone, result and quality control of a change process.

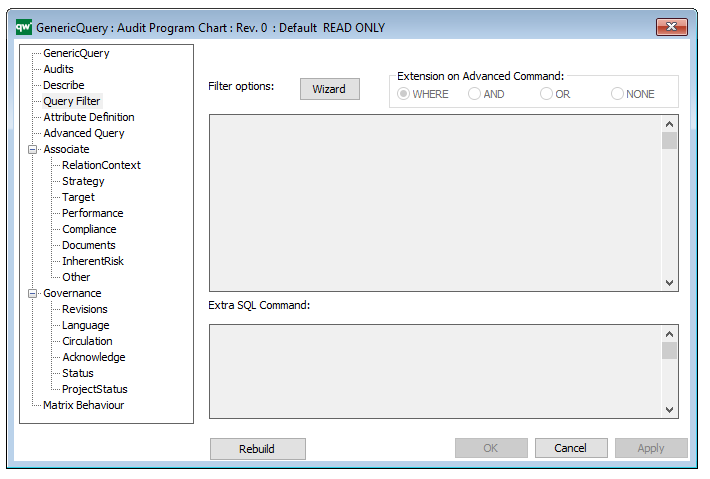
In the picture below you can see the Business Operating Model’s properties dialogue window, where the information can be viewed and edited:

Product Canvas

Purpose: The purpose of the Product Canvas template is to present the relevant information related to a specific product.

Core concerns: The Product Canvas template enables you to gather relevant Business Charts and model Personae, Product Demands, Markets, Locations and Products. Additionally, you can model a SWOT analysis that details the Strengths, Weaknesses, Opportunities and Threats the product is affected by.

Below, you can see two Product Canvases. The first has its focus on a product within two markets, showing the expectations two different customer segments have to the product.

ProductCanvas_2

The second example shows information related to a specific market, Poland, including product architecture and business assessment:

ProductCanvas_1

Relation to other templates:

The Product Canvas Template is inherently related to the Product Architecture, Product Roadmap and Product Variant Master, in the sense that all these models focus on different aspects of the lifecycle of a product. Furthermore, you can create additional Business Charts for the Product Canvas by using the dedicated template. Another view on projects and initiatives are provided from the Enterprise Investment Portfolio. There, the reasoning behind the investment in the project is visualized by connecting the initiative (in this case a new product) to the specific goals of the enterprise that it contributes to. Another view on how the product meets customer needs can be documented in the Value Proposition Canvas.

Properties and metadata: The Product Canvas can for example retain the following information:

  • A description of the diagram
  • Link to the owner of the canvas
  • Link to the one responsible for the canvas
  • Audits (auto generated information regarding its current state and access rights)
  • Associated documents, diagrams and other objects
  • Inherent Risk detailing risk considerations
  • Governance information detailing information about the published diagram and who has been involved in the approval of the diagram

The above picture shows the properties dialogue window for the Product Canvas where you can view and edit the diagram’s properties in QualiWare Lifecycle Manager.

Manufacturing Routing Network

Purpose: The purpose of the Manufacturing Routing Network is to specify the steps used in manufacturing a product. Below is an example of a Manufacturing Routing Network of an Item including Assembly, test and final control. At the right-hand side, you can see that different specifications have been attached as well:

ManufacturingRoutingNetwork_2

Core concerns: The Manufacturing Routing Network template enables you to model Work Operations, Products, Business Objects, General Concepts, and Production Lines. You are also able to distinguish between Activity Paths, Assembly Flows and Transport Systems. If you wish to attach External Documents, they should be attached to the Work Operations they pertain to. Below is another example of a Manufacturing Routing Network that describes the process from assembly to shipping:

ManufacturingRoutingNetwork_1

Relation to other templates: The Manufacturing Routing Network template is related to the various different models for products such as the Product Viewpoint template, the Product Variant Master template, the Product Rule Table, the Product Roadmap and the Product Canvas. Each template offers a different viewpoint of the product in various stages of its lifecycle.

Properties and metadata: The Manufacturing Routing Network template can for example retain the following information:

  • A description of the diagram
  • Link to the owner of the diagram
  • Link to the one responsible for the accuracy of the diagram
  • Audits (auto generated information regarding its current state and access rights)
  • Associated documents, diagrams and other objects
  • Inherent Risk detailing risk considerations
  • Governance information detailing information about the published diagram and who has been involved in the approval of the diagram
  • Project status: information about budgeted and actual man-hours spent, percentage completed and the latest milestone, result and quality control of a change process.

In the picture below you can see the Manufacturing Routing Network’s properties dialogue window, where the properties can be viewed and edited:


Lifecycle Assessment Diagram

Purpose: The purpose of the Life Cycle Assessment Diagram template is to document the relations for an activity or product in a lifecycle context.

Core concerns: The Lifecycle Assessment Diagram concerns itself with modelling elements in a company that interact with the environment. The template enables you to model Environmental Aspects and Objectives for Activities in your organization. This template allows you to model Business Objects, Activities, Performance Indicators, Business Connection, Goals, Policies, Critical Success Factors, Change Requests and Problems. These elements can be grouped into Categories and connected by Impact Quantity, Recycling, Logistical Flows, Information Flows, and Activity Paths.

Below, you can see an example of a Lifecycle Assessment Diagram for a Product, from production to packaging, focusing on reducing unbiodegradable waste:

The elements used in this example are Business Objects as input and output, Activities showing Logistical Flows and Recycle under Process. Under the Environment Category, Environmental Aspects, Impact and Objectives are identified and Policies for reaching the Objectives are also included. The diagram focus on a single Environmental impact: Waste. You can also choose to map out several Environmental impacts that are relevant to a specific activity or product.

Relation to other templates: The Environmental Aspects and Impacts from the Lifecycle Assessment Diagram can be further explored in the Environmental Impact Diagram. The Lifecycle Assessment Diagram is also related to the Business Process Diagram and Workflow Diagram, in the sense that they all are related to detailing aspects of processes. The Lifecycle Assessment Diagram can also be decomposed from the Inventory object shown in, for example, the Production Site template.

Properties and metadata: The Lifecycle Assessment Diagram template ­­­­can for example retain the following information:

  • A description of the diagram
  • Link to the owner of the diagram
  • Link to the one responsible for the diagram
  • Audits (auto generated information regarding its current state and access rights)
  • Associated documents, diagrams and other objects
  • Inherent Risk detailing risk considerations
  • Governance information detailing information about the published diagram and who has been involved in the approval of the diagram

The above picture shows the properties dialogue window for the Lifecycle Assessment Diagram template, where you can view and edit the diagram’s properties in QualiWare Lifecycle Manager.

For more information: You can learn more about Lifecycle Assessment on the US Sustainable Facilities Tool website or turn to ISO standard 14040.

Generic Query

Purpose: The Purpose of the Generic Query template is to provide datasets for QualiWare System templates.

Core concerns: The Generic Query template is an auxiliary template. The Generic Query can be created using a Query Design template which enables you to easily structure the query for creating reports. When creating a Report for a diagram, the Generic Query created using the Query Design should be used as a Data Set in the Report Definition.

A Generic Query can also be generated using its Property Dialog, where you can link to Data Source and filter the data selection using a wizard – see example of the property dialog below:

The Generic Query can, for example, take the form of data sheets:

GenericQuery_2

The Generic Query template can also execute a command using the Advanced Query tab:

Relation to other templates: Generic Queries are automatically created when creating a Query Design. Generic Queries are used in the following templates: HTML Template Definitions, HTML Embedded content, HTML Publisher and HTML Content tab.

Properties and Metadata: The Generic Query can for example rentain the following information:

  • A description
  • Audits (auto generated information regarding its current state and access rights)
  • Query Filter, including a wizard for filter options
  • Attribute Definition
  • Advanced Query
  • Matrix Behavior

The above picture shows the properties dialogue window for the Generic Query where you can view and edit the diagram’s properties in QualiWare Lifecycle Manager.


Environmental Impact Diagram

Purpose: The purpose of the Environmental Impact Diagram template is to document the environmental aspects and impacts for an Activity or Business Process.

Core concerns: The Environmental Impact Diagram enables you to model Business Functions, Activities, Business Objects, Environmental Aspects (Environmental Aspect, Environmental Impact, Health and safety impact) and Business Scopes. These elements can then be connected by Impact Quantities.

Below, you can see an example of an Environmental Impact Diagram, detailing the Environmental aspects and Health and safety impact:

EnvironmentalImpactDiagram_1

The diagram shows all identified aspects and modes of impact for one or more specific processes.

Relation to other templates: The Environmental Impact Diagram is related to the Lifecycle Assessment diagram as well as templates containing Activities, Business Functions, Lines of Business, and Logistical Flows. As such, it is related to, for example, Business Process Diagrams, Workflow Diagrams, Business Diagrams, and Strategy Models.

Properties and metadata: The Environmental Impact Diagram template ­­­­can for example retain the following information:

  • A description of the diagram
  • Link to the owner
  • Link to the responsible
  • Audits (auto generated information regarding its current state and access rights)
  • Associated documents, diagrams and other objects
  • Inherent Risk detailing risk considerations
  • Governance information detailing information about the published diagram and who has been involved in the approval of the diagram

The above picture shows the properties dialogue window for the Environmental Impact Diagram, where you can view and edit the diagram’s properties in QualiWare Lifecycle Manager.

Enterprise Investment Portfolio

Purpose: The purpose of the Enterprise Investment Portfolio template is to model enterprise goals and investments.

Core concerns: The Enterprise Investment Portfolio template enables you to model Goals, Projects, and Initiatives. The projects and initiatives can be connected to enterprise goals them through Project Contributions, that show the viable minimum and optimistic maximum of the value contribution. Below, you can see an example of an Enterprise Investment Portfolio, where the way goals are realized is visualized:


EnterpriseInvestmentPortfolio_1

Other Functionalities: By using the Enterprise Investment Actions tab, you can create, for example, a Portfolio Value matrix, which offers another way to view the same data:

Relation to other templates: The Enterprise Investment Portfolio is a strategic template and is as such related to the enterprise’s Strategy Model, Strategic Roadmap, Business Canvas and Innovation Canvas. The projects contained in the initiatives can also be further described in the Work Model template.

Properties and metadata: The Enterprise Investment Portfolio template can for example retain the following information:

  • A description of the diagram
  • Link to the owner of the diagram
  • Link to the one responsible for the diagram
  • Audits (auto generated information regarding its current state and access rights)
  • Associated documents, diagrams and other objects
  • Inherent Risk detailing risk considerations
  • Governance information detailing information about the published diagram and who has been involved in the approval of the diagram

The above picture shows the properties dialogue window for the Enterprise Investment Portfolio template, where you can view and edit the diagram’s Properties in QualiWare Lifecycle Manager.

For more information: This model type is used in the Enterprise Investment Methodology developed by Chris Potts and QualiWare. To learn more about Enterprise Investment, you can about it here:Enterprise Investment.

Dashboard

Purpose: The purpose of the Dashboard template is to publish selections of Business Charts targeting different stakeholders. It should be used to gather a series of relevant or connected Business Charts to provide a dashboard-like overview.

Core concerns: The Dashboard template enables you to gather Business Charts, Key Performance Indicators, Performance Indicators and General Concepts to create stakeholder specific views of analyzed data. For example, an Enterprise Architect could find a Dashboard containing Business Charts relevant to the usage and governance of the Enterprise Architecture useful.

Below, you can see examples of different Dashboards presenting an array of Business Charts:

Dashboard_1


Dashboard_2

Relation to other templates: The Dashboard template is closely connected to the Business Chart template, as the Dashboard publishes the charts the Business Chart template generates.

Properties and metadata: The Dashboard can for example retain the following information:

  • A description of the Dashboard
  • Link to the owner of the Dashboard
  • Link to the one responsible for the Dashboard
  • Audits (auto generated information regarding its current state and access rights)
  • Associated documents, diagrams and other objects
  • Inherent Risk detailing risk considerations
  • Governance information detailing information about the published diagram and who has been involved in the approval of the diagram

The above picture shows the properties dialogue window for the Dashboard template where you can view and edit the dashboard’s properties in QualiWare Lifecycle Manager.

Customer Journey Map

Purpose: The Purpose of the Customer Journey Map template is to document the customer’s journey from awareness to the end of their interaction with an organization, covering possible touch points from the customer’s perspective.

Core Concerns: The Customer Journey Map template allows you to model connections between different Personas, Customer Journey Phases, Touch Points, Goals, Roles, Locations, Channels, Technology and the aspects from a SWOT analysis.

You can choose to model both a current state and a desired future state of the customer journey and use the documentation for process improvement. Below is an example of a current state model and a future state model:

Current state model:

CustomerJourneyMap_2

Desired future model:

CustomerJourneyMap_1

Other functionalities: The customer’s touchpoints can be elaborated upon with four scores for Customer Satisfaction, Customer Importance, Customer Effort and Net Promoter Score. Particularly vital touchpoints can be designated as a Moment of Truth.

Relation to other templates: The Customer Journey Map can be used as a groundwork for a strategic change, which for example can be modelled in a Work Model, a Business Capability Model and/or a Strategy Model.

Properties and metadata: The Customer Journey Map can for example retain the following information:

  • A description of the diagram
  • Link to the owner of the diagram
  • Link to the one responsible for the accuracy of the diagram
  • Audits (auto generated information regarding its current state and access rights)
  • Associated documents, diagrams and other objects
  • Inherent Risk detailing risk considerations
  • Governance information detailing information about the published diagram and who has been involved in the approval of the diagram
  • Project status: information about budgeted and actual man-hours spent, percentage completed and the latest milestone, result and quality control of a change process.

The above picture shows the properties dialogue window for the Customer Journey Map, where you can view and edit the diagram’s properties.

For more information: on Customer Journey Mapping, please view our webinar Experience Mapping – Customer Obsession for IT and Digital Professionals with Milan Guenther and Katharina Weber.


Control Coverage Map

Purpose: The purpose of the Control Coverage Map is to provide an overview of uncovered risks, residual risks and potential cost of the risk occurring.

Core concerns: The Control Coverage Map concerns itself with Financial Risk Management and is created using the Actions tabs in QLM. It can be created based on the information in a Risk Heatmap or by using information from a diagram which contains risks that also have control actions.

Below, you can see an example of a Control Coverage map for four risks related to a Bellhouse, a Pump, a Suction pipe and using Check lists:

ControlCoverageMap

The Blue column represents the likelihood of the risk before the control action, the green column represents the likelihood of the risk after the implementation of a control action. The red columns represent the estimated cost if the risk is realized.

Relation to other templates: The Control Coverage Map presents graphical views of information from other diagrams the same as the Heatmap, Business Charts and the Graphical Matrix. It can be used by any diagram containing Activities with attached risks that have control activities.

Properties and metadata: The Control Coverage Map ­­­­can for example retain the following information:

  • A description
  • Link to the owner
  • Link to the one responsible
  • Graphical specification for the headers of the X-axis and Y-axis
  • Audits (auto generated information regarding its current state and access rights)
  • Associated documents, diagrams and other objects
  • Inherent Risk detailing risk considerations
  • Governance information detailing information about the published diagram and who has been involved in the approval of the Control Coverage Map

The above picture shows the properties dialogue window for the Control Coverage Map template where you can view and edit the template’s properties in QualiWare Lifecycle Manager.