Performance Diagram

Purpose: The purpose of the Performance Diagram is to provide a view over an organization’s performance in reaching their strategic goals.

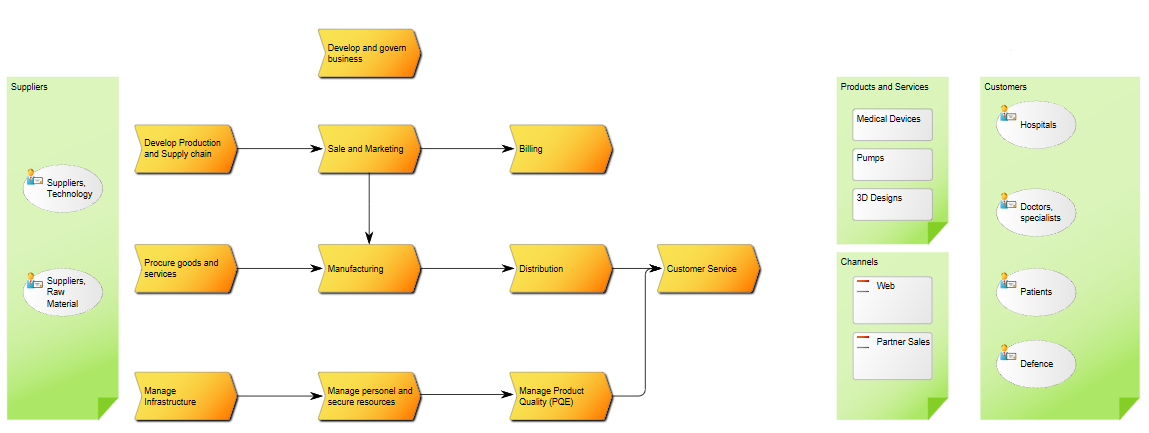
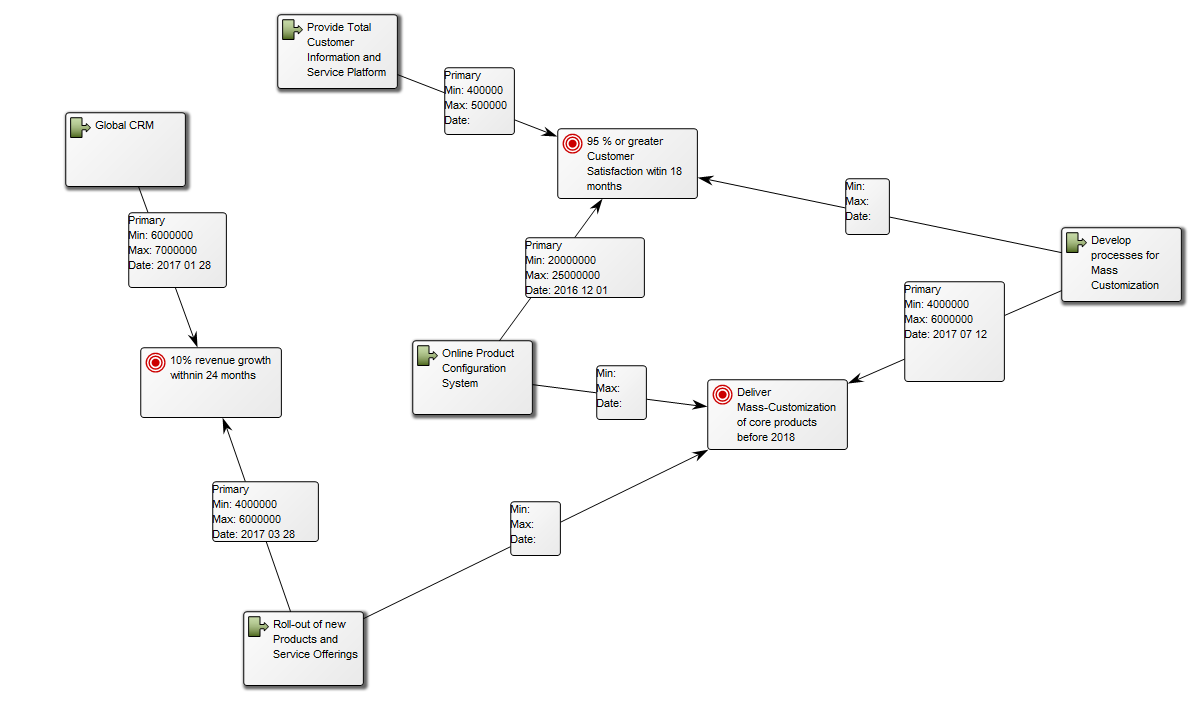
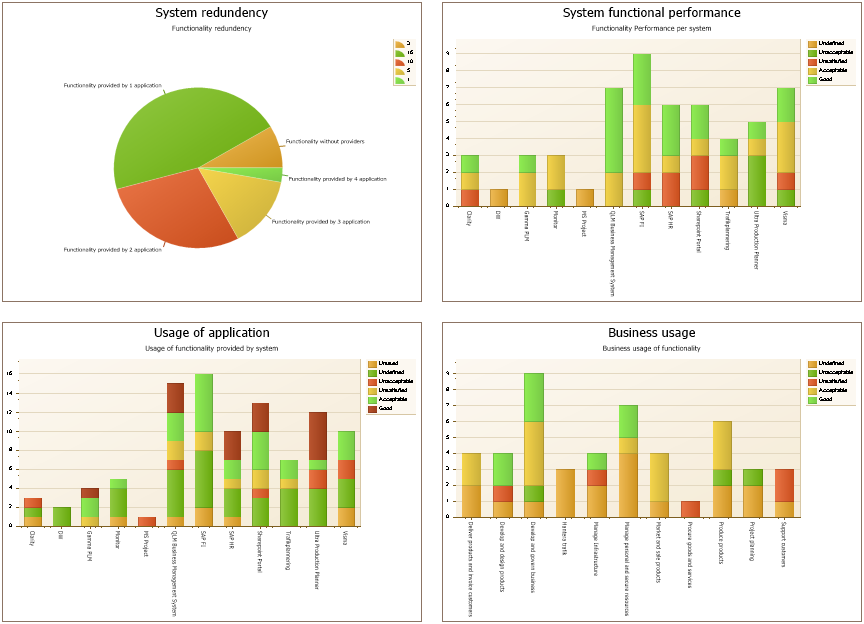
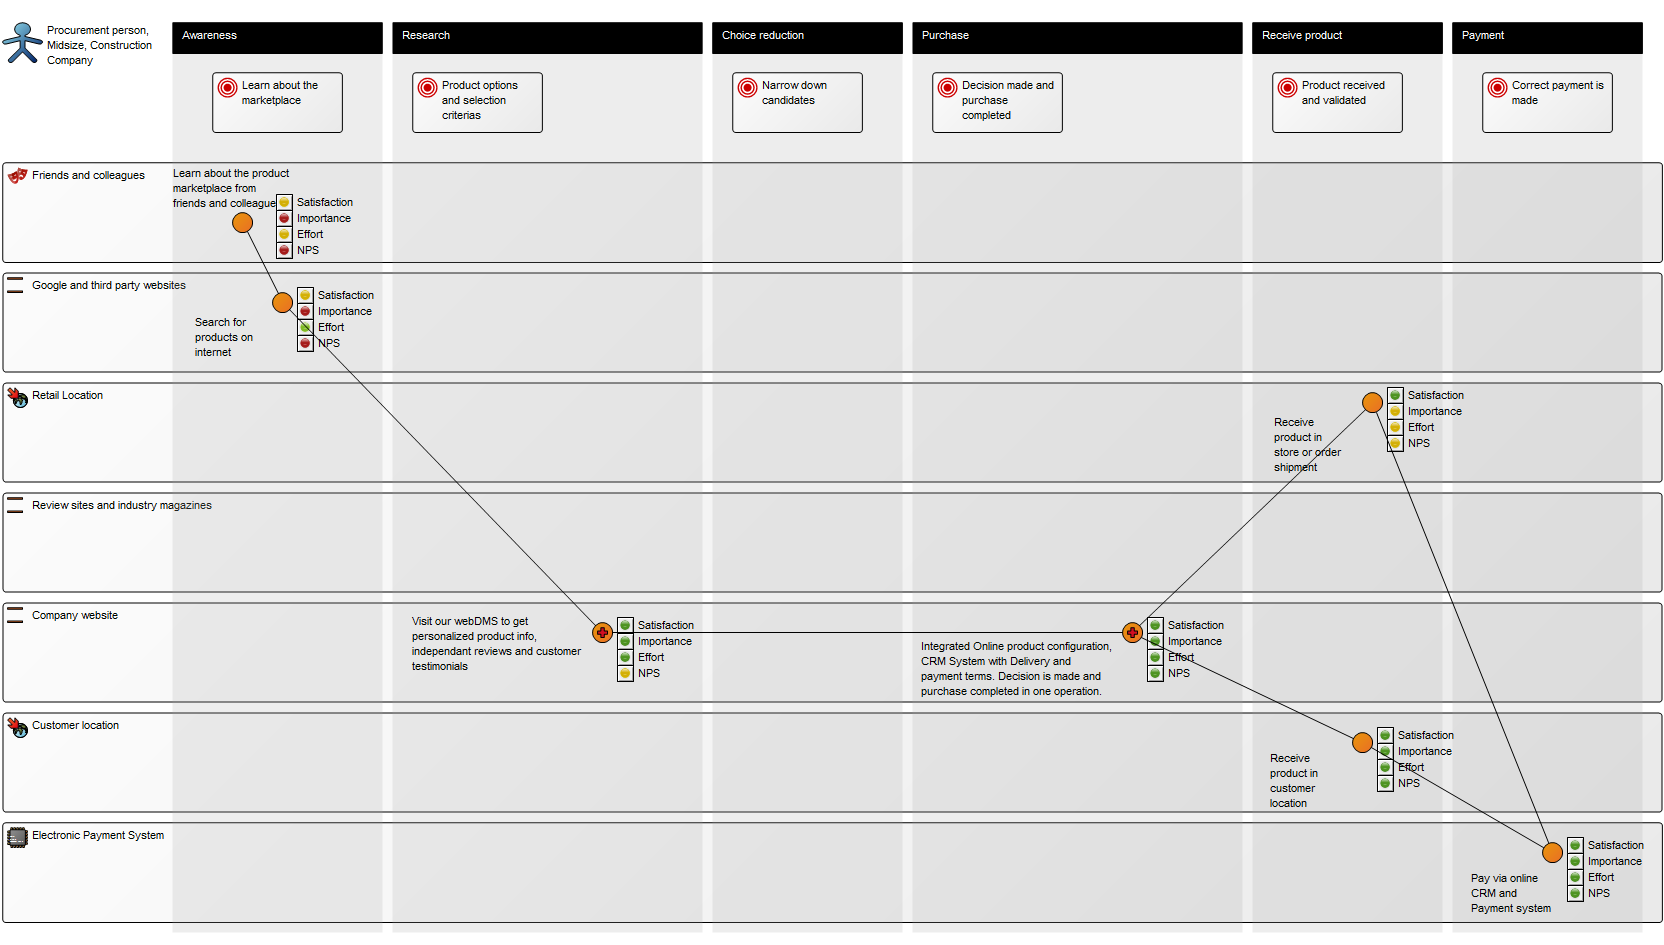
Core concerns: The Performance Diagram enables you to model Key Performance Indicators – which can be related to strategic goals, derivative Performance Indicators and Derivation Rules. You can create a Performance Diagram as a decomposition of a Key Performance Indicator and model a hierarchy of performance diagrams. The model below shows an overview of an organizations Key Performance Indicators and their status:

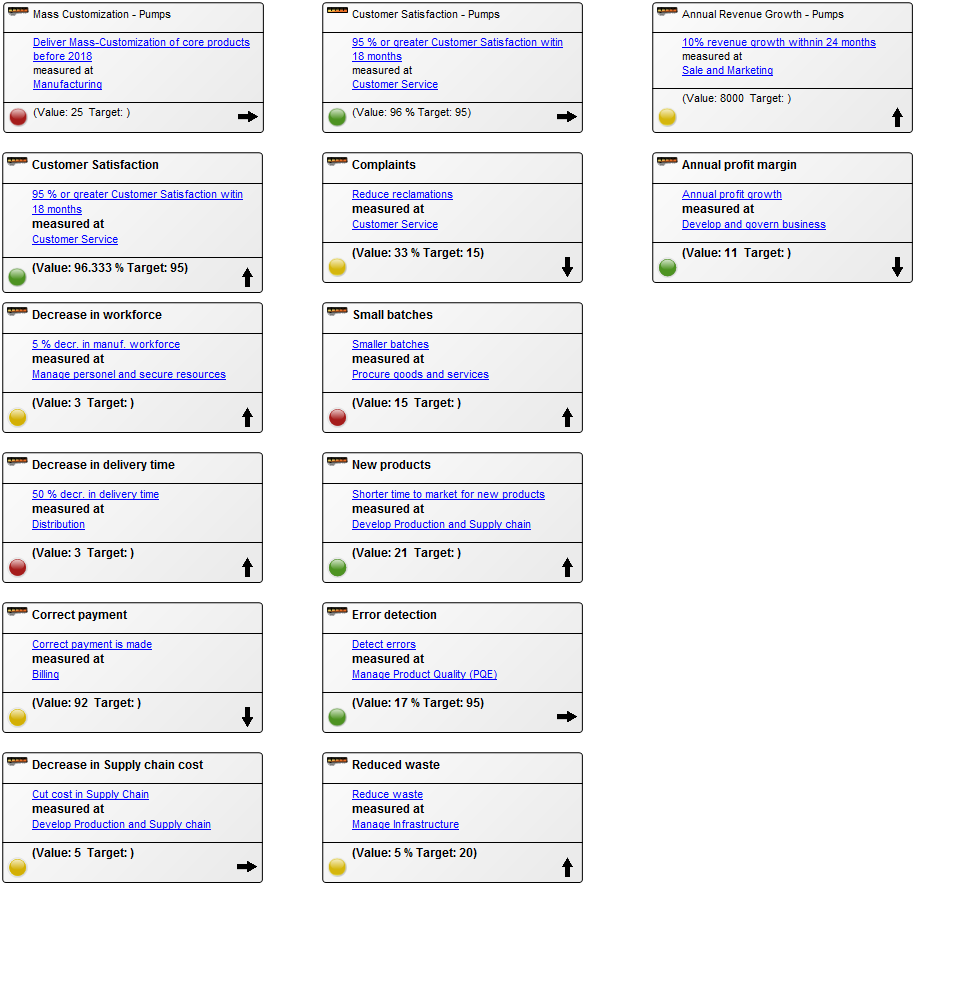
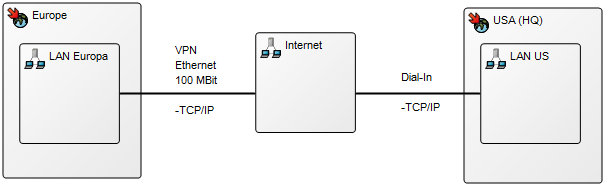
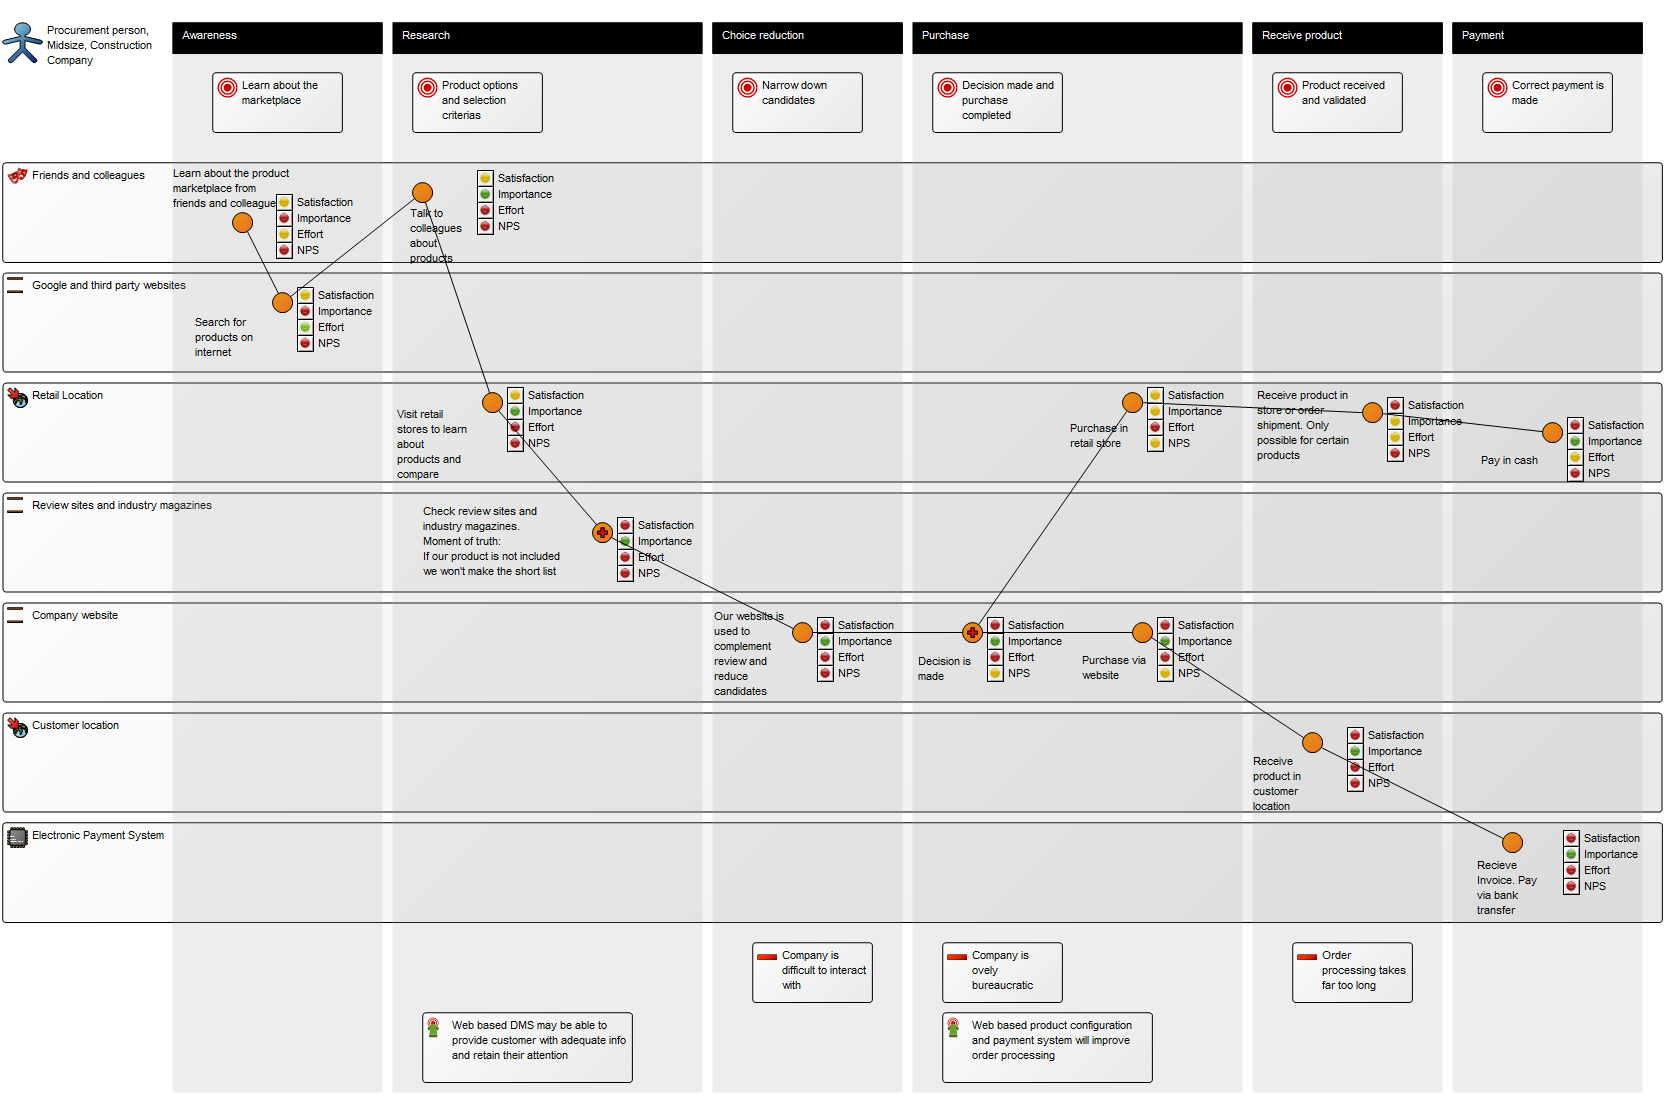
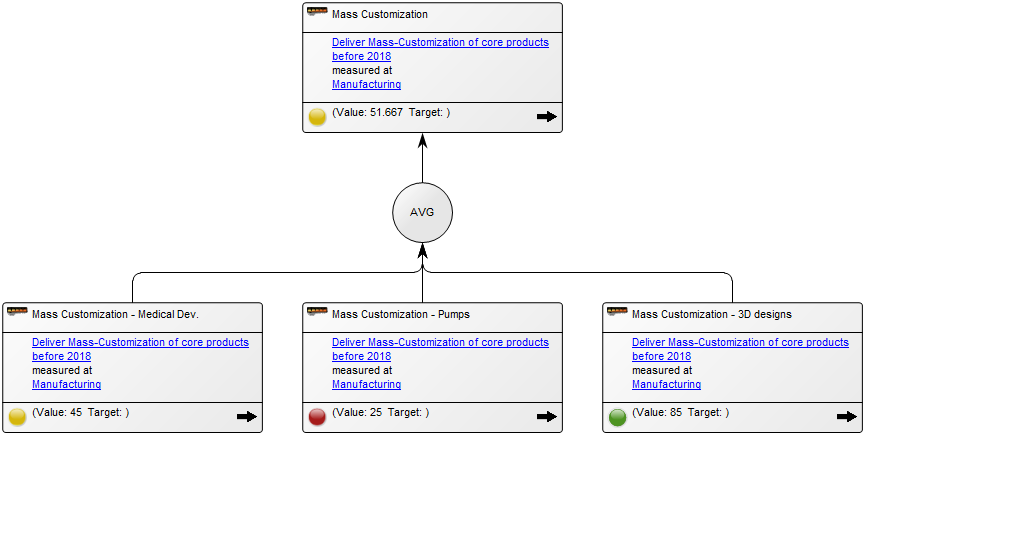
In the following model the Key Performance Indicator has been enriched with derivative performance indicators explaining in more details the status of the performance and how it is measured:

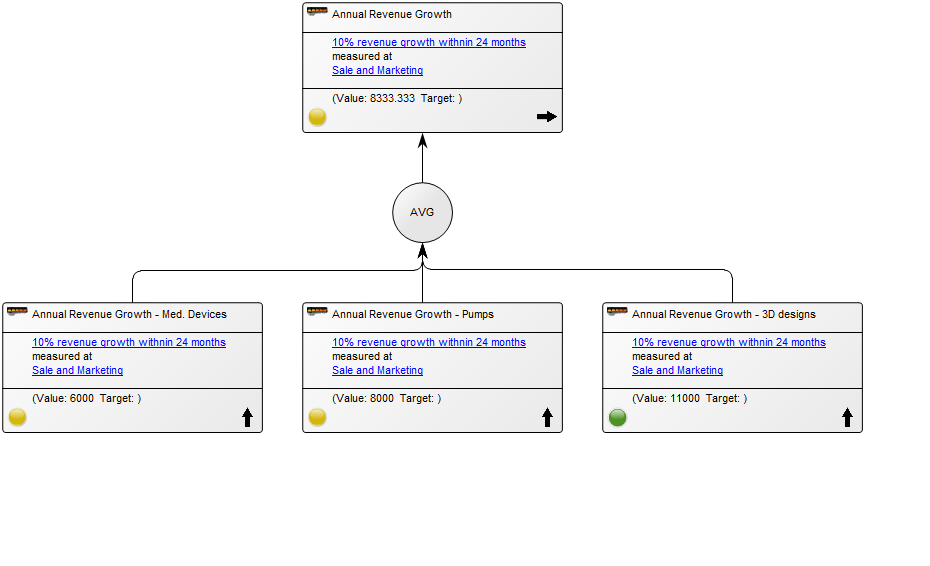
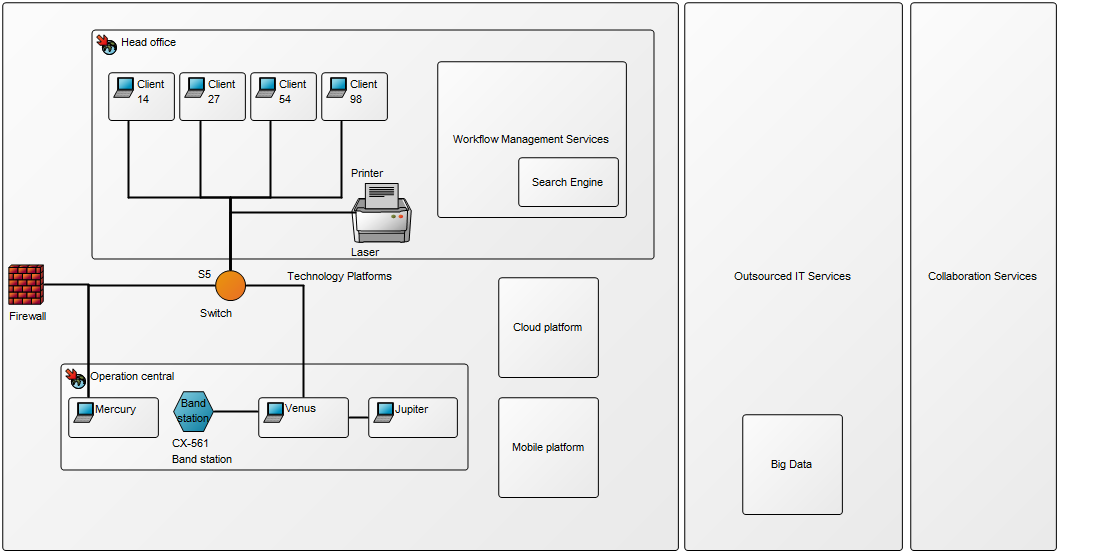
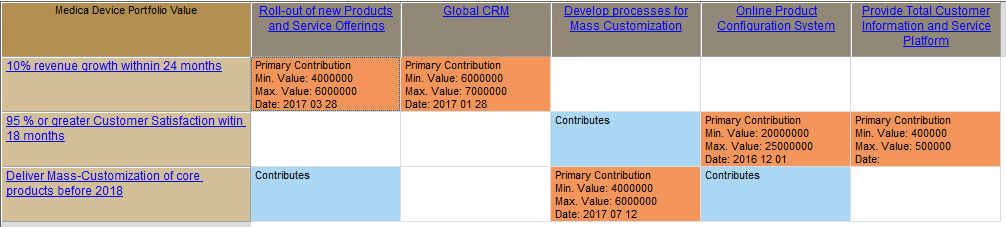
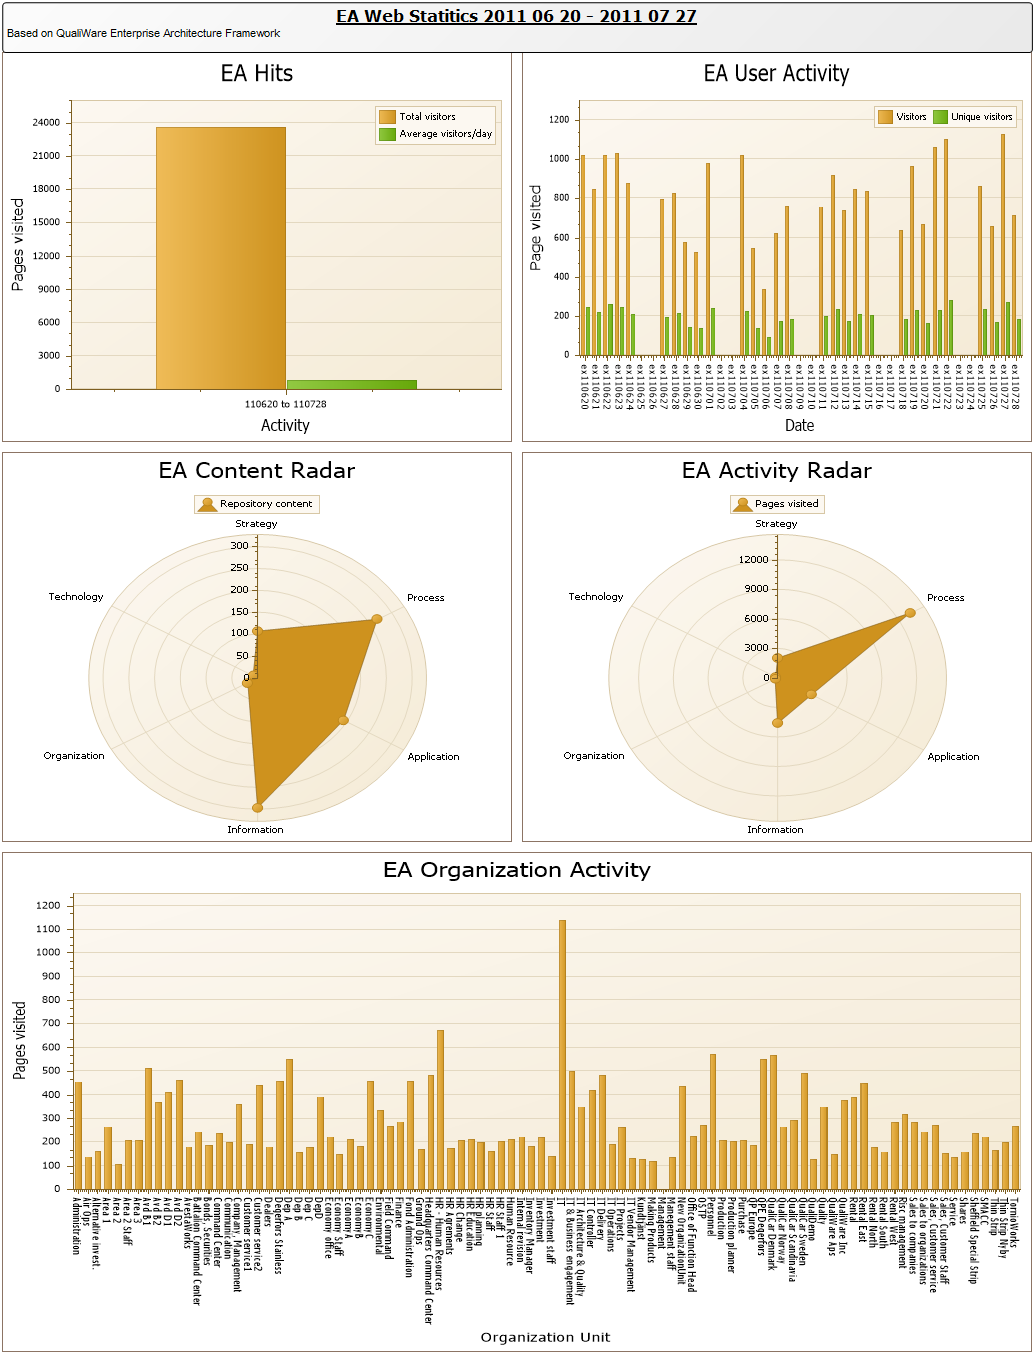
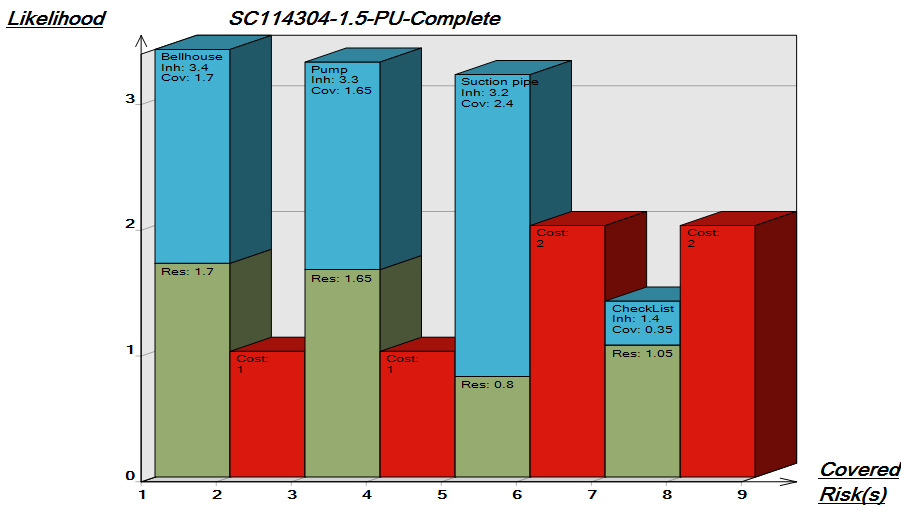
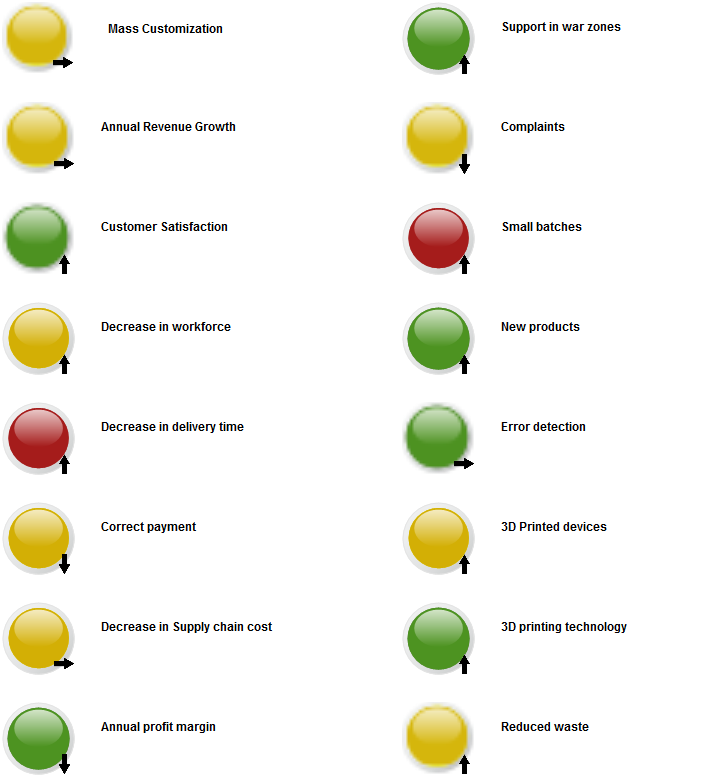
The overview of the Key Performance Indicators can also be presented with a simplistic view, highlighting their status using color coded icons:

Relation to other templates: The Performance Diagram is a Strategic template and can be decomposed from Key Performance indicators contained in, for example, a Balanced Scorecard Diagram or Dashboard.


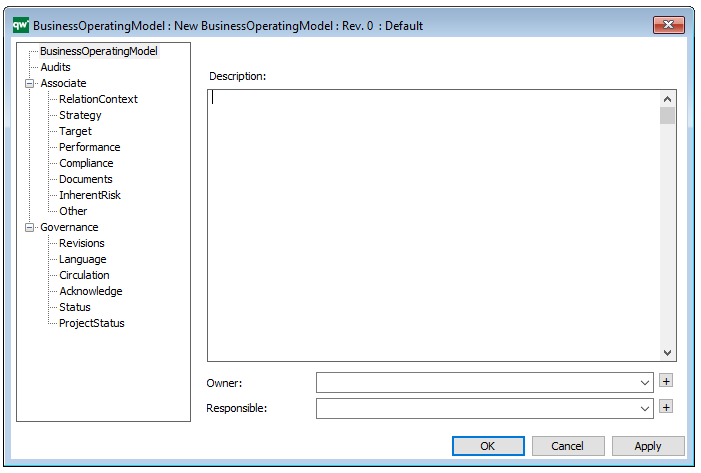
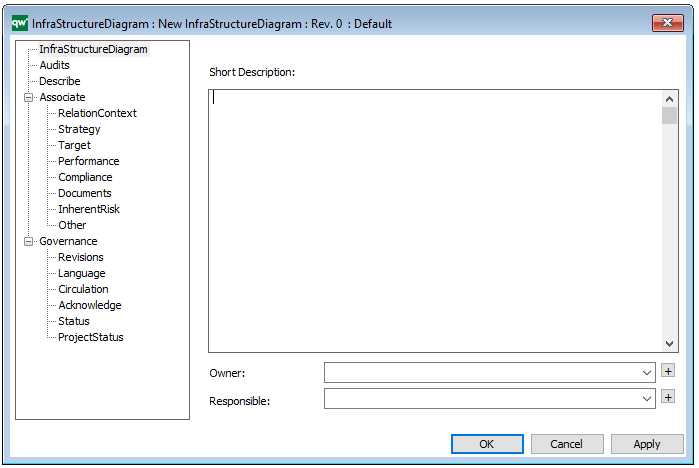
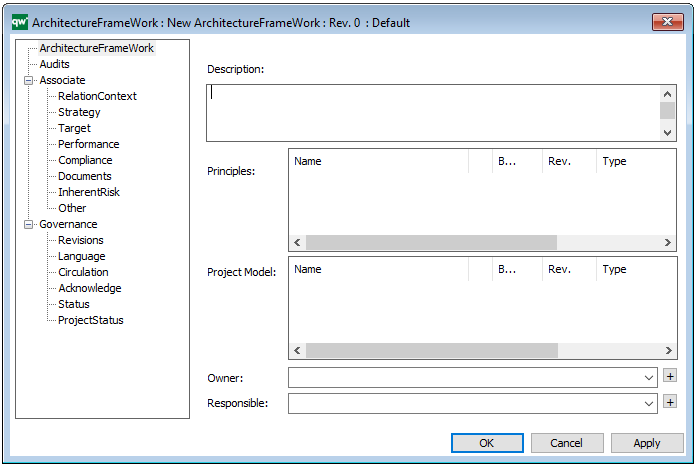
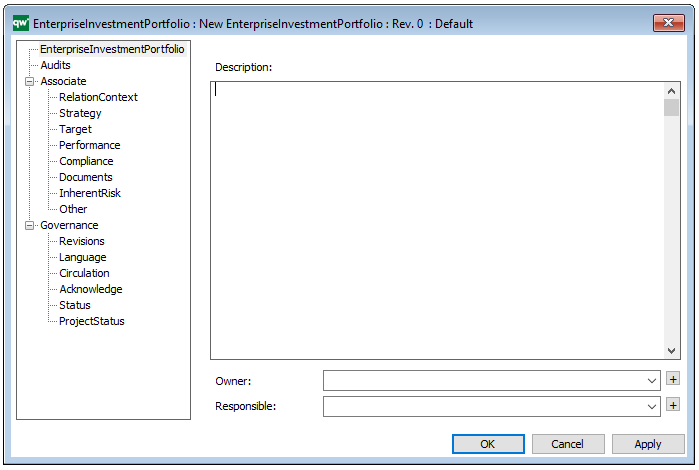
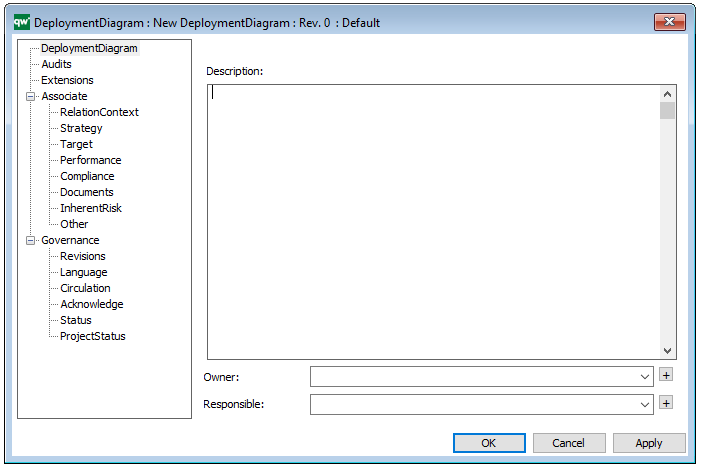
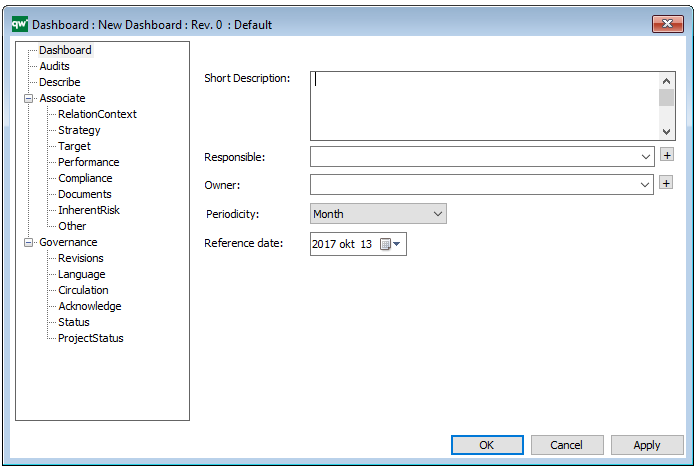
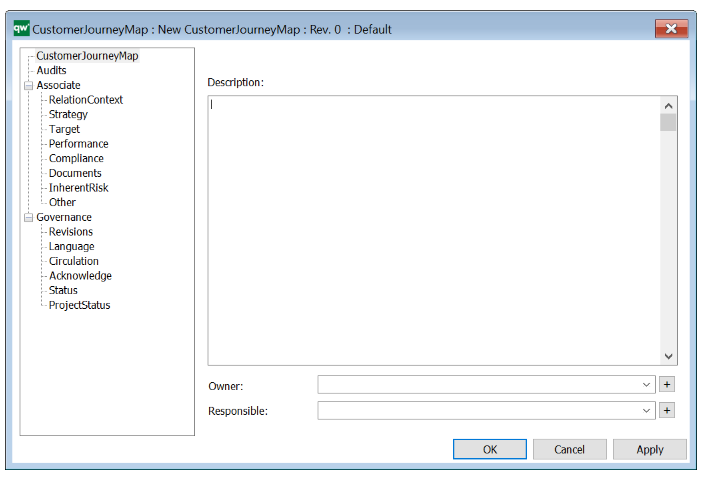
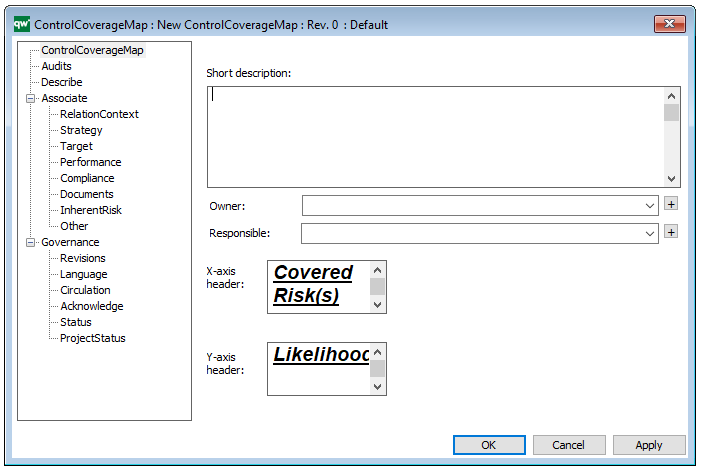
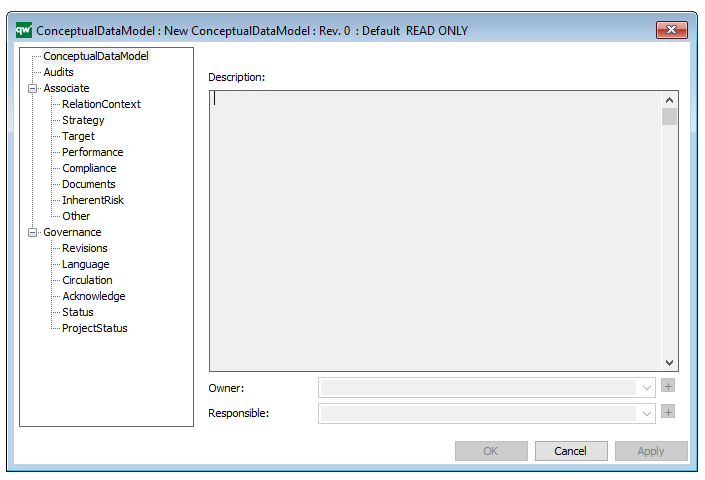
Properties and metadata: The Performance Diagram can for example retain the following information:

  • A description of the diagram
  • Link to the owner of the diagram
  • Link to the one responsible for the diagram
  • Audits (auto generated information regarding its current state and access rights)
  • Associated documents, diagrams and other objects
  • Inherent Risk detailing risk considerations
  • Governance information detailing information about the published diagram and who has been involved in the approval of the diagram

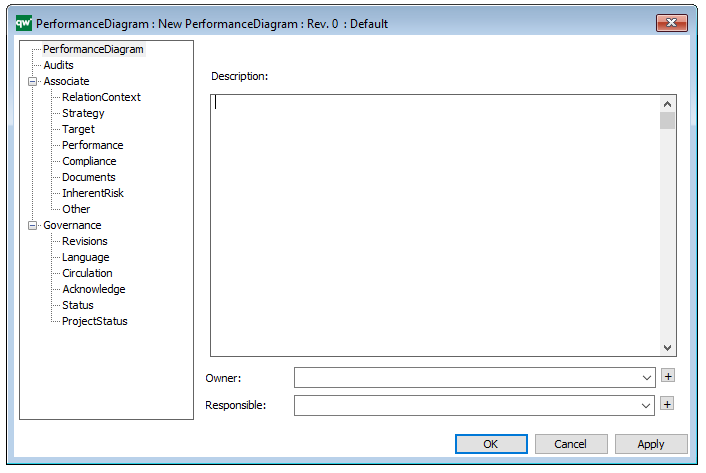
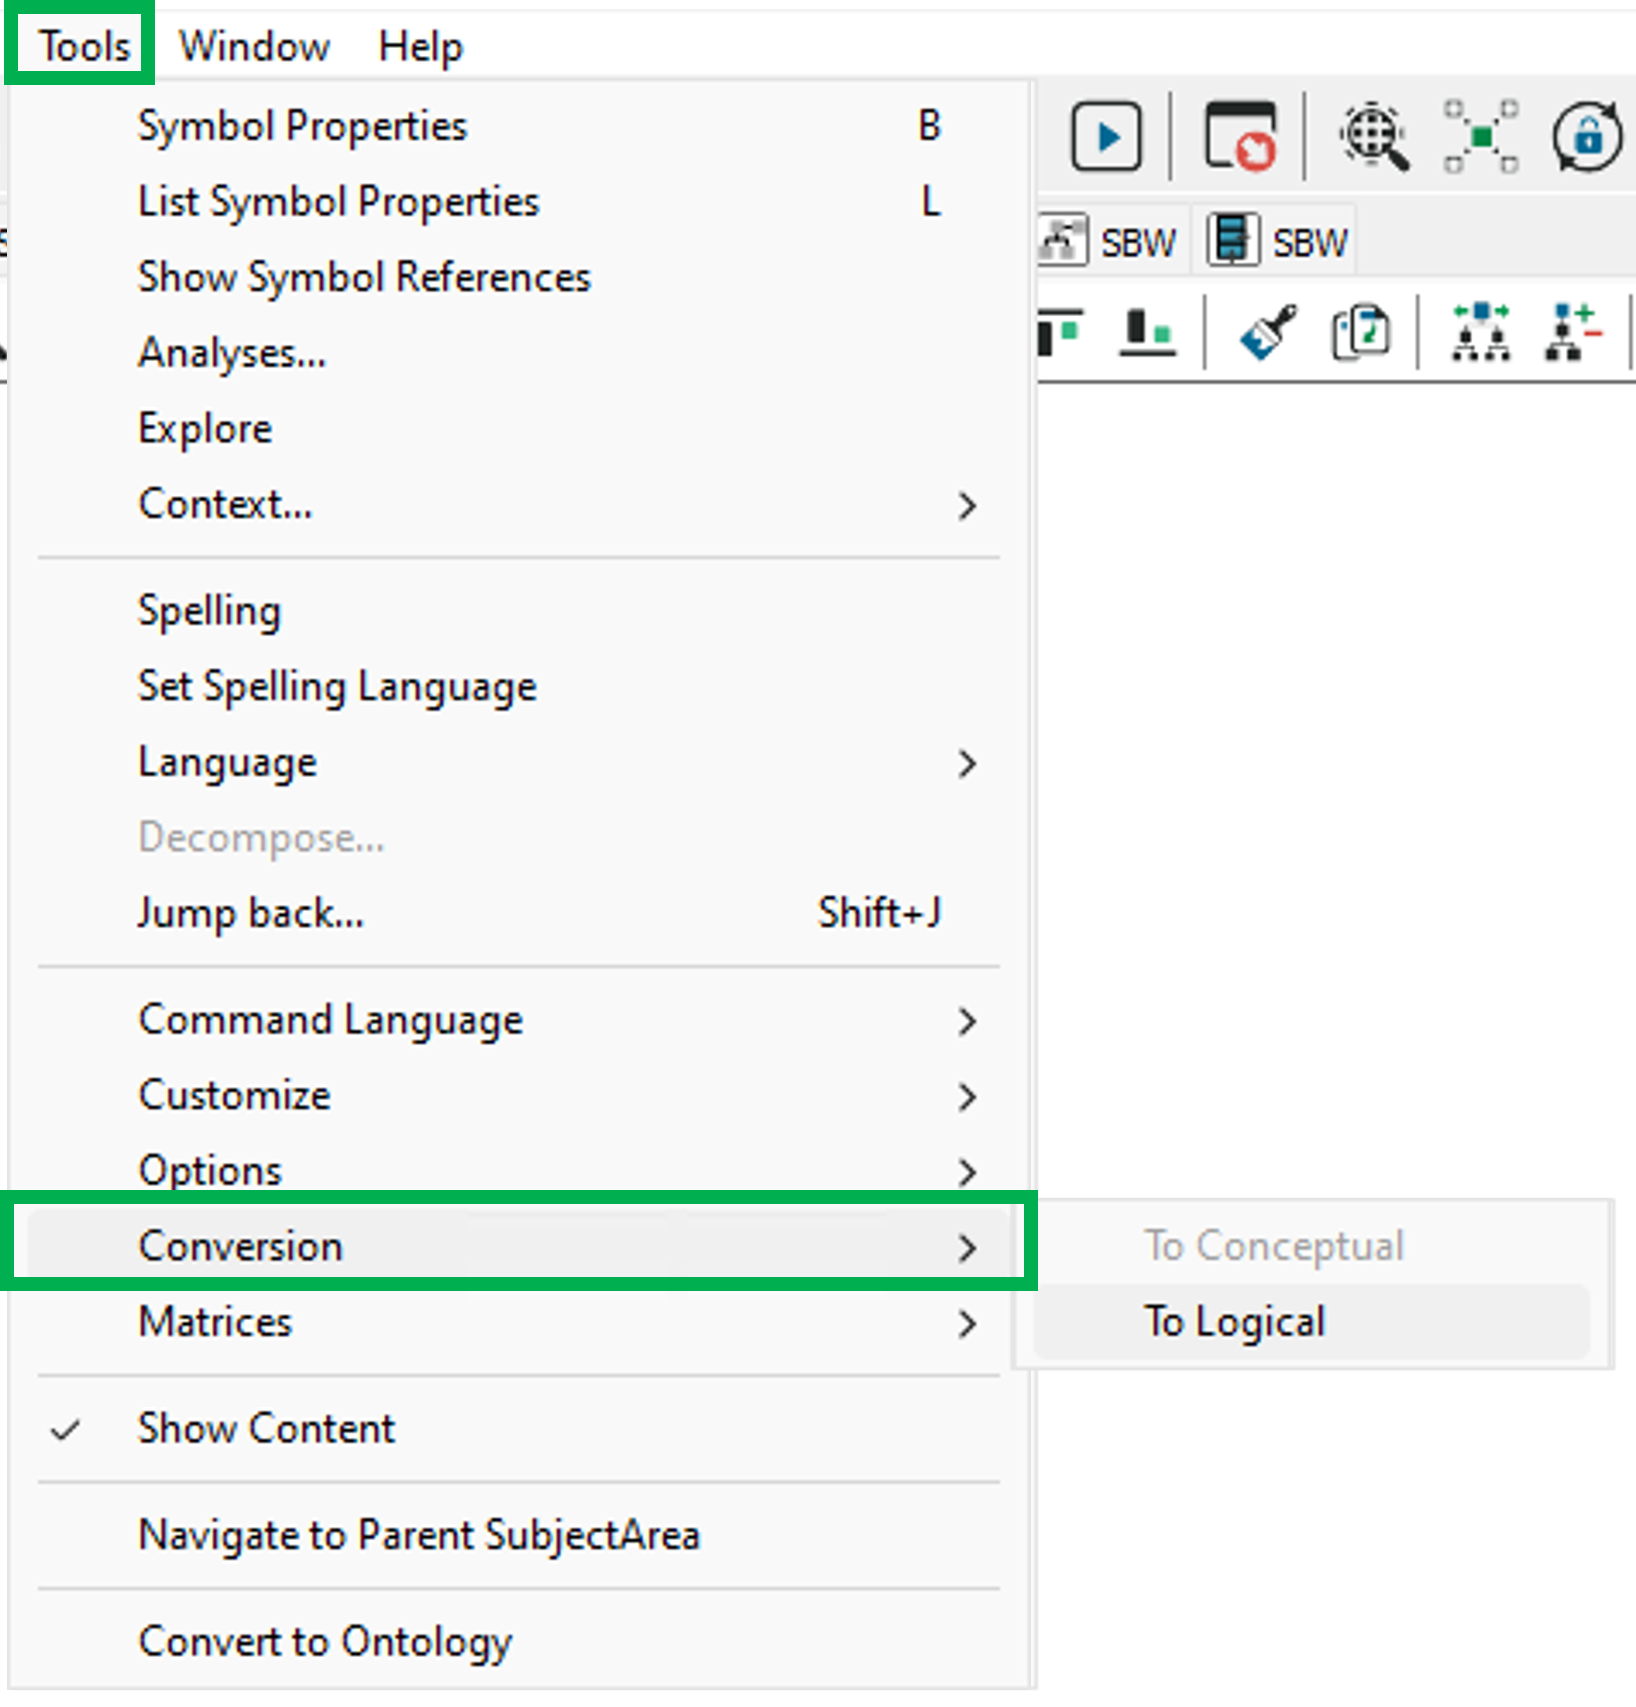
The above picture shows the properties dialogue window for the Performance Diagram where you can view and edit the diagram’s properties in QualiWare Lifecycle Manager.

Business Operating Model

Purpose: The purpose of the Business Operating Model is to visualize how an organization functions and delivers value to its customers. The model presents a ‘one-page-overview’ of the organization and offers a quick way to communicate an organization’s value structure to different types of stakeholders.

Core concerns: The Business Operating Model can be put together in numerous ways including information on Stakeholders, Business Processes, Products, Projects, Channels, Key Performance Indicators and more. This enables you to create a Business Operating Model that reflects your organization’s specific value chain in detail. Below is an example of a Business Operating Model that shows a business’s suppliers, high-level processes, products & services, channels and customer segments:

Relation to other templates: The Business Operating Model is a strategic model that can be supplied with more detailed models such as a Business Capability Model, Requirement Models, Stakeholder Models and the Business Ecosystem Model.

Properties and metadata: The Business Operating Model can for example retain the following information:

  • A description of the diagram
  • Link to the owner of the diagram
  • Link to the one responsible for the accuracy of the diagram
  • Audits (auto generated information regarding its current state and access rights)
  • Associated documents, diagrams and other objects
  • Inherent Risk detailing risk considerations
  • Governance information detailing information about the published diagram and who has been involved in the approval of the diagram
  • Project status: information about budgeted and actual man-hours spent, percentage completed and the latest milestone, result and quality control of a change process.

In the picture below you can see the Business Operating Model’s properties dialogue window, where the information can be viewed and edited:

Infrastructure Diagram

Purpose: The purpose of the Infrastructure Diagram template is to document the physical infrastructure of the enterprise, which includes but is not limited to databases, wires, firewalls, computers etc.

Core concerns: The Infrastructure Diagram enables you to model your organizations infrastructure including: Computer Categories, Computers, Firewalls, Printers, Networks, Connection Points, Peripherals, Locations, Information Systems, System Components, Databases, Network Connections, Object Dependencies, Technology Domains, Technology Capabilities and Technology Components.

The models below exemplify how you would construct this type of diagram:

InfraStructureDiagram_1

InfraStructureDiagram_2

Relation to other templates: The Infrastructure Diagram template should not be used to document logical architecture, as the connections available in an Infrastructure Diagram are predominately geared towards documenting physical information about IT infrastructure. The Infrastructure Diagram can through its components be linked to other architectural diagrams such as the Application Architecture Diagram, and the data they contain. This way, if a firewall is breached, you would be able to very quickly identify what data has been vulnerable.

Properties and metadata: The Infrastructure Diagram can for example retain the following information:

  • A description of the diagram
  • Link to the owner of the diagram
  • Link to the one responsible for the diagram
  • Audits (auto generated information regarding its current state and access rights)
  • Associated documents, diagrams and other objects
  • Inherent Risk detailing risk considerations
  • Governance information detailing information about the published diagram and who has been involved in the approval of the diagram


The above picture shows the properties dialogue window for the Infrastructure Diagram, where you can view and edit the diagram’s properties in QualiWare Lifecycle Manager.

Generic Query

Purpose: The Purpose of the Generic Query template is to provide datasets for QualiWare System templates.

Core concerns: The Generic Query template is an auxiliary template. The Generic Query can be created using a Query Design template which enables you to easily structure the query for creating reports. When creating a Report for a diagram, the Generic Query created using the Query Design should be used as a Data Set in the Report Definition.

A Generic Query can also be generated using its Property Dialog, where you can link to Data Source and filter the data selection using a wizard – see example of the property dialog below:

The Generic Query can, for example, take the form of data sheets:

GenericQuery_2

The Generic Query template can also execute a command using the Advanced Query tab:

Relation to other templates: Generic Queries are automatically created when creating a Query Design. Generic Queries are used in the following templates: HTML Template Definitions, HTML Embedded content, HTML Publisher and HTML Content tab.

Properties and Metadata: The Generic Query can for example rentain the following information:

  • A description
  • Audits (auto generated information regarding its current state and access rights)
  • Query Filter, including a wizard for filter options
  • Attribute Definition
  • Advanced Query
  • Matrix Behavior

The above picture shows the properties dialogue window for the Generic Query where you can view and edit the diagram’s properties in QualiWare Lifecycle Manager.


Enterprise Investment Portfolio

Purpose: The purpose of the Enterprise Investment Portfolio template is to model enterprise goals and investments.

Core concerns: The Enterprise Investment Portfolio template enables you to model Goals, Projects, and Initiatives. The projects and initiatives can be connected to enterprise goals them through Project Contributions, that show the viable minimum and optimistic maximum of the value contribution. Below, you can see an example of an Enterprise Investment Portfolio, where the way goals are realized is visualized:


EnterpriseInvestmentPortfolio_1

Other Functionalities: By using the Enterprise Investment Actions tab, you can create, for example, a Portfolio Value matrix, which offers another way to view the same data:

Relation to other templates: The Enterprise Investment Portfolio is a strategic template and is as such related to the enterprise’s Strategy Model, Strategic Roadmap, Business Canvas and Innovation Canvas. The projects contained in the initiatives can also be further described in the Work Model template.

Properties and metadata: The Enterprise Investment Portfolio template can for example retain the following information:

  • A description of the diagram
  • Link to the owner of the diagram
  • Link to the one responsible for the diagram
  • Audits (auto generated information regarding its current state and access rights)
  • Associated documents, diagrams and other objects
  • Inherent Risk detailing risk considerations
  • Governance information detailing information about the published diagram and who has been involved in the approval of the diagram

The above picture shows the properties dialogue window for the Enterprise Investment Portfolio template, where you can view and edit the diagram’s Properties in QualiWare Lifecycle Manager.

For more information: This model type is used in the Enterprise Investment Methodology developed by Chris Potts and QualiWare. To learn more about Enterprise Investment, you can about it here:Enterprise Investment.

Deployment Diagram

Purpose: The purpose of the Deployment Diagram is to document the configuration of run-time processing nodes and the components they contain.

Core concerns: The Deployment Diagram template is structural UML diagram that enables you to model Packages, Components, Artifacts, Instance Specifications, Properties, Nodes, Devices, Execution Environments, Deployment Specifications, Objects, Classes, Interfaces, and Annotations. They can then be connected through Association, Dependency, Generalization, Deployment or Manifestation.

The Deployment Diagram models how the different hardware component and software components are connected. Below you can see an example of a Deployment Diagram for a booking service:

DeploymentDiagram_1

In the next example, you can see how Packages and Components would be included in a Deployment Diagram:

DeploymentDiagram_2

Relation to other templates: The Deployment Diagram is, as a component model, part of the application domain on the operational level. As such, it offers a complimentary view to those of the Application Architecture Diagram, Class Diagram, Component Diagram, Data Flow Diagram, Data Mapping Diagram, Data Replication Diagram, Sequence Diagram, State Event Diagram, Structure Chart, and Use Case Diagram.

Properties and metadata: The Deployment Diagram can for example retain the following information:

  • A description of the diagram
  • Link to the owner of the diagram
  • Link to the one responsible for the diagram
  • Links to extensions such as Stereotypes and Constraints
  • Audits (auto generated information regarding its current state and access rights)
  • Associated documents, diagrams and other objects
  • Inherent Risk detailing risk considerations
  • Governance information detailing information about the published diagram and who has been involved in the approval of the diagram

The above picture shows the properties dialogue window for the Deployment Diagram where you can view and edit the diagram’s properties in QualiWare Lifecycle Manager.


Dashboard

Purpose: The purpose of the Dashboard template is to publish selections of Business Charts targeting different stakeholders. It should be used to gather a series of relevant or connected Business Charts to provide a dashboard-like overview.

Core concerns: The Dashboard template enables you to gather Business Charts, Key Performance Indicators, Performance Indicators and General Concepts to create stakeholder specific views of analyzed data. For example, an Enterprise Architect could find a Dashboard containing Business Charts relevant to the usage and governance of the Enterprise Architecture useful.

Below, you can see examples of different Dashboards presenting an array of Business Charts:

Dashboard_1


Dashboard_2

Relation to other templates: The Dashboard template is closely connected to the Business Chart template, as the Dashboard publishes the charts the Business Chart template generates.

Properties and metadata: The Dashboard can for example retain the following information:

  • A description of the Dashboard
  • Link to the owner of the Dashboard
  • Link to the one responsible for the Dashboard
  • Audits (auto generated information regarding its current state and access rights)
  • Associated documents, diagrams and other objects
  • Inherent Risk detailing risk considerations
  • Governance information detailing information about the published diagram and who has been involved in the approval of the diagram

The above picture shows the properties dialogue window for the Dashboard template where you can view and edit the dashboard’s properties in QualiWare Lifecycle Manager.

Customer Journey Map

Purpose: The Purpose of the Customer Journey Map template is to document the customer’s journey from awareness to the end of their interaction with an organization, covering possible touch points from the customer’s perspective.

Core Concerns: The Customer Journey Map template allows you to model connections between different Personas, Customer Journey Phases, Touch Points, Goals, Roles, Locations, Channels, Technology and the aspects from a SWOT analysis.

You can choose to model both a current state and a desired future state of the customer journey and use the documentation for process improvement. Below is an example of a current state model and a future state model:

Current state model:

CustomerJourneyMap_2

Desired future model:

CustomerJourneyMap_1

Other functionalities: The customer’s touchpoints can be elaborated upon with four scores for Customer Satisfaction, Customer Importance, Customer Effort and Net Promoter Score. Particularly vital touchpoints can be designated as a Moment of Truth.

Relation to other templates: The Customer Journey Map can be used as a groundwork for a strategic change, which for example can be modelled in a Work Model, a Business Capability Model and/or a Strategy Model.

Properties and metadata: The Customer Journey Map can for example retain the following information:

  • A description of the diagram
  • Link to the owner of the diagram
  • Link to the one responsible for the accuracy of the diagram
  • Audits (auto generated information regarding its current state and access rights)
  • Associated documents, diagrams and other objects
  • Inherent Risk detailing risk considerations
  • Governance information detailing information about the published diagram and who has been involved in the approval of the diagram
  • Project status: information about budgeted and actual man-hours spent, percentage completed and the latest milestone, result and quality control of a change process.

The above picture shows the properties dialogue window for the Customer Journey Map, where you can view and edit the diagram’s properties.

For more information: on Customer Journey Mapping, please view our webinar Experience Mapping – Customer Obsession for IT and Digital Professionals with Milan Guenther and Katharina Weber.


Control Coverage Map

Purpose: The purpose of the Control Coverage Map is to provide an overview of uncovered risks, residual risks and potential cost of the risk occurring.

Core concerns: The Control Coverage Map concerns itself with Financial Risk Management and is created using the Actions tabs in QLM. It can be created based on the information in a Risk Heatmap or by using information from a diagram which contains risks that also have control actions.

Below, you can see an example of a Control Coverage map for four risks related to a Bellhouse, a Pump, a Suction pipe and using Check lists:

ControlCoverageMap

The Blue column represents the likelihood of the risk before the control action, the green column represents the likelihood of the risk after the implementation of a control action. The red columns represent the estimated cost if the risk is realized.

Relation to other templates: The Control Coverage Map presents graphical views of information from other diagrams the same as the Heatmap, Business Charts and the Graphical Matrix. It can be used by any diagram containing Activities with attached risks that have control activities.

Properties and metadata: The Control Coverage Map ­­­­can for example retain the following information:

  • A description
  • Link to the owner
  • Link to the one responsible
  • Graphical specification for the headers of the X-axis and Y-axis
  • Audits (auto generated information regarding its current state and access rights)
  • Associated documents, diagrams and other objects
  • Inherent Risk detailing risk considerations
  • Governance information detailing information about the published diagram and who has been involved in the approval of the Control Coverage Map

The above picture shows the properties dialogue window for the Control Coverage Map template where you can view and edit the template’s properties in QualiWare Lifecycle Manager.

Conceptual Data Model

Purpose: The Conceptual Data Model template is used to describe a high-level business oriented structure of the information concept used in a specific business area. Below yo can se an example of a Conceptual Data Model where the data is divided into data for internal and external use:

ConceptualDataModel_2

Core concerns: The conceptual data model template enables you to model a preliminary high level data model. It may be abstract in content and sparse in attributes. Its preliminary structure allows for many-to-many relationships. When using the Conceptual Data Model, you can model Information Concepts, Subject Areas, and their interrelationships. Below, you can see a car rental service’s Conceptual Data Model for a customer’s data.

ConceptualDataModel_1

Relation to other templates: The conceptual data model is a means of communicating information structures between participants in a project or documenting the overall Information Concept of a specific organization. For a more detailed model you should use a Data Model Diagram.

Properties and metadata: The Conceptual Data Model can for example retain the following metadata:

  • A description of the diagram
  • Link to the owner of the diagram
  • Link to the one responsible for the accuracy of the diagram
  • Audits (auto generated information regarding its current state and access rights)
  • Associated documents, diagrams and other objects
  • Inherent Risk detailing risk considerations
  • Governance information detailing information about the published diagram and who has been involved in the approval of the diagram
  • Project status: information about budgeted and actual man-hours spent, percentage completed and the latest milestone, result and quality control of a change process.

In the picture below you can see the Conceptual Data Model’s properties dialogue window, where the information can be viewed and edited: