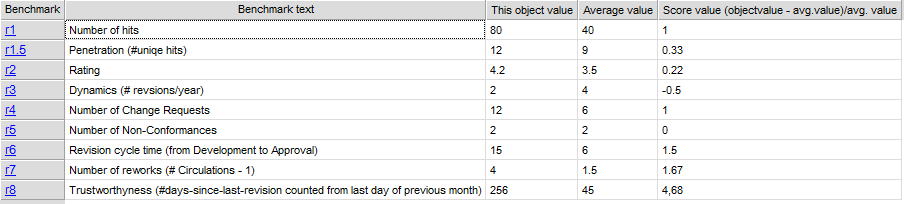
Purpose: The purpose of the Hierarchy View template is to show the hierarchy of objects related to a chosen root object.
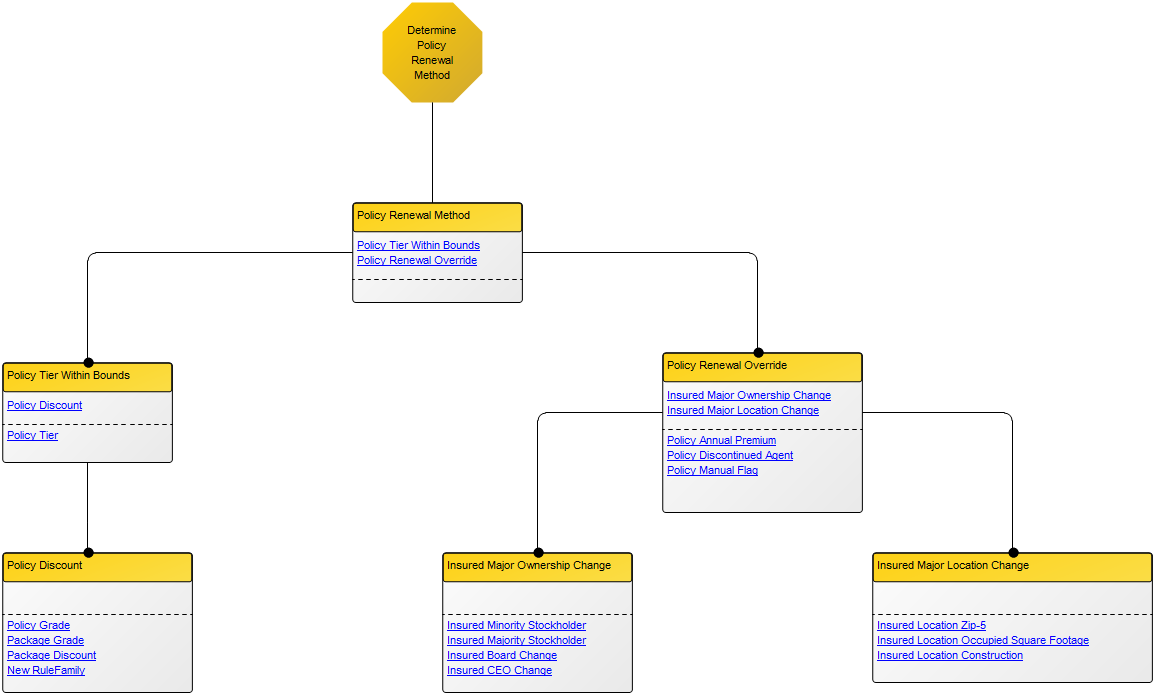
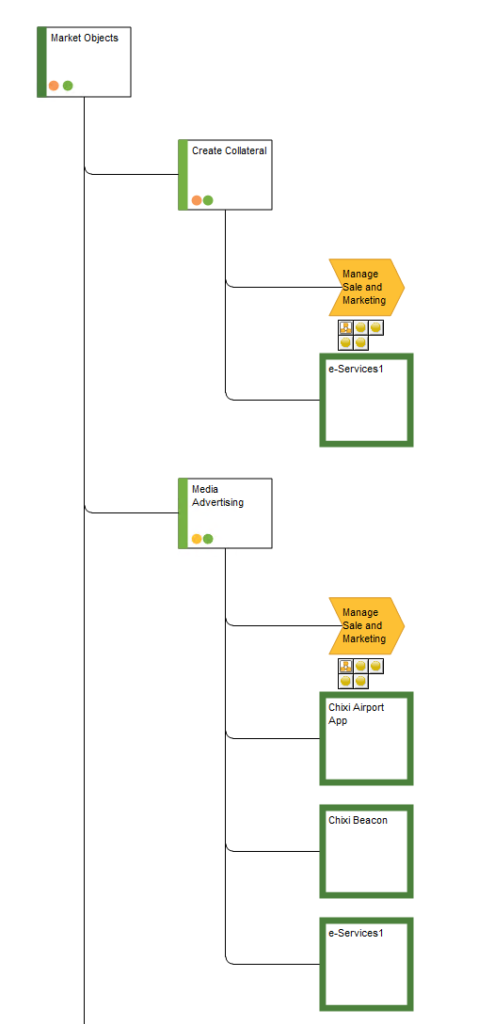
Core concerns: The root object in the hierarchy View can for example be a Capability or a Business Process. The view is not modeled as a diagram, but generated based on information specified in the template’s property dialog, making the scope of the view flexible. Below, you can see an examples of a Hierarchy View for the Capability “Market Objects”:
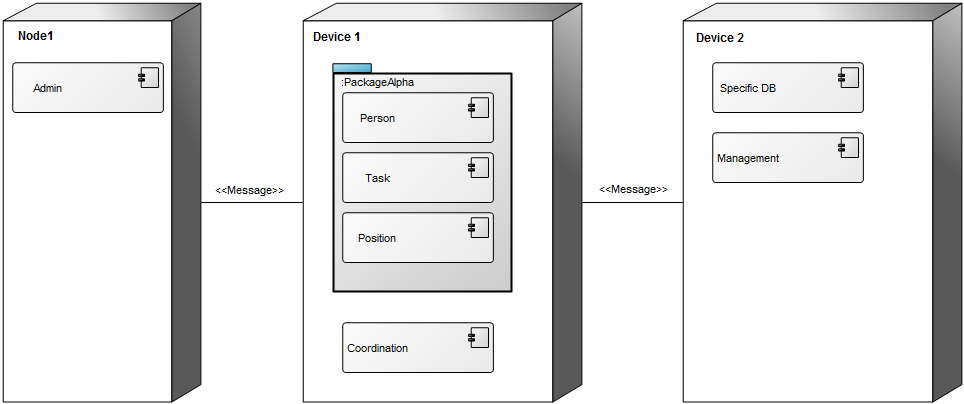
Relation to other templates: The Hierarchy View is not directly connected to any single template but is not unlike a Context View. The Hierarchy View is, compared to a Context View, usually filtered to only show certain types of relations amongst certain types of objects and not as a default connected to diagram templates:
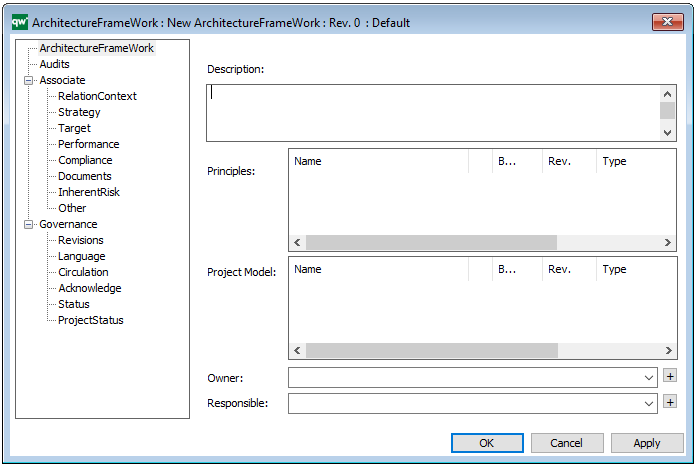
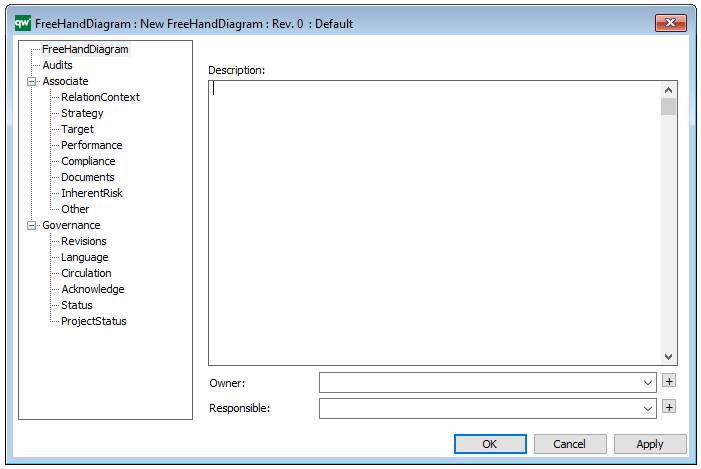
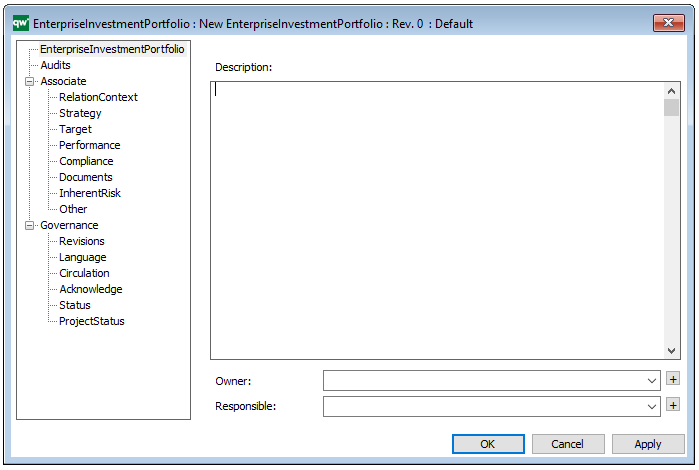
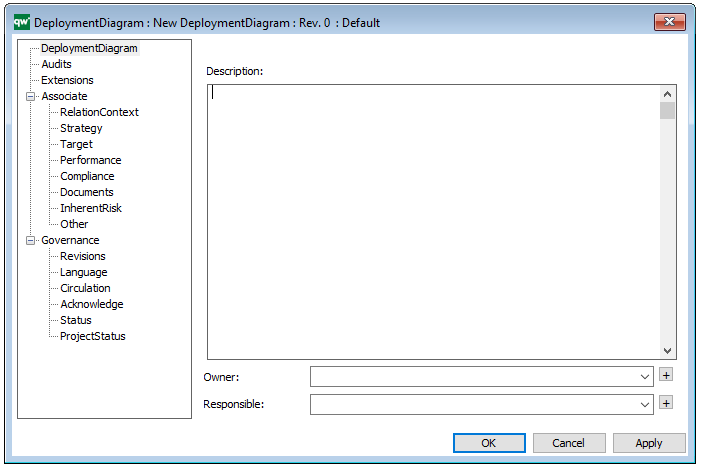
Properties and metadata: The Hierarchy View template can for example retain the following information:
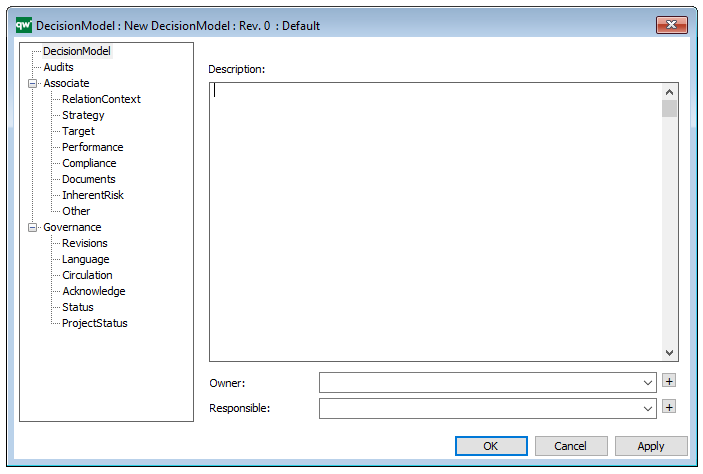
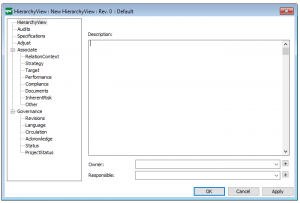
- A description of the diagram
- Link to the owner of the Hierarchy View
- Link to the one responsible for the Hierarchy View
- Audits (auto generated information regarding its current state and access rights)
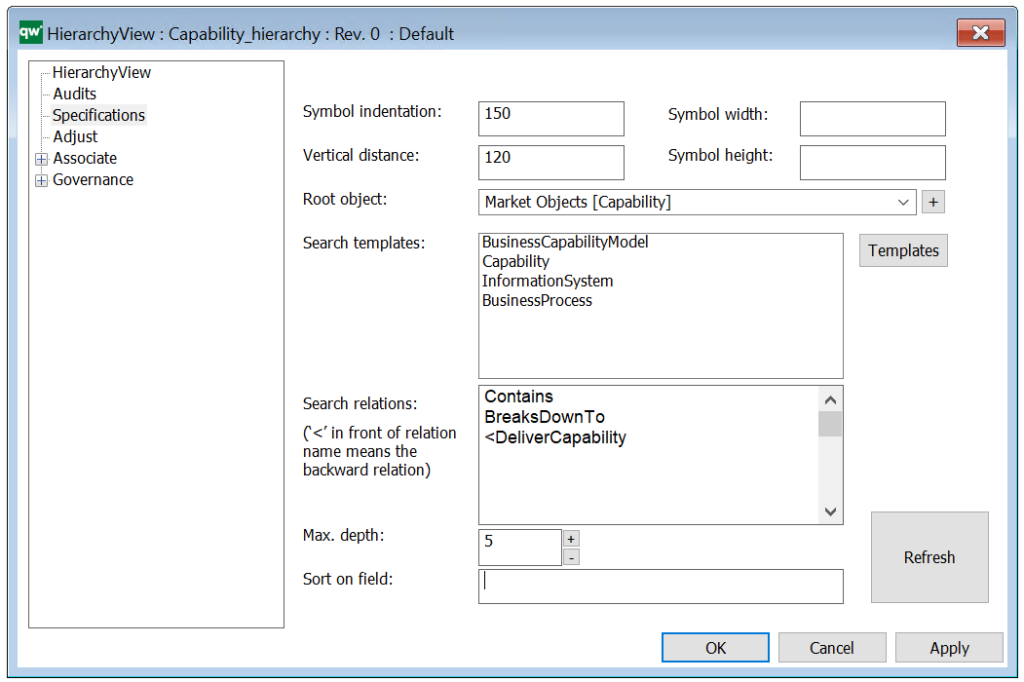
- Specifications (definition of root object and other inclusion criteria)
- Adjust (specification of templates that should be removed from the view)
- Associated documents, diagrams and other objects
- Inherent Risk detailing risk considerations
- Governance information detailing information about the published diagram and who has been involved in the approval of the diagram
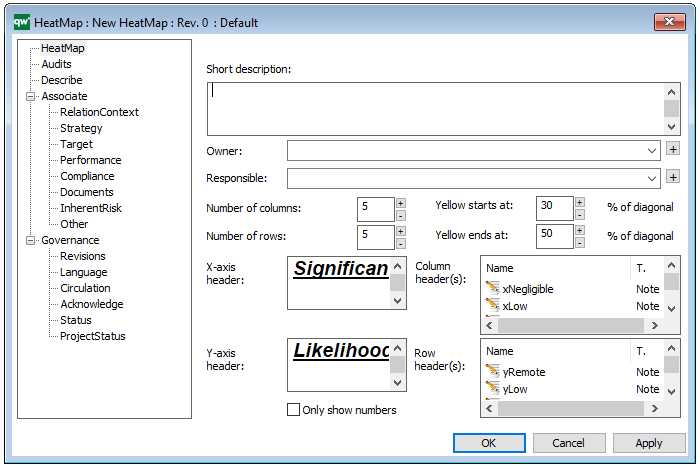
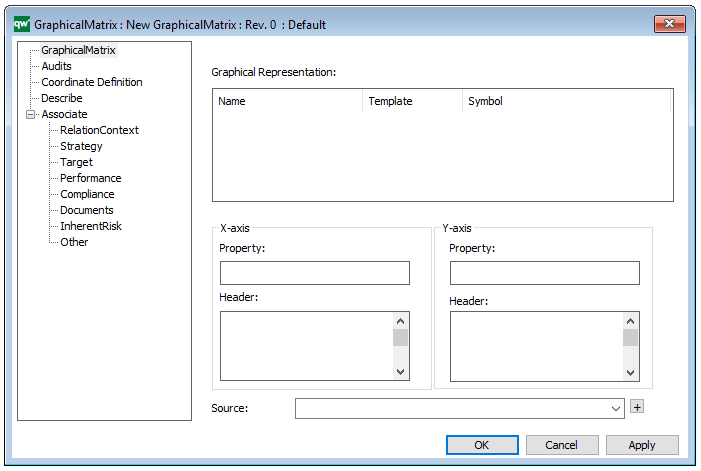
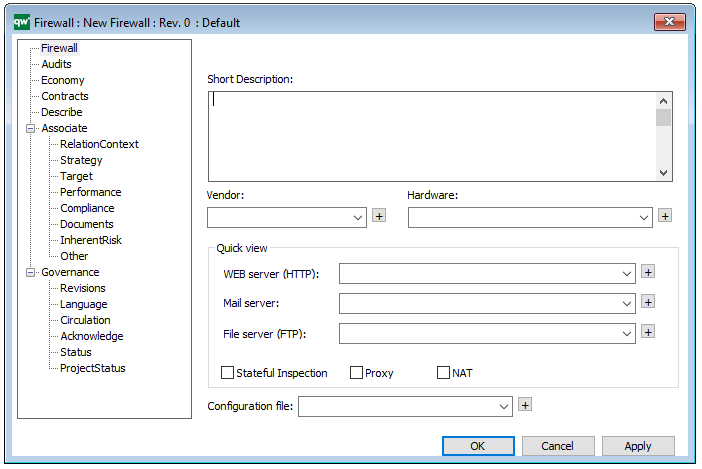
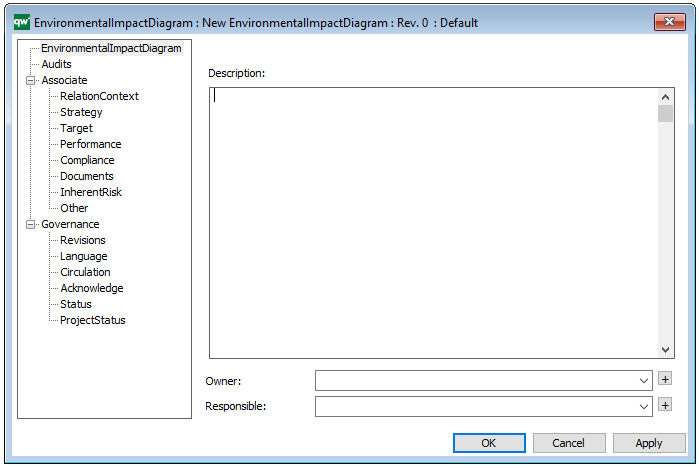
The above picture shows the properties dialogue window for the Hierarchy View template where you can view and edit the diagram’s properties in QualiWare Lifecycle Manager.
The HierachyView can be used in relation to the Standard Tree View in the HTMLPublisher, to establish a hierarchy for the network of process models in a repository.