Purpose: The purpose of the Product Roadmap is to visualize the lifecycles of the projects, within a specific scope and timeframe, in your product portfolio.
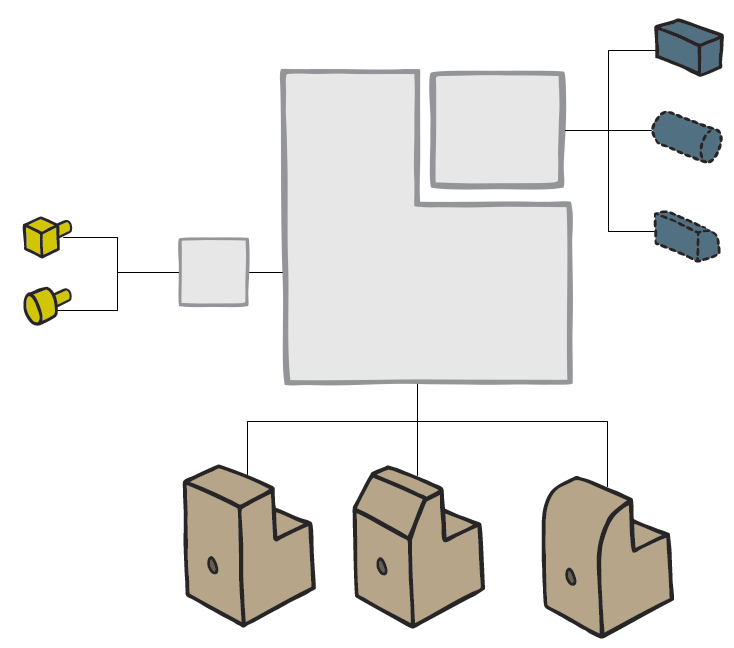
Core concerns: The Product Roadmap template enables you to model Products, Markets, Projects and Personae within a Timeframe. Additionally, you can add objects representing Equipment and Work Centers. This allows you to map the lifecycle of product releases within different markets for different customer segments.
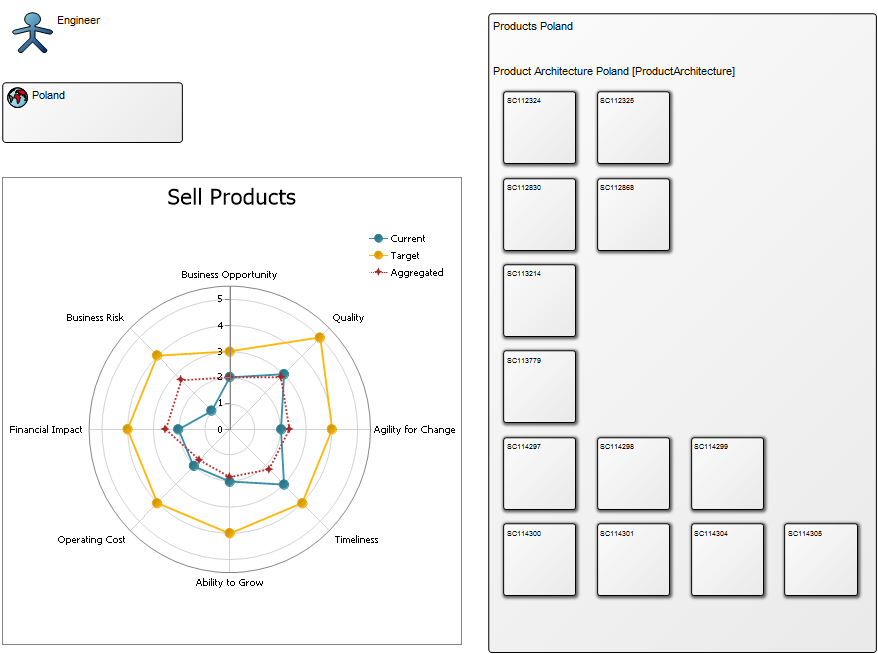
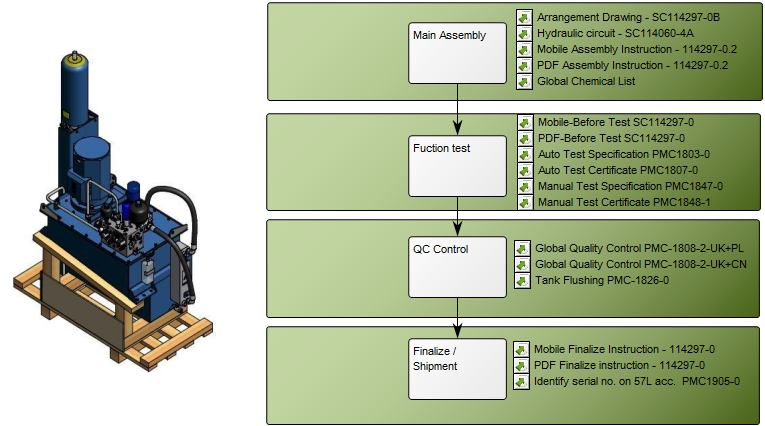
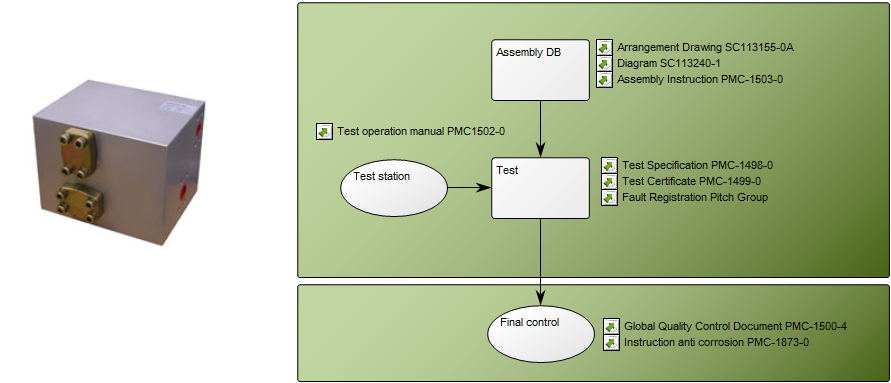
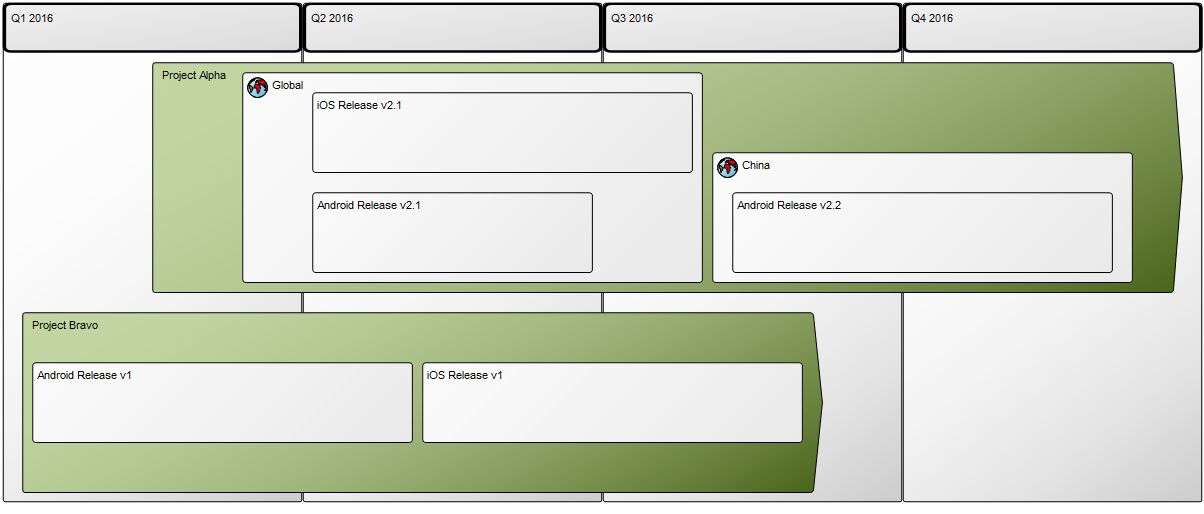
Below, you can see two examples of Product Roadmaps. The first showing the timeframe and markets for the release of different apps with multiple versions:
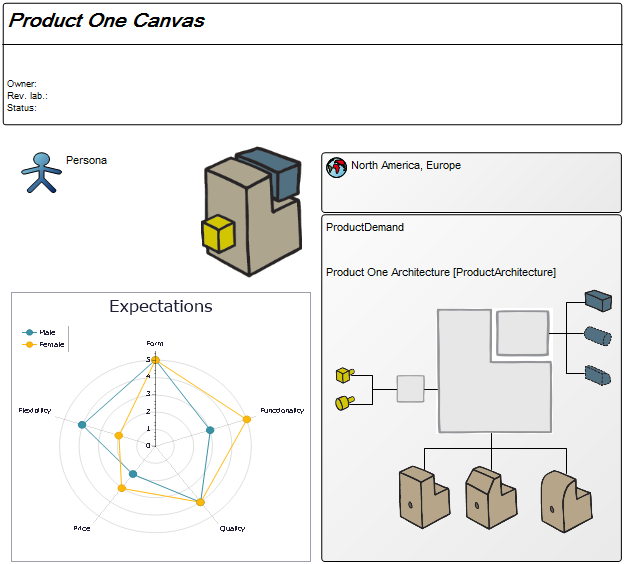
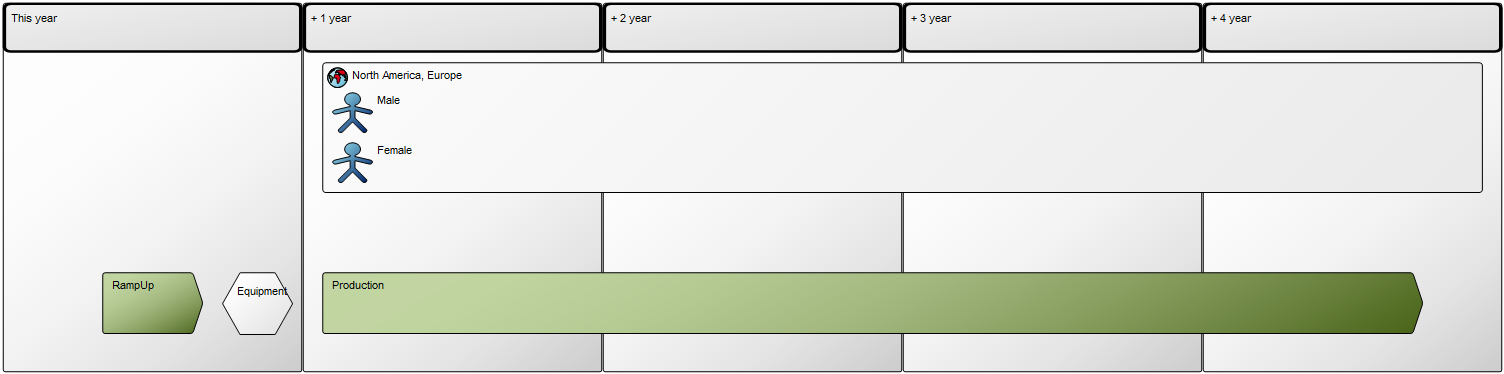
The second figure spans over several years to provide a high-level view of a products expected lifecycle spanning over several projects. It also illustrates how you can model markets with multiple customer segments, in this case based on gender:
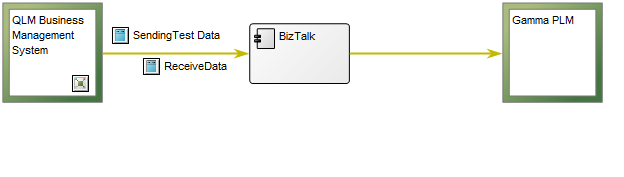
Relation to other templates: The Product Roadmap Template is inherently related to the Product Architecture, Product Canvas and Product Variant Master, in the sense that all these models focus on different aspects of the lifecycle of a product. Another view on projects and initiatives are provided from the Enterprise Investment Portfolio. There, the reasoning behind the investment in the project is visualized by connecting the initiative (in this case a new product) to the specific goals of the enterprise that it contributes to.
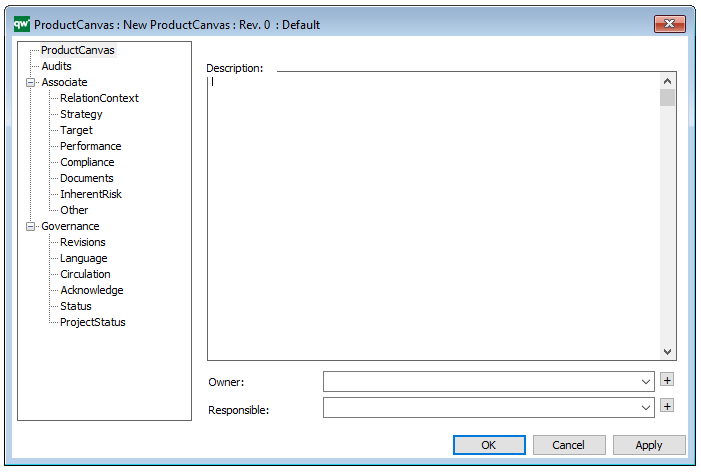
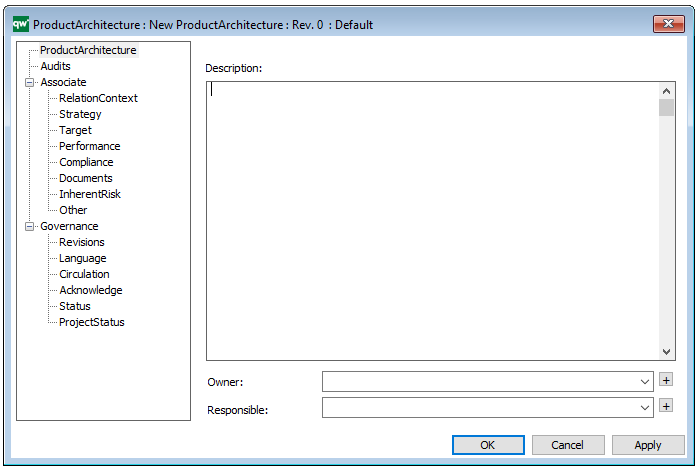
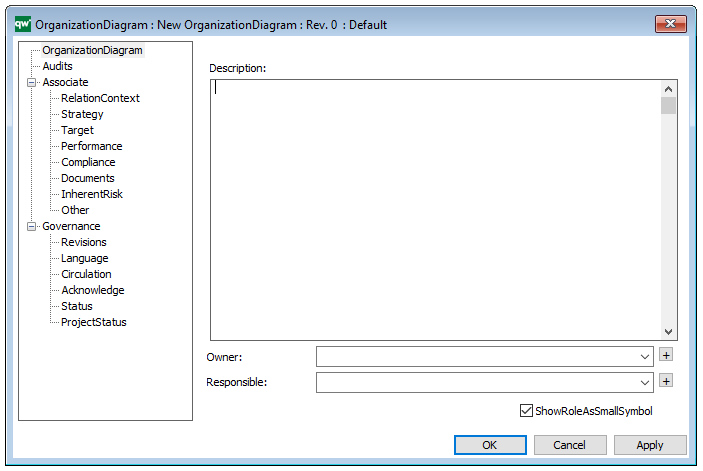
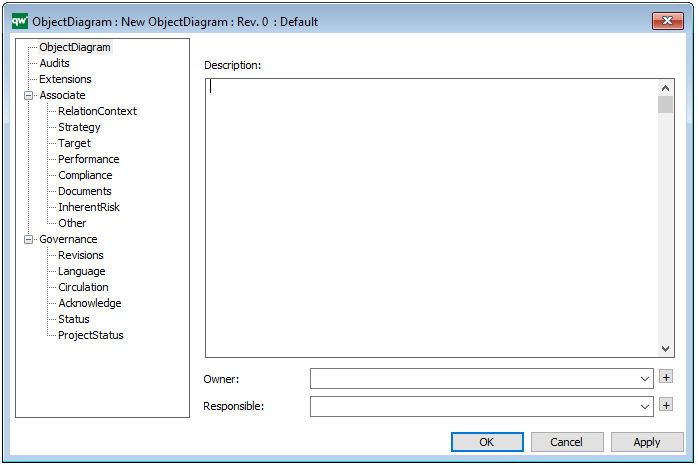
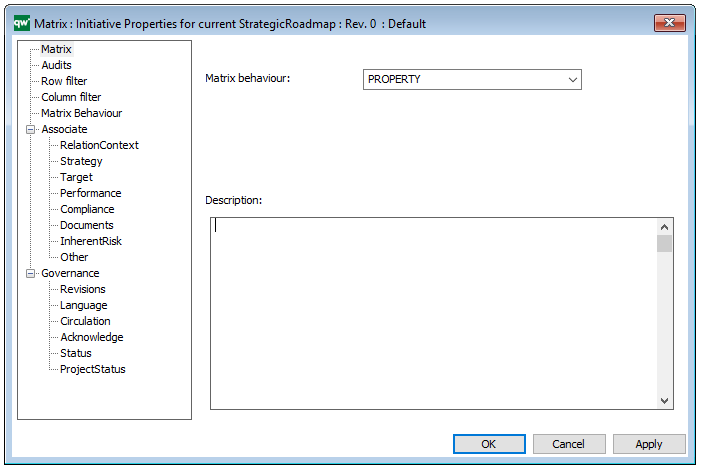
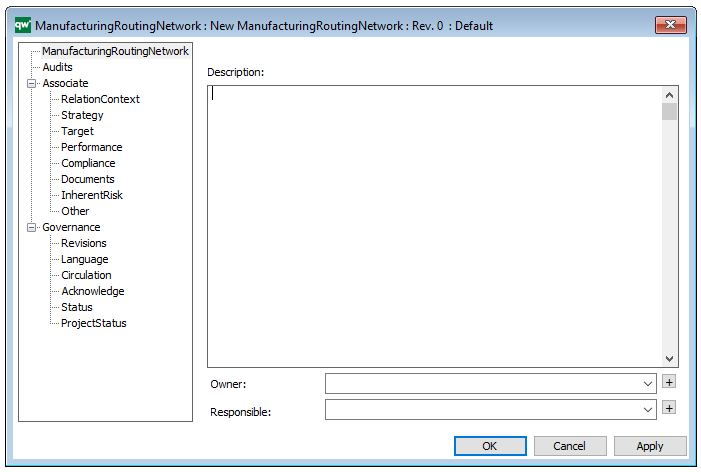
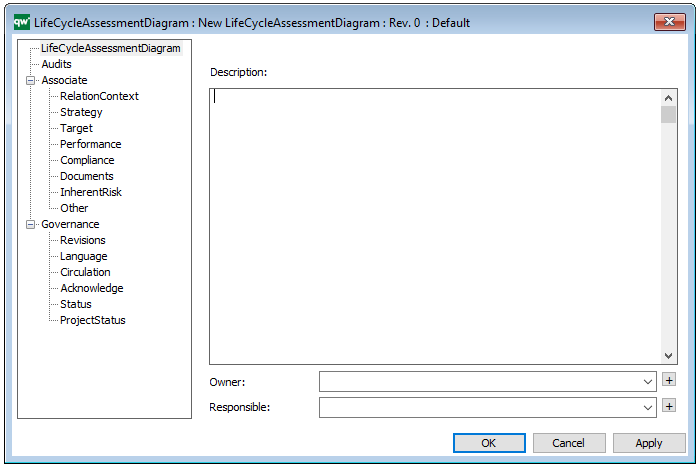
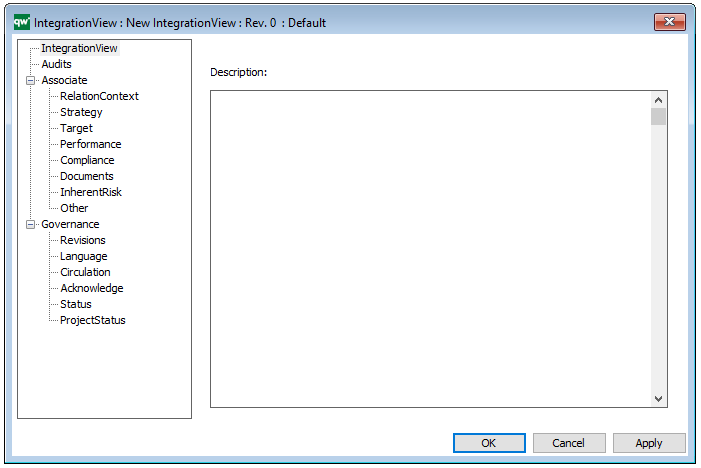
Properties and metadata: The Product Roadmap can for example retain the following information:
- A description of the diagram
- Link to the owner of the model
- Link to the one responsible for the model
- Audits (auto generated information regarding its current state and access rights)
- Associated documents, diagrams and other objects
- Inherent Risk detailing risk considerations
- Governance information detailing information about the published diagram and who has been involved in the approval of the diagram

The above picture shows the properties dialogue window for the Product Roadmap where you can view and edit the diagram’s properties in QualiWare Lifecycle Manager.