Summary
QualiWare 10.8 introduces a new Dashboard layout with multiple new features:
- it is possible to set up multiple layouts for a diagram type, e.g. browsing view for the content user; and an analyzing and improving view for the content owner
- the dashboards can be customized by the user
- the content is responsive, showing associated data either for the diagram as a whole or for the selected object
- a set of new tiles have been added to provide easy access to associated features, well-known as well as cool new features
Multiple Layouts

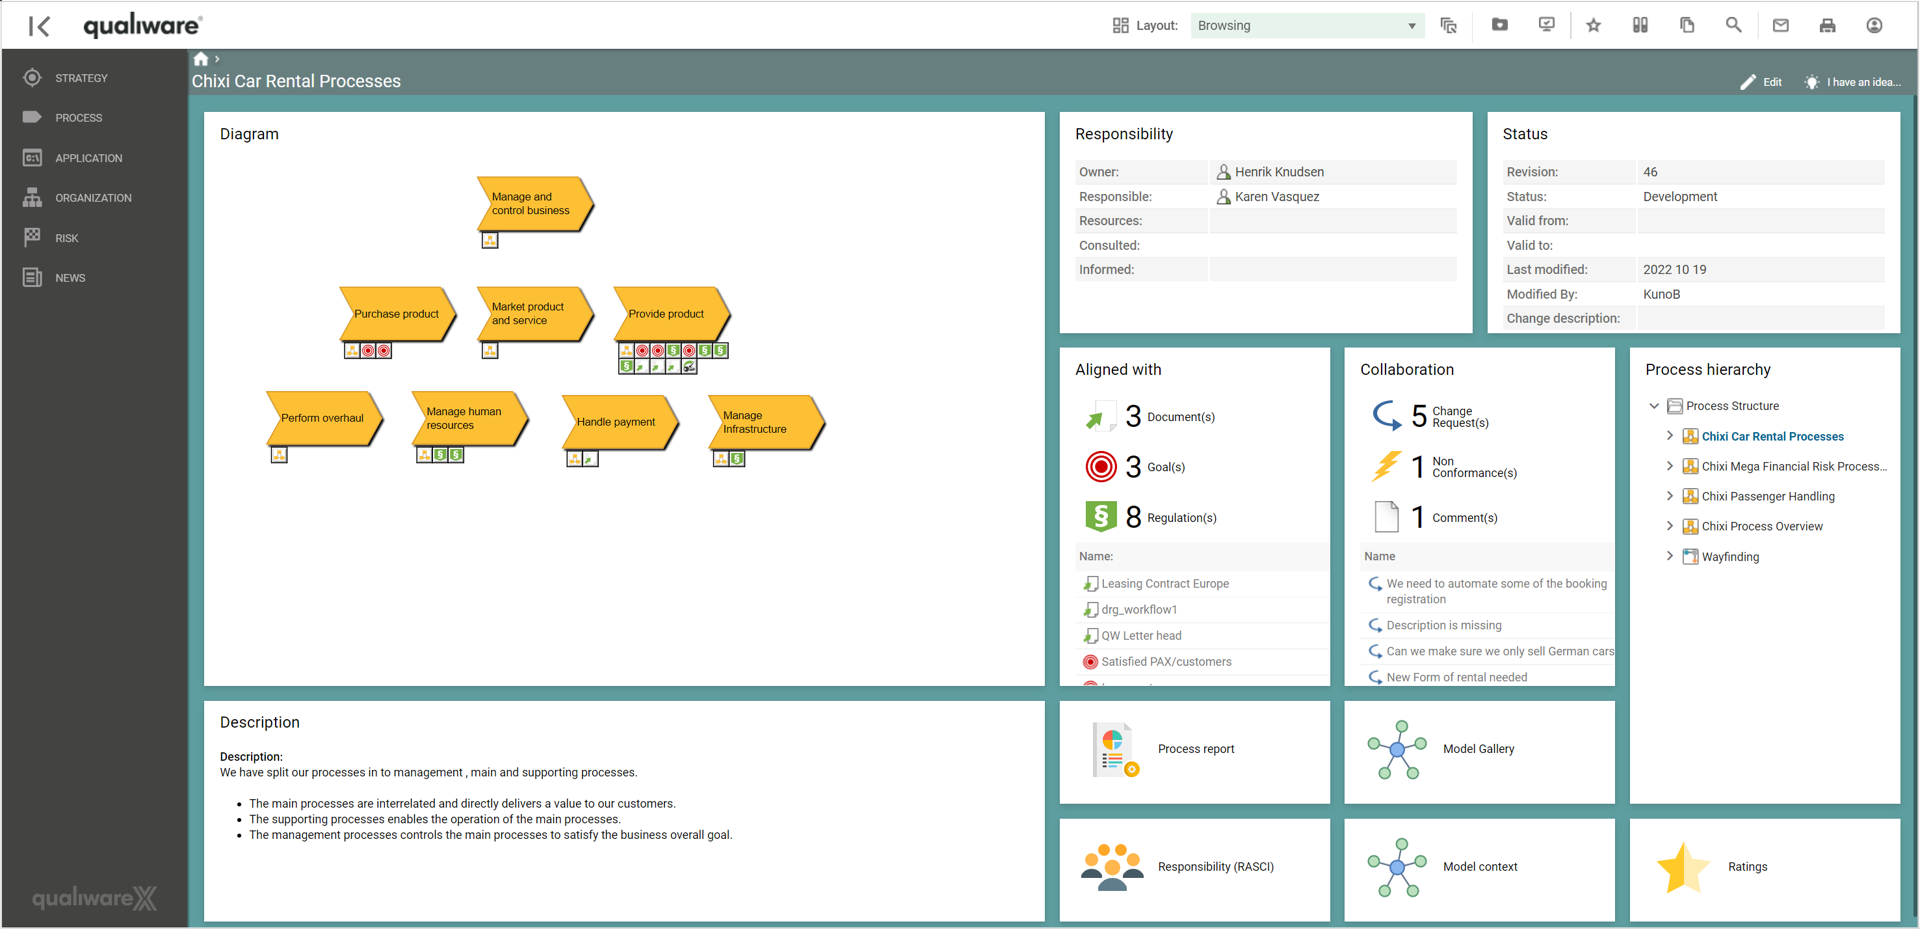
It is possible to create multiple Dashboard views for a template. Each dashboard can have a different focus e.g. “Browsing” or “Analyze and improve”.
All dashboards can be configured for different users and can be role-specific.
The user can select between the available layouts in the layout menu. The “Classic” view is the classic tabular view.


End-user Customizable

The dashboards can be customized by the user.
All the dashboarditems can be re-sized and re-organized by drag and drop, and it is possible to hide tiles/items.
A user can save/remove the “Personal layout”, and at any time the standard layout can be reloaded.
Once a “Personal layout” is created it will be shown as default for the diagram, and the user can “Load Standard Layout” if needed.

Responsive
A sub-set of the tiles on the new dashboards is responsive. The content changes depending on the symbol selected.
As default, the content and properties of the diagram are shown in the dashboard tiles.

- When a symbol is selected, it gets highlighted by a read box and the following fields are updated:
a) In the top left, the name of the object is shown along with the template type
b) Responsibility
c) Status
d) Description
e) Aligned with
In the “Aligned with” and “Collaboration” tiles, you can click on a specific icon for a specific type, e.g. Document(s) to focus on that particular subset.
The tiles can be expanded to get a full-page view of the tile, with a searchable list with additional information.

Easy access to new as well as existing features
From the standard dashboards there is easy access to a set of features.
Edit (Spreadsheet)

From the edit tile, there is access to editable spreadsheets, where the content owner can easily update/enrich the objects and their relations to other objects.
Highlight if

A new “Highlight if” feature highlights the symbols that meet the selected conditions.
Analyses…

From the analyses.. tile , there is access to a set of new queries:
- Process Digitalization, lists information, processes and the information, application and functionality usage related to the objects on the diagram
- Business Process Completion, shows the “completeness level” for the diagram, and the processes. This is a calculation based upon the number of the standards fields that are filled out
- Process – Sensitive information, list the processes and their information usage, including the information sensitivity and privacy level
- Event context, shows events related to the diagram, and the associated diagrams where the event is triggered from and what it triggers
Visualize
The Visualizer tile links to a set of cool new visualizations.

Read more about the model gallery and the visualization feature here.
Hierarchy view
The process diagrams, and the application architecture diagram includes a hierarchy view as part of the standard dashboards.
The hierarchy view is browsable, the user can unfold the hierarchy to explore the structure and navigate directly to a specific diagram.
This feature has been part of QualiWare for some time, using the hierarchyview template.
What is new, however, is that the hierarchy updates automatically as part of the governance flow when new diagrams are added via the “breakdown to” or “visualized by” relations.

Additional features
Report, RASCI, Context View
From the dashboard there is access to:
- a set of new standard reports for the following diagrams: BusinessProcessNetwork, WorkflowDiagram, BusinessProcessDiagram, ApplicationArchitectureDiagram
- the RASCI view of the diagram, similar to the RASCI tab in the classic tabular layout
- the Context View of the diagram, similar to the tab in the classic tabular layout

Ratings, Governance History and Acknowledge History
From the dashboard there is access to:
- Ratings, showing the ratings made on the diagram (similar to the tab in the classic tabular layout)
- Governance History, similar to the tab in the classic tabular layout (see more about the Governance History here)
- Acknowledge History, similar to the tab in the classic tabular layout (read more about the Acknowledge list here)

Business Charts, Gantt Charts, Heatmaps, …
From the dashboards, it is also possible to link to other types of content known from desktops and the classic diagram workspace, this includes (dependent on the diagram type):
- Business Charts, e.g., charts available in the right pane of a diagram workspace, or showing data from the Social Behavior Warehouse about user and content activity
- Gantt Charts, e.g. showing improvement schedule
- Heatmaps

Video Highlights
Configuring Dashboards
A set of standard Dashboard is included in the standard publisher.
The dashboards can be configured, enabling you to customize them to your need and update them as the scope and focus can change over time.
Template Definitions
In the HTMTemplateDefinition, you can specify template-specific dashboard(s). This includes the number of possible dashboard(s) available for each user role and the content on each dashboard.
The Dashboard are configured using the templates:
