DataConversionTemplate

The DataConversionTemplate specifies a Interface and the settings for conversions.

It can be used to do reverse engineering of databases, linked by a SubjectArea (on the Physical Implementation tab) from a DataModellingStructure.

The DataConversionTemplate specifies an Interface and the settings for conversions.

– Select the Interface and create the default values.

Right click the Settings areas a select Default to add the Default Content.

The settings can also be added manually.

Hint: New option fields are read-only by default. Move the horizontal cursor to the left and select the Option will enable 4 options:

  • 0 => Read only
  • 1 => Editable as string
  • 2=> By choice e.g. True or False (Add choices in ‘Choice’ column, before selecting default value in ‘Value’ column )
  • 3=> Object selection filtered by template

Name Convention

Right click the Settings areas a select Default to add the Default Content.

Internal Messages

Right click the Settings areas a select Default to add the Default Content.

Video

The DataConversionTemplate can be used to reverse engineering of databases (together with Data Modelling Structure and a DataSourceConnection)

Reverse engineering of SQL Server database

Data Modelling Structure

The DataModellingStructure diagram is used to create model of datastructures.

The diagram is used to assemble the subject areas of your datamodel and it will keep track of all level of abstractions from highest level concept models, all the way through the physical representation of a database.

The diagram can be used to reverse and forward engineer databases.

The diagram consist of one or multiple SubjectArea that can be broken down to logical level using DataModelDiagram and physical level using RelationalDiagram.

First time you create a SubjectArea you are asked to create the logical model (this can be added later).

From the SubjectArea there are links to (Breaks Down To) the available models on the different abstraction levels:


On the Physical Implementation tab, you can link to DataConversionTemplate and add a DataSourceConnection.

When you double click on the SubjectArea you can select to open the dialog, or go to the available models directly:


Video

The Data Modelling Structure can together with the DataSourceConnection be used to reverse engineering of databases.

Reverse engineering of SQL Server database

Table

A Table is a basic component in a Relational Diagram that represents a collection of related data organized in rows and columns. Tables are the fundamental building blocks of a relational database, and they provide a structured way of storing and organizing data, making it easy to access, query, and manipulate.

Tables can be related to each other through foreign key constraints, creating a relational schema that models the interrelationships between different entities in the system being represented.

Example: In a Relational Diagram for a system that manages a university, you might have a table called “Students” that stores information about all the students enrolled in the university. The table might have columns such as “id”, “name”, “major”, “email”, and “enrollment_date”, among others. Each row in the “Students” table represents a single student record, with values for each of the corresponding attributes. The “id” column serves as the primary key for the table, uniquely identifying each student record. Other tables in the database, such as “Courses” and “Enrollments”, can be related to the “Students” table through foreign key constraints, creating a relational schema that models the interrelationships between different entities in the university system.

Node

A physical element that exists at run time and represents some computational resource.

Node properties

The Node tab

Property  Metamodel name Description
Short Description ShortDescription
Represents Represents Links to: ClassDiagram, Interface, ComponentDiagram, Class, Object, Component.
Property Property Choices are:
Root
Leaf
Abstract

The Extensions tab

Property  Metamodel name Description
Stereotype Stereotype Links to: Stereotype.
Constraints HasConstraints Links to: Constraint.
Tagged values HasTaggedValues Links to: TagDefinition.

Data Entity

A DataEntity represent a logical group of information – a category of information.
In the early phases of a system analysis or even a business analysis a DataEntity is used to describe physical objects like ‘Customer’, ‘Order’ or ‘Product’. Or it is used to describe important concepts in the modelled system or its surroundings.

In a later phase a DataEntity will represent a smaller normalized informationgroup.

One of the most important characteristics of a DataEntity is, that it can be uniquely identified using a relation to a Key, and that it has got non-key Attribute describing its information content.

In QualiWare Lifecycle Manager the concept of a DataEntity includes a description of the operations performed on the DataEntity during its lifecycle – i.e. from it is created for the first time in the system, until it is deleted. This is accomplished by letting the user relate a DataEntity to a series of operations – here called Methods. This object oriented approach makes it possible for the designer to separate into small reusable groups related information and functions.

When a DataEntity is created it is good practice to give it a primary key. When this is done and the OK-button on the DataEntity dialog is pressed, the key attributes is automatically transferred to the attribute link list.

Subject Area

Subject Area defines major groupings of data or information concepts.

It can be broken down to a more detailed information modelling diagram(s).

A subject area can be classified:

Reverse and forvard Engineering

A SubjectArea can be used to reverse and forvard engineer databases. From the SubjectArea there are links to “Breaks Down To” references to DataModelDiagram (logical level) and RelationalDiagram (physical level).

On the Physical Implementation tab, you can link to DataConversionTemplate and add a DataSourceConnection.

When you double click on the SubjectArea you can select to open the dialog, or go to the Logical (RelationalDiagram) or Physical (DataModelDiagram) directly.

When you have linked a SubjectArea (with a DataSourceConnection) as Master to a RelationalDiagram you can reverse engineer, see more on the RelationalDiagram.

Relational Diagram

Purpose: The purpose of the Relational Diagram is to document the relationship between different types of information on a physical level. Below, you can see an example of a Relational Diagram showing the relationship an Order in a booking system to related data.

Core concerns: The Relational Diagram is a physical data model and consists of Tables and Physical Foreign Keys. Inside each table, information about Indexes, the related Data Entity, Columns and Physical keys.

Relation to other templates: The Relational Diagram offers a more detailed view on data and its interrelationships than for example the Conceptual Data Model and the Business Object Model. Other physical data models include the Data Mapping Diagram, the Class Diagram, the Data Model Diagram and the Data Replication Diagram.

Properties and metadata: The Relational Diagram can for example retain the following information:

  • A description of the diagram
  • Link to the owner of the diagram
  • Link to the one responsible for the accuracy of the diagram
  • Audits (auto generated information regarding its current state and access rights)
  • Associated documents, diagrams and other objects
  • Inherent Risk detailing risk considerations
  • Governance information detailing information about the published diagram and who has been involved in the approval of the diagram
  • Project status: information about budgeted and actual man-hours spent, percentage completed and the latest milestone, result and quality control of a change process.

In the picture below you can see the Relational Diagram’s properties dialogue window, where the properties can be viewed and edited:

Reverse and forward Engineering

The RelationalDiagram can be used to Reverse engineer a database.

Right click on the white canvas to open the dialog for the Diagram.

On the main tab you can add a link to a Data Source (linking a DataSourceConnection).

Once you can have addded a DataSource you can select Catalogue and Schema from the drop-down menu. If the drop-down list is empty, then the DataSourceConnection isn’t working, and you have to test it, see more.

NOTE there need to be a parent SubjectArea for the diagram for this to work, if not you will get this message.

You can link a SubjectArea to a RelationalDiagram from the SubjectArea, see more here.

Physical Detail

Add the default values by right clicking and select “Use from Default”

Reverse Engineer

It is now possible to reverse engineer the Relational Diagram using the Setting from above (DataSourceConnection, Catalog, Schema, and Setting on Physical Detail).

Select Reverse Engineer from the Tools menu i QLM, and select the tables to be included in the Diagram.

After a little while the Diagram is created (reverse engineered)

You can re-arrange the symbols to get a good representation.

The Green dots represent that the Model correspond to the real Database.

You can open the properties of the tables on the diagram.

If you change the properties of the table so that it no longer corresponds to the databasestructure, the dot turns from green to yellow on the diagram.

Table – Physical Detail

On the Physical Detail tab, it is possible to change the target value and options for the details.

Hint: All fields are read-only by default. Move the horizontal cursor to the left and select the Option will enable 4 options:

  • 0 => Read only
  • 1 => Editable as string
  • 2=> By choice e.g. True or False
  • 3=> Object selection filtered by template

Forward Engineering

It is possible to forward engineer from the RelationalDiagram to the physical database. This can be executed from the Tools menu in QLM.

Create DDL

From the RelationalDiagram it is possible to create DDL code that can be used to create or update a database.

DDL conversion parameters are set on the DDL Settings tab. You can right click the box to Use default.

On the Physical Details tab you can similary add the Default settings, and choose the DDL pending action (Update/Create).

When the Create DDL is activated, an ExternalDocument will be created based upon the settings and added to the list of DDL Conversions on the RelationalDiagram.

Conversion

It is possible to convert between the different models.

It is possible to convert a RelationalDiagram from the physical level to a logical DataModelDiagram from the tools menu in QLM.

Video

The DataSourceConnection can together with the DataModellingStructure be used to reverse engineering of databases, getting the database structure represented in a RelationalDiagram.

Reverse engineering of SQL Server database

Data Model Diagram

Purpose: The Purpose of the Data Model Diagram template is to model the structure of data entities of an Information System and their relationships. Documenting the structure of information is a very important part of the preliminary analysis before implementing any Information System.

Core concerns: The Data Model Diagram template enables the user to document the structure of the information, that an Information System is supposed to store. The template allows you to model using Data Entities, Subject Area, Data Entity View, Model View and inheritance. The Connection types available are: Data Relation, Inheritance Connection, Complex Relation and Generalization. Below you can see an example of a Data Model Diagram describing the information structure related to an order:

DataModelDiagram_1

Relation to other templates: The Data Model Diagram template should not be used to document data flows. In that case the Data Flow Diagram template should be used.

Properties and metadata: The Data Model Diagram can for example retain the following information:

  • A description of the diagram
  • Link to the owner of the diagram
  • Link to the one responsible for the accuracy of the diagram
  • Audits (auto generated information regarding its current state and access rights)
  • Associated documents, diagrams and other objects
  • Inherent Risk detailing risk considerations
  • Governance information detailing information about the published diagram and who has been involved in the approval of the diagram
  • Project status: information about budgeted and actual man-hours spent, percentage completed and the latest milestone, result and quality control of a change process.

The above picture shows the properties dialogue window for the Data Model Diagram where you can view and edit the diagram’s properties.


Conversions

It is possible to convert between the different models.

It is possible to convert a DataModelDiagram from the logical model to a conceptual (ConceptualDataModel) and physical level (RelationalDiagram) from the tools menu in QLM.

From the same menu the model can also be converted to an OntologyDiagram, and the model can be created from an OntologyDiagram read more here:

Data Flow Diagram

Purpose: The purpose of the Data Flow Diagram is to document a system’s or part of a system’s data flows; the data input the system (or a process within the system) consumes and the data output the system produces.

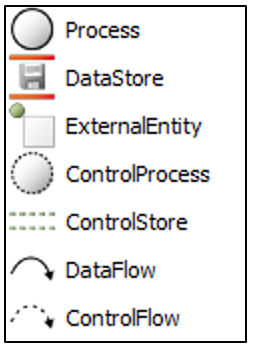
Core concerns: The Data Flow Diagram enables you to model Processes, Data Stores, External Entities, Control Processes and Control Stores. These elements can then be connected by either Data Flows or Control Flows.

Graphical representation of the elements:

The Data Flow Diagram can show different levels of processes within a system that exchange data, and illustrate how those exchanges occur. As such, the model can document a system’s functional hierarchies.

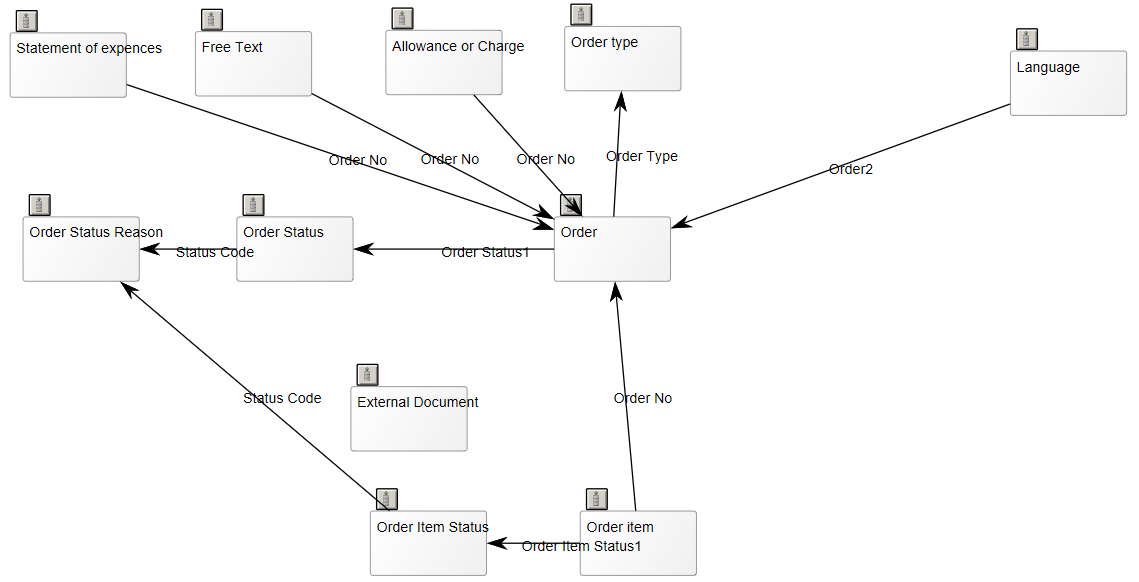
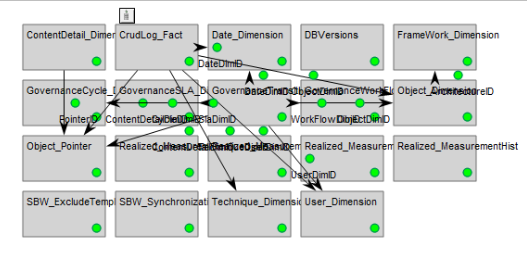
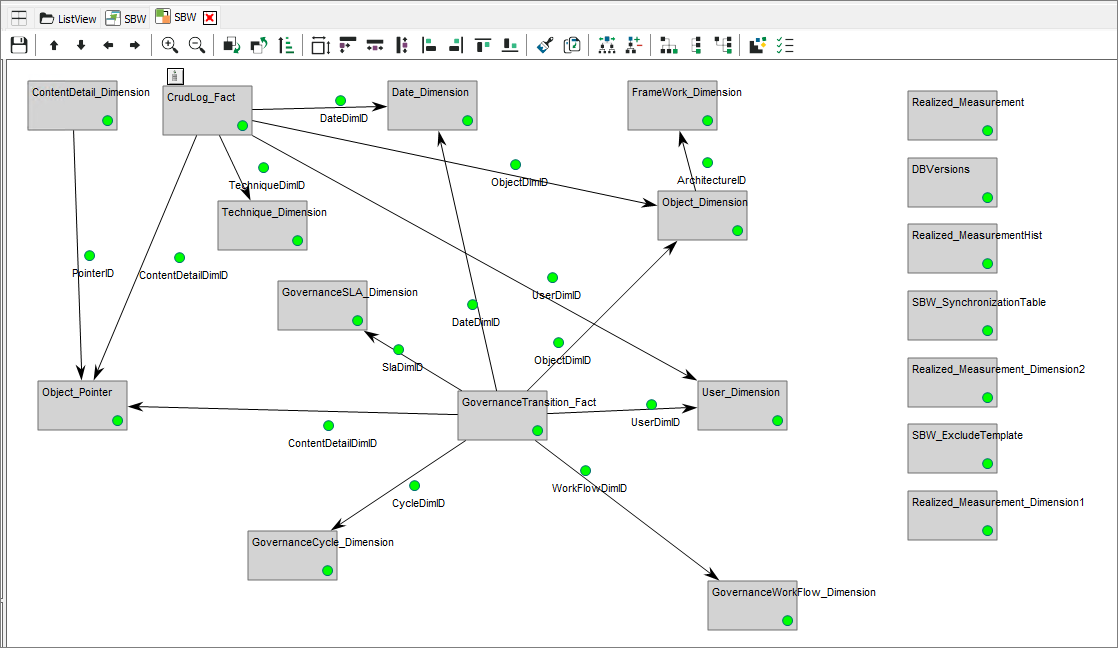
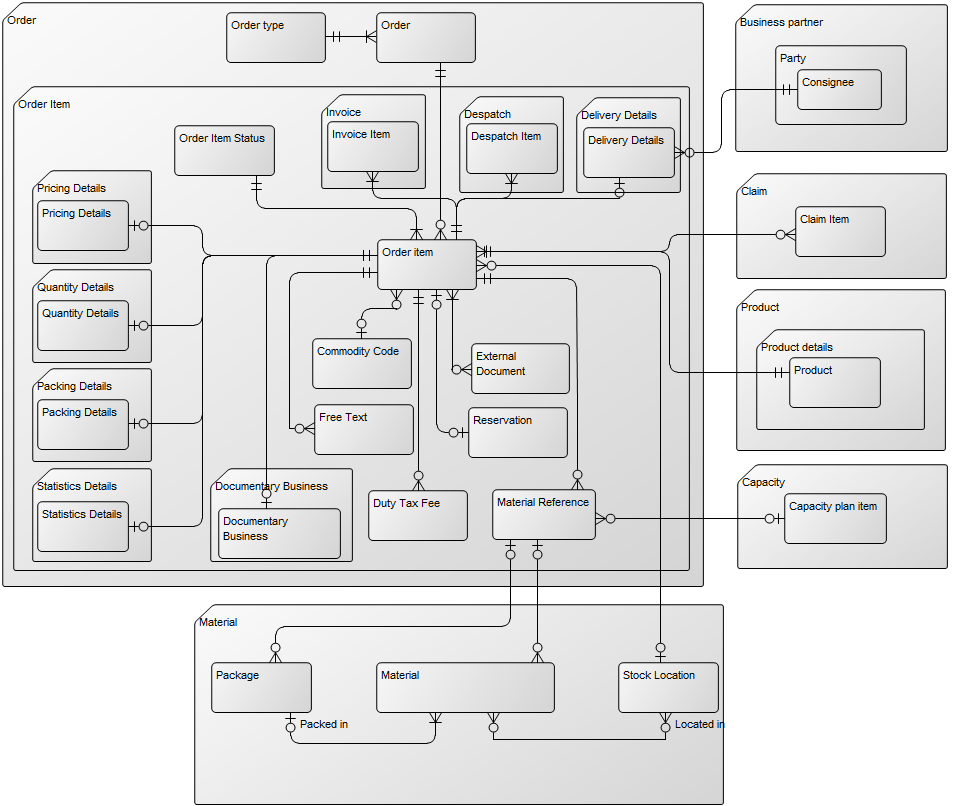
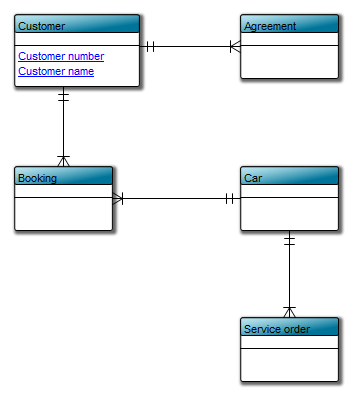
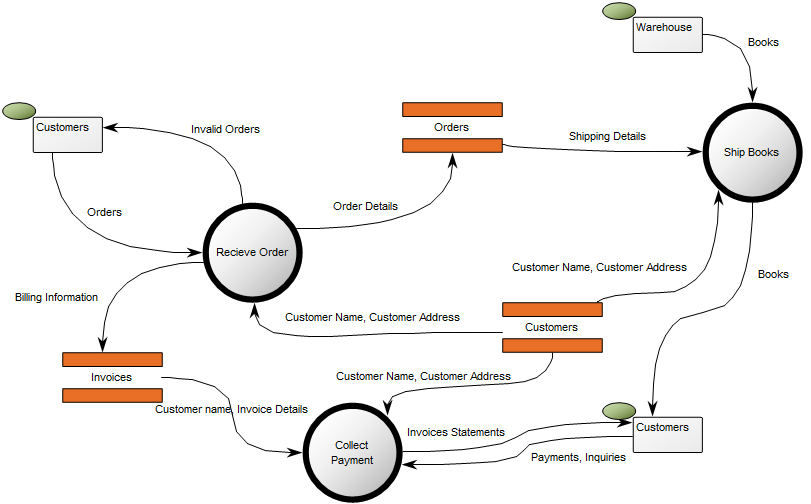
Below, you can see an example of a Data Flow Diagram showing the Data Flows between several Data Stores, Processes and External Entities in a Bookshop:

DataFlowDiagram_2

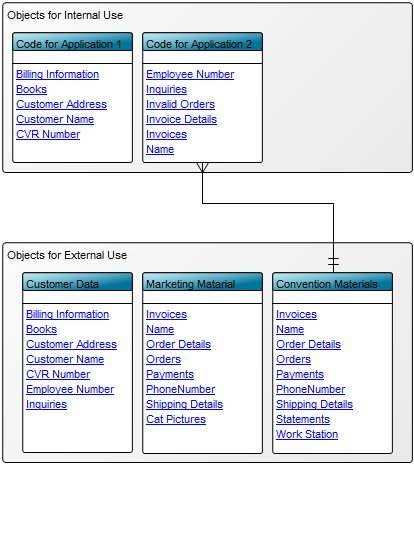
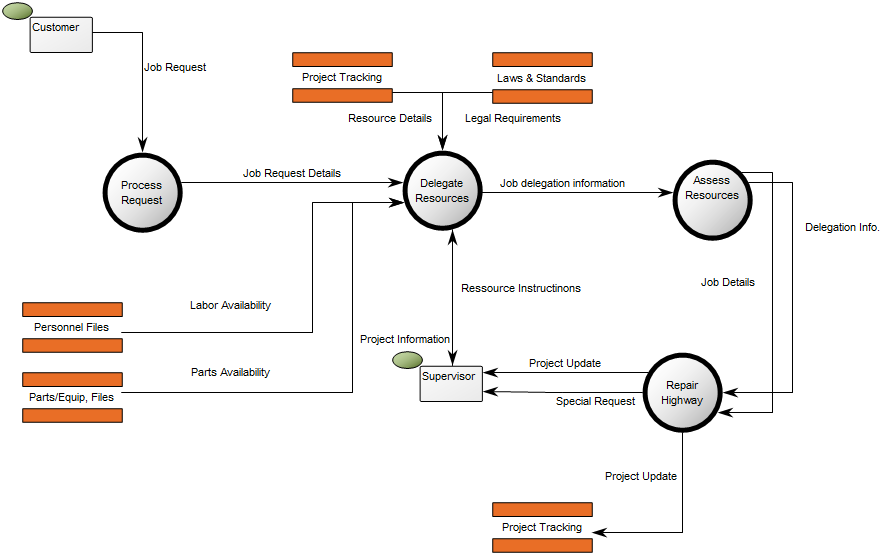
The next example shows the Data Flow between process, Data Stores and External Entities for a Highway Repair Service:

DataFlowDiagram_1

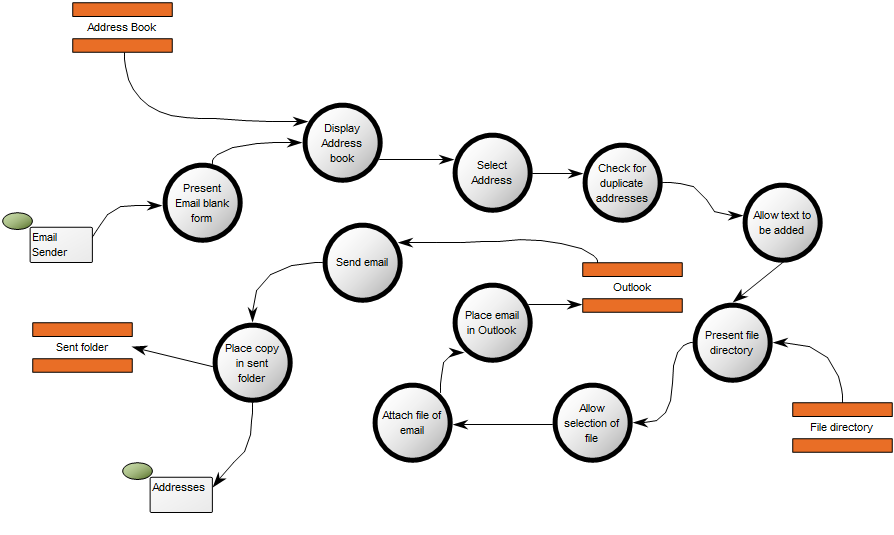
The final example shows the Data Flows between Processes, Datastores and External Entities in an Outlook Mailbox:

dfd

Relation to other templates: The Processes in the Data Flow Diagram can be decomposed into more detailed Data Flow Diagrams to comprise the total functional model. The top level of a Data Flow Diagram is sometimes called a Context Diagram. However, in QLM we use the Data Flow Diagram template for the higher levels as well as the more detailed ones.

The Data Flow Diagram can be a decomposition of an Information System. It can offer a more detailed view of Data Flows than, for example, the Application Architecture Diagram.

An Information System could likewise be decomposed into a Business Process Diagram which offers a complimentary view less concerned with Data Stores and Data Flow, and more concerned with Activity Flow.

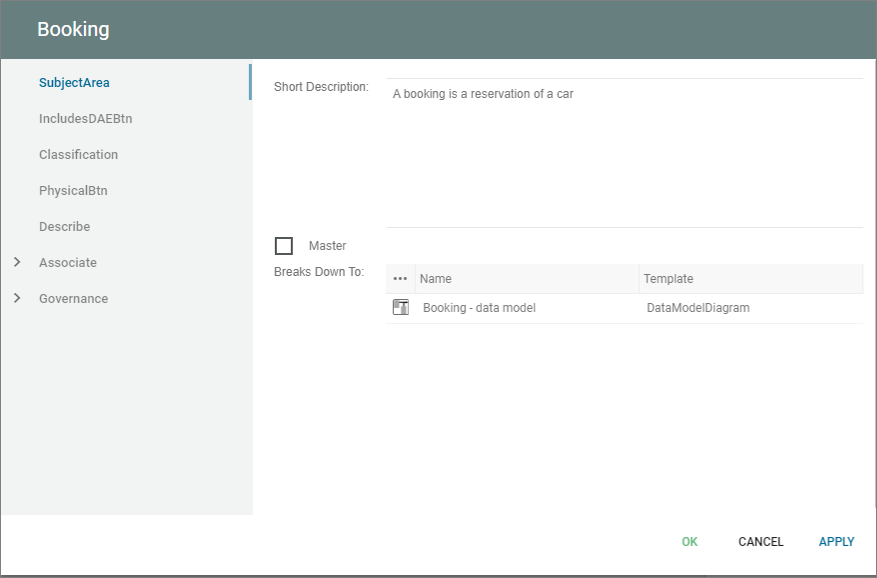
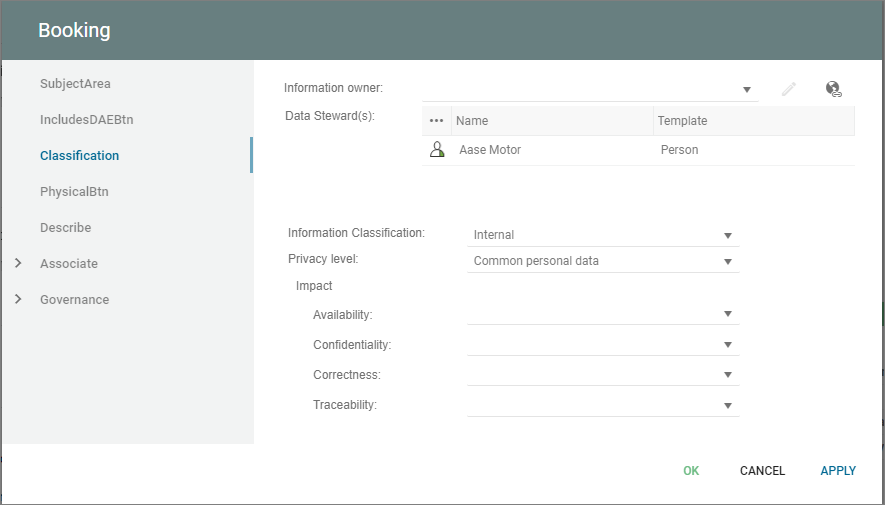
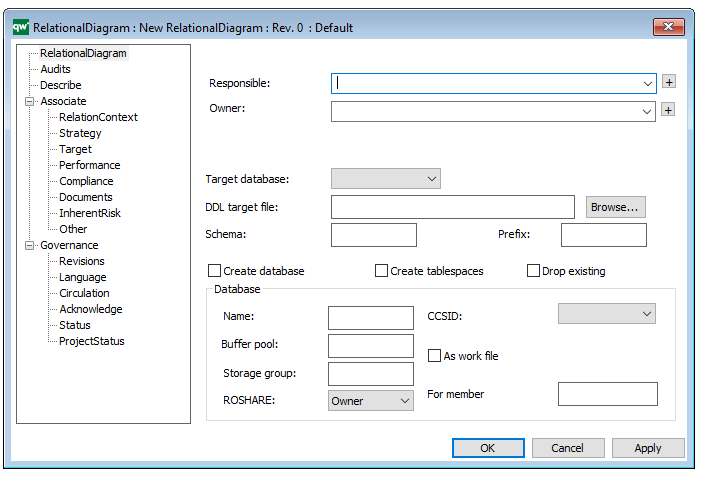
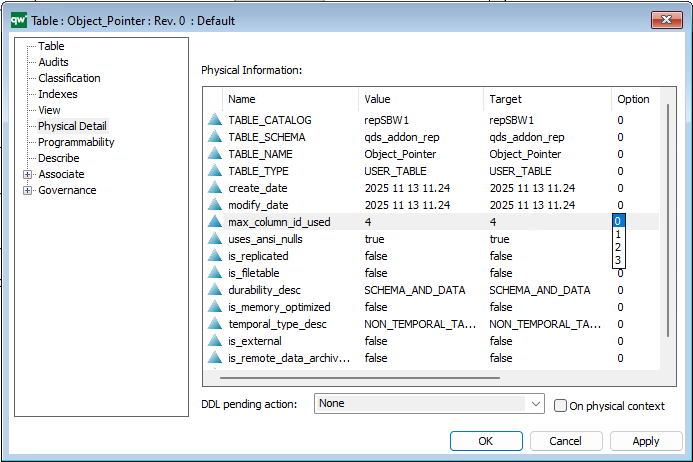
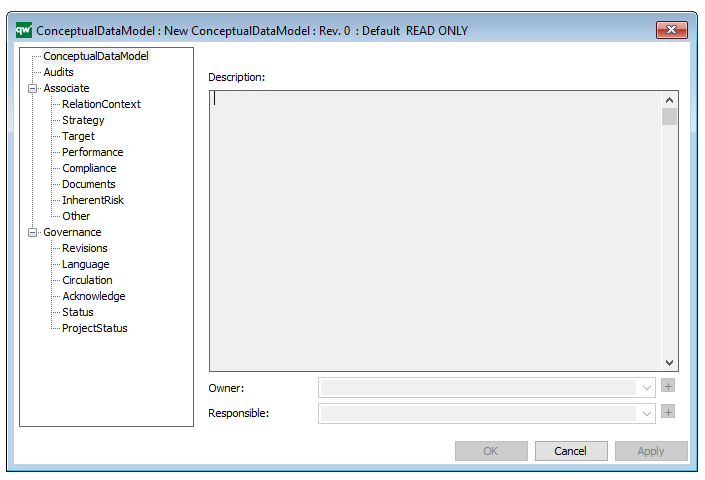
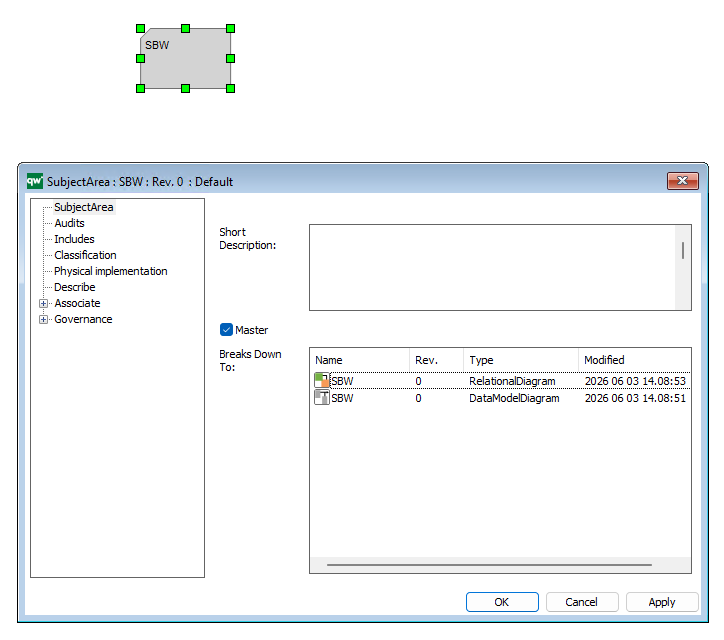
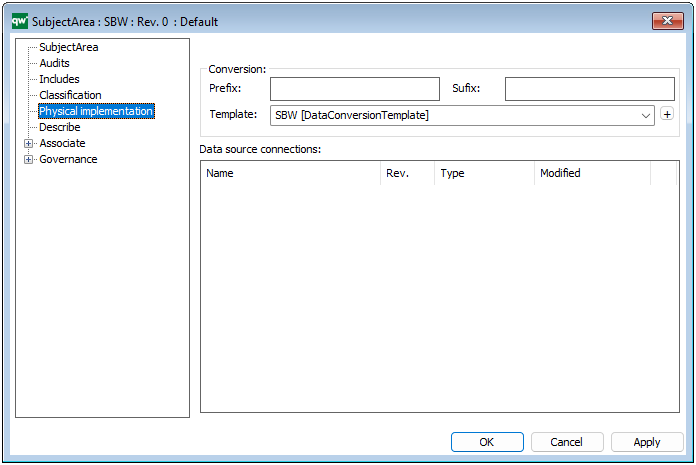
Properties and metadata: The Data Flow Diagram template ­­­­can for example retain the following information:

  • A description of the diagram
  • Link to the owner of the diagram
  • Link to the one responsible for diagram
  • Audits (auto generated information regarding its current state and access rights)
  • Associated documents, diagrams and other objects
  • Inherent Risk detailing risk considerations
  • Governance information detailing information about the published diagram and who has been involved in the approval of the diagram

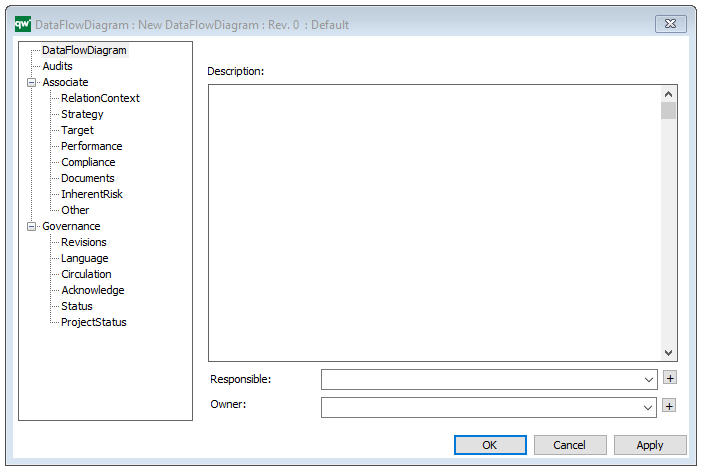
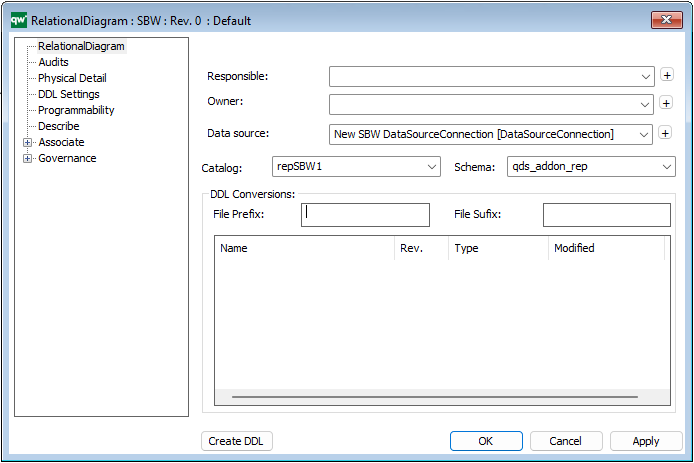
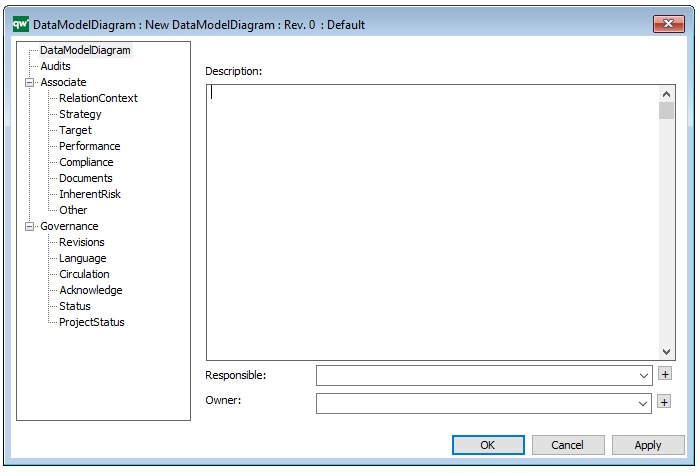
The above picture shows the properties dialogue window for the Data Flow Diagram template, where you can view and edit the diagram’s properties in QualiWare Lifecycle Manager.
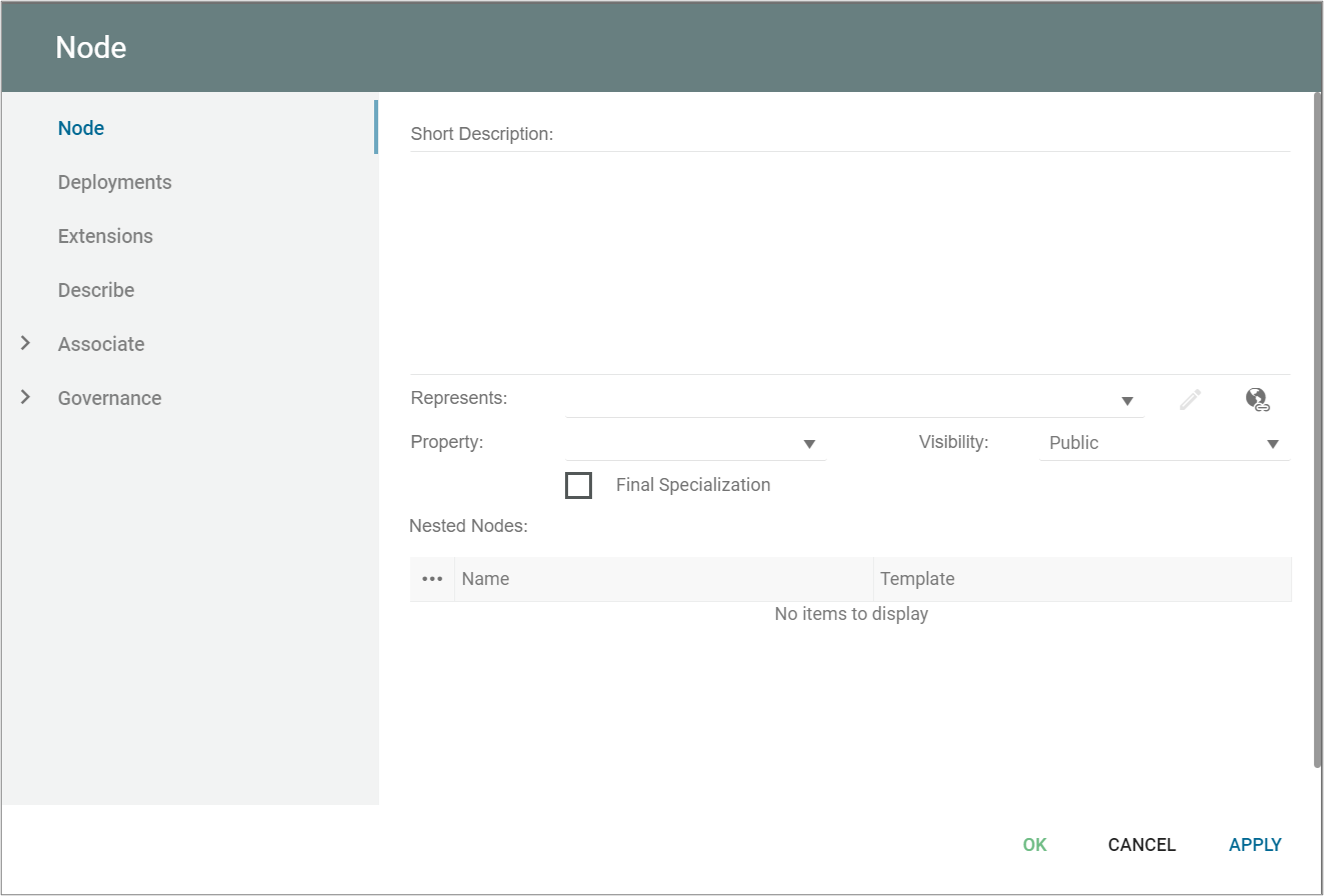
Conceptual Data Model

Purpose: The Conceptual Data Model template is used to describe a high-level business oriented structure of the information concept used in a specific business area. Below yo can se an example of a Conceptual Data Model where the data is divided into data for internal and external use:

ConceptualDataModel_2

Core concerns: The conceptual data model template enables you to model a preliminary high level data model. It may be abstract in content and sparse in attributes. Its preliminary structure allows for many-to-many relationships. When using the Conceptual Data Model, you can model Information Concepts, Subject Areas, and their interrelationships. Below, you can see a car rental service’s Conceptual Data Model for a customer’s data.

ConceptualDataModel_1

Relation to other templates: The conceptual data model is a means of communicating information structures between participants in a project or documenting the overall Information Concept of a specific organization. For a more detailed model you should use a Data Model Diagram.

Properties and metadata: The Conceptual Data Model can for example retain the following metadata:

  • A description of the diagram
  • Link to the owner of the diagram
  • Link to the one responsible for the accuracy of the diagram
  • Audits (auto generated information regarding its current state and access rights)
  • Associated documents, diagrams and other objects
  • Inherent Risk detailing risk considerations
  • Governance information detailing information about the published diagram and who has been involved in the approval of the diagram
  • Project status: information about budgeted and actual man-hours spent, percentage completed and the latest milestone, result and quality control of a change process.

In the picture below you can see the Conceptual Data Model’s properties dialogue window, where the information can be viewed and edited:

Conversion

It is possible to convert between the different models.

It is possible to convert a from the ConceptualDataModel conceptual model to a logical (DataModelDiagram) from the tools menu in QLM.

From the same menu the model can also be converted to an OntologyDiagram, read more here: