Purpose: The purpose of the Performance Diagram is to provide a view over an organization’s performance in reaching their strategic goals.
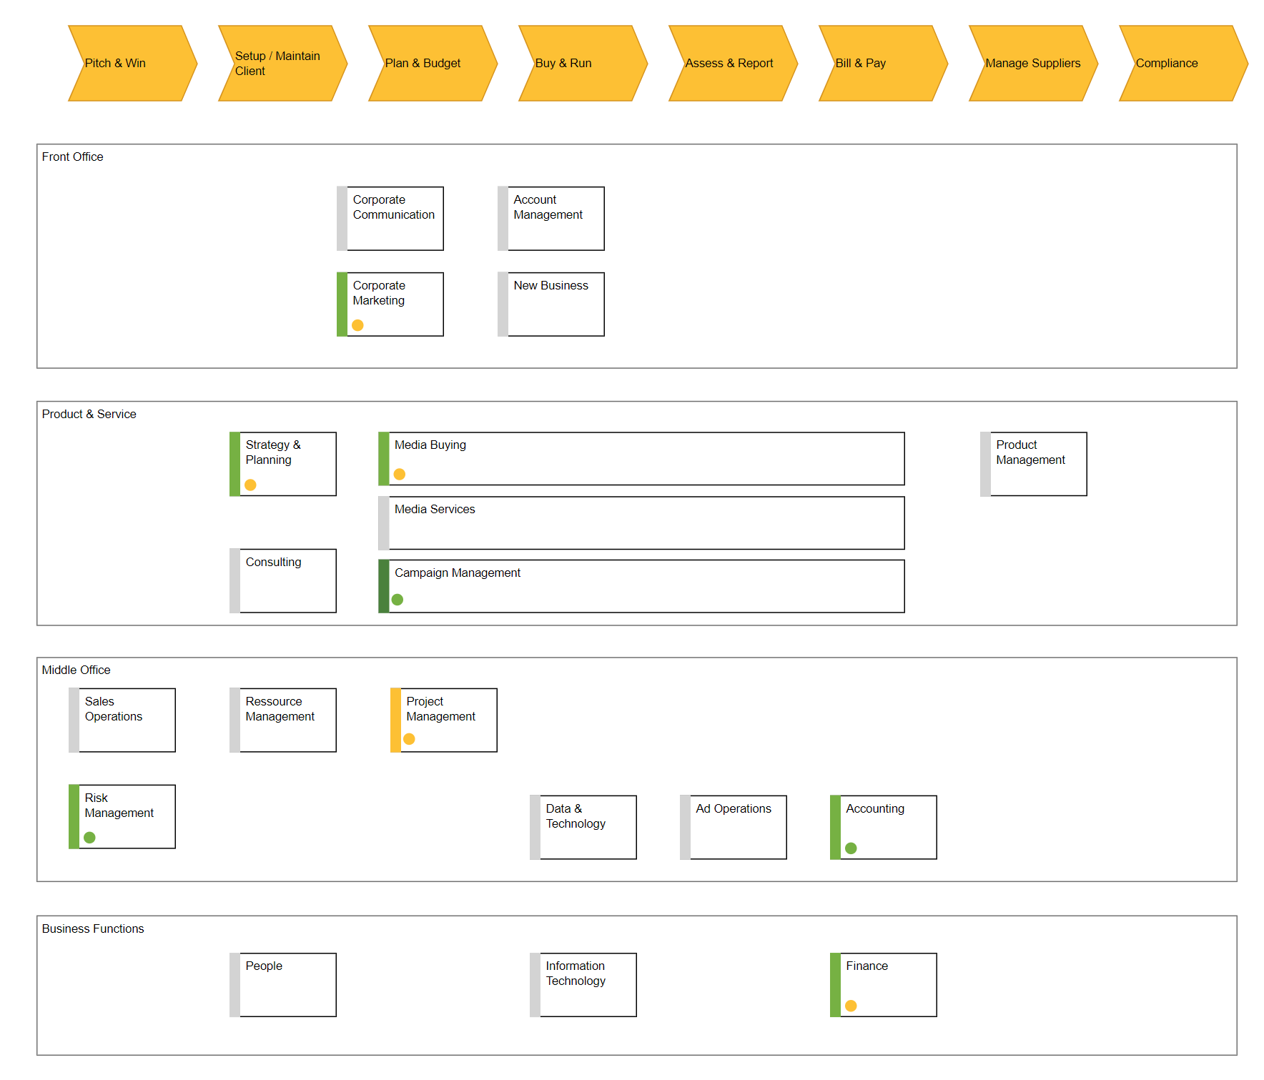
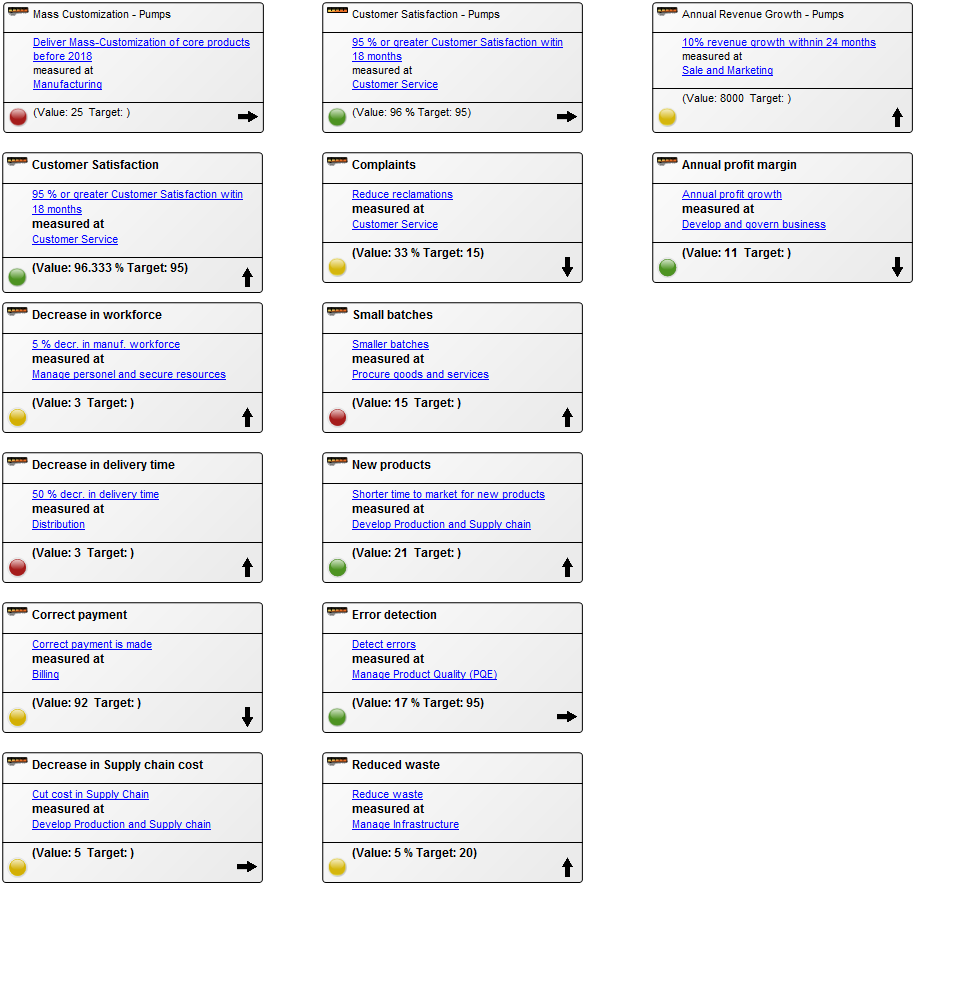
Core concerns: The Performance Diagram enables you to model Key Performance Indicators – which can be related to strategic goals, derivative Performance Indicators and Derivation Rules. You can create a Performance Diagram as a decomposition of a Key Performance Indicator and model a hierarchy of performance diagrams. The model below shows an overview of an organizations Key Performance Indicators and their status:
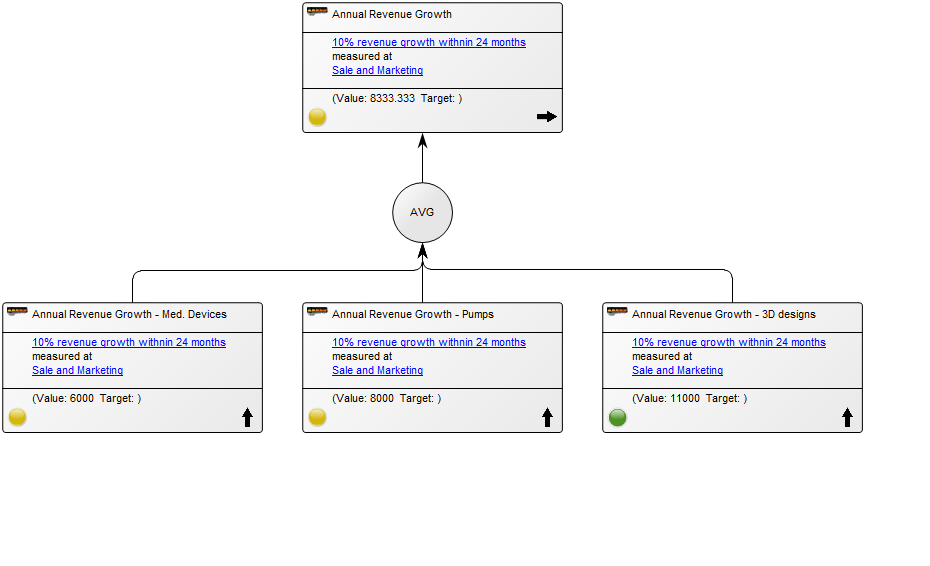
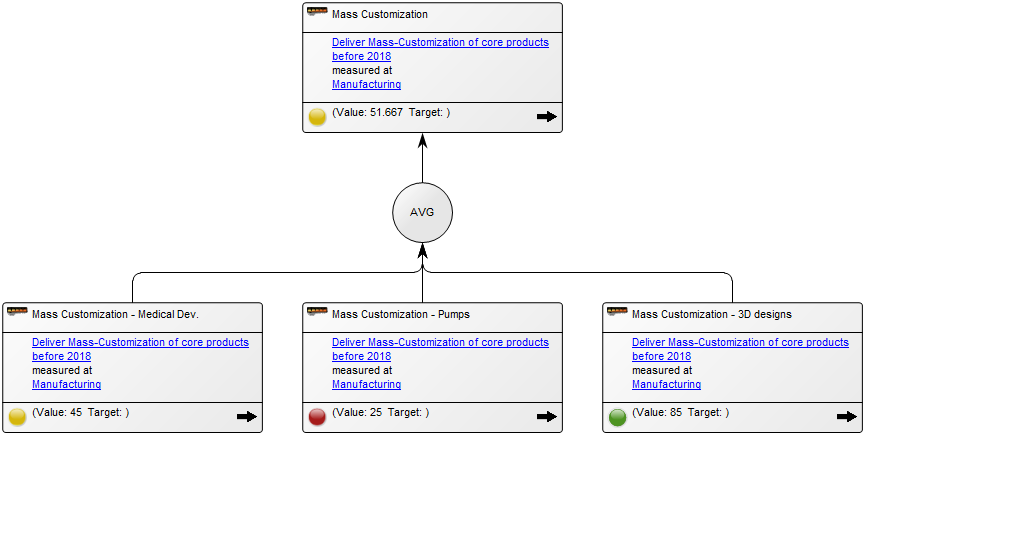
In the following model the Key Performance Indicator has been enriched with derivative performance indicators explaining in more details the status of the performance and how it is measured:
The overview of the Key Performance Indicators can also be presented with a simplistic view, highlighting their status using color coded icons:
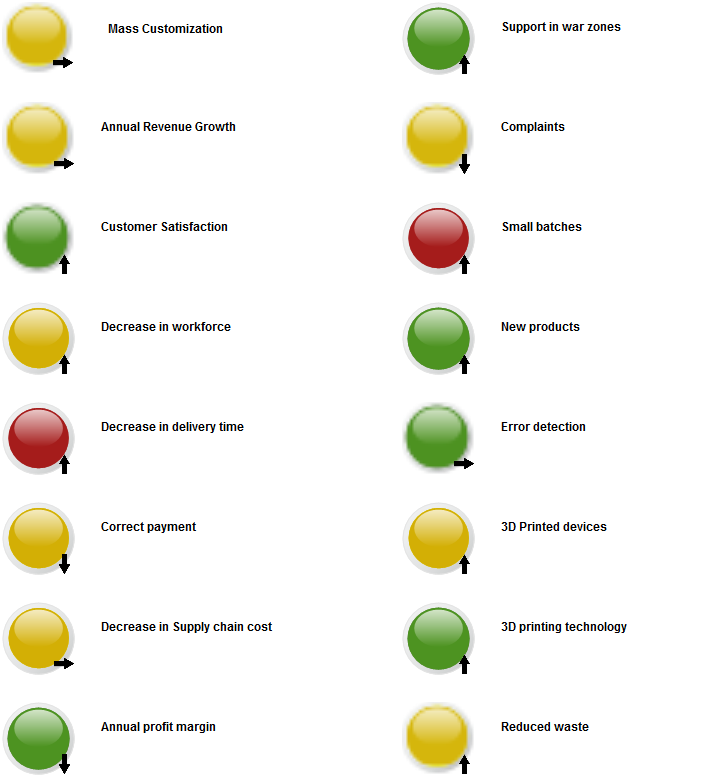
Relation to other templates: The Performance Diagram is a Strategic template and can be decomposed from Key Performance indicators contained in, for example, a Balanced Scorecard Diagram or Dashboard.
Properties and metadata: The Performance Diagram can for example retain the following information:
- A description of the diagram
- Link to the owner of the diagram
- Link to the one responsible for the diagram
- Audits (auto generated information regarding its current state and access rights)
- Associated documents, diagrams and other objects
- Inherent Risk detailing risk considerations
- Governance information detailing information about the published diagram and who has been involved in the approval of the diagram
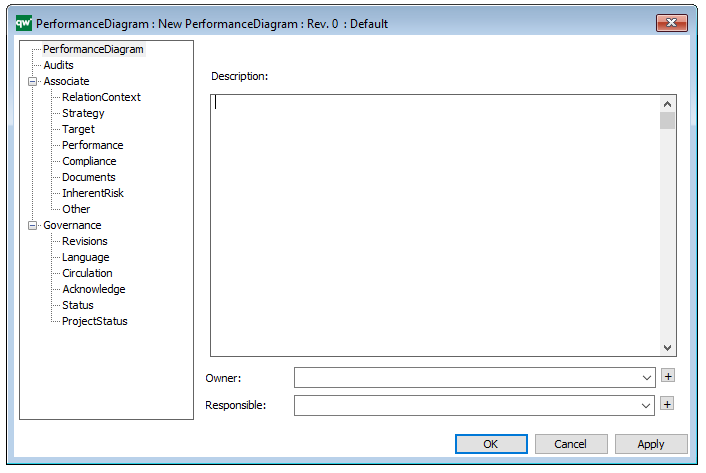
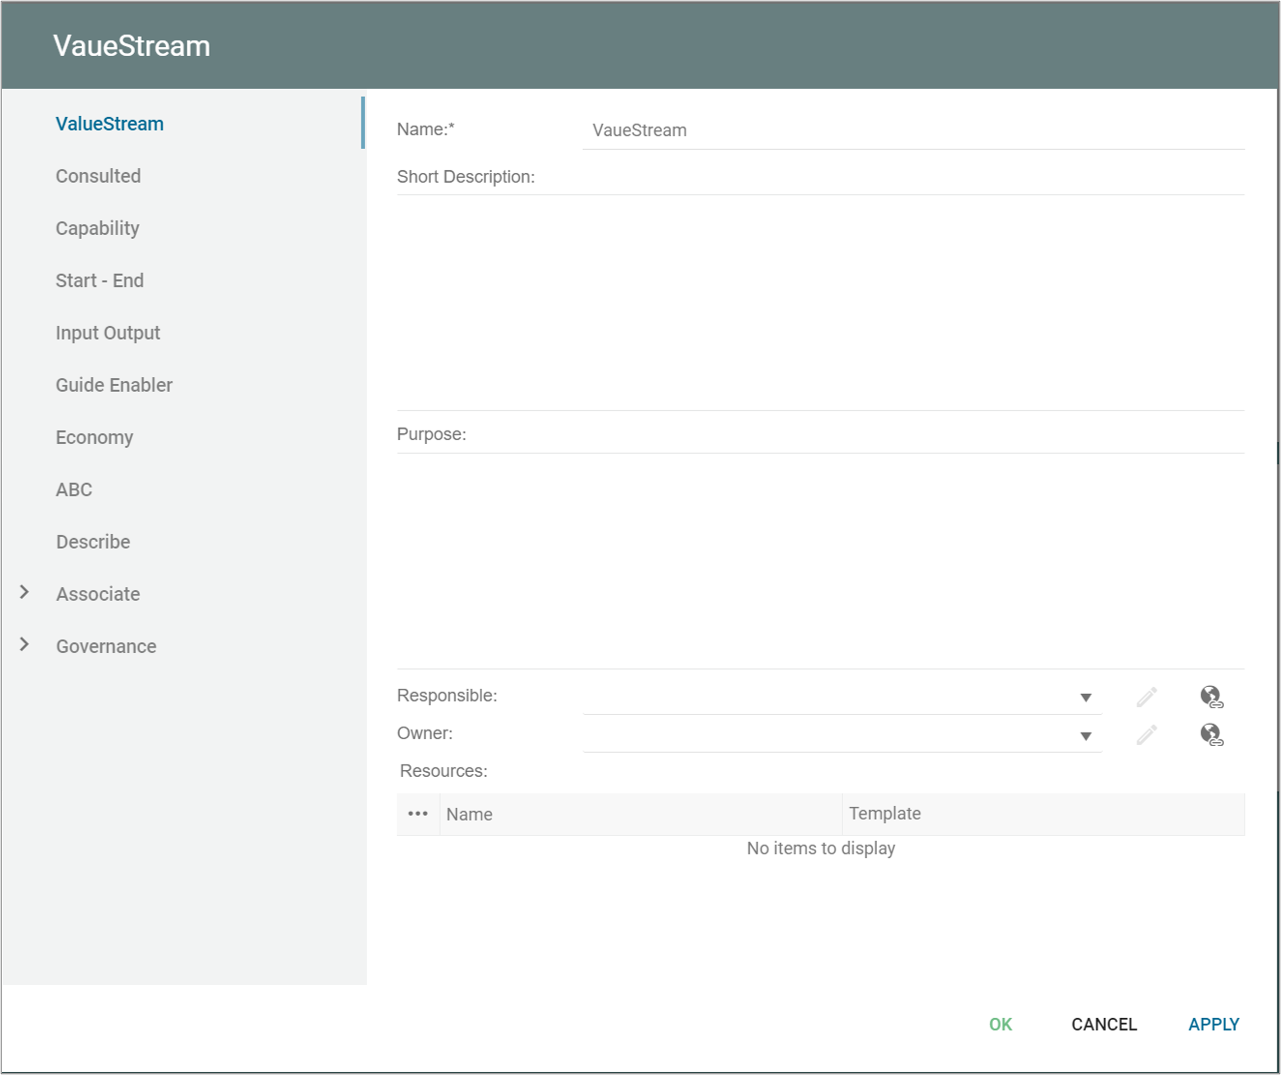
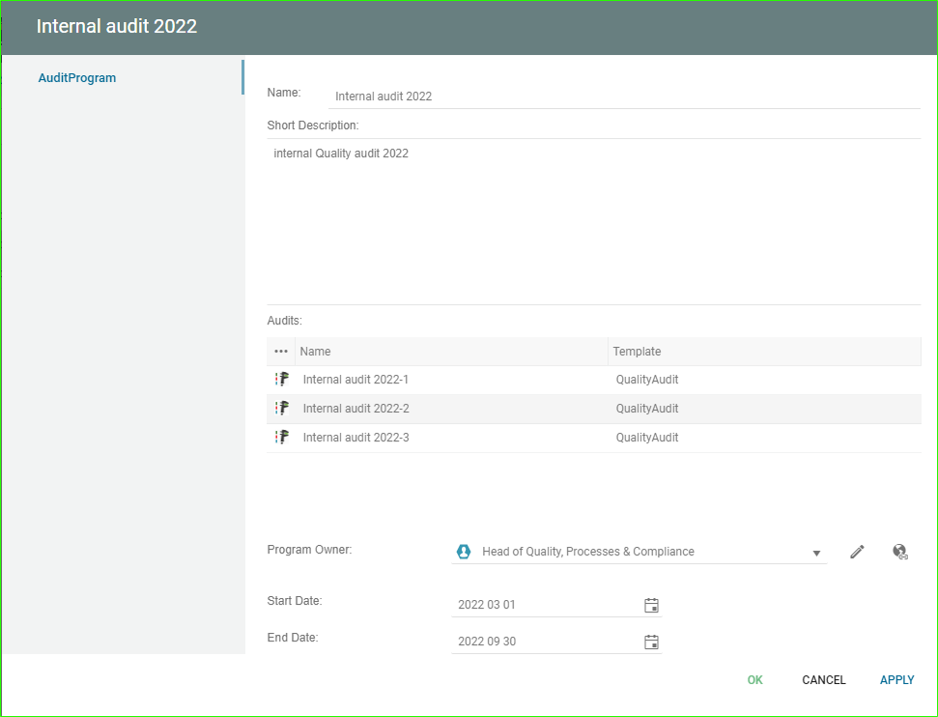
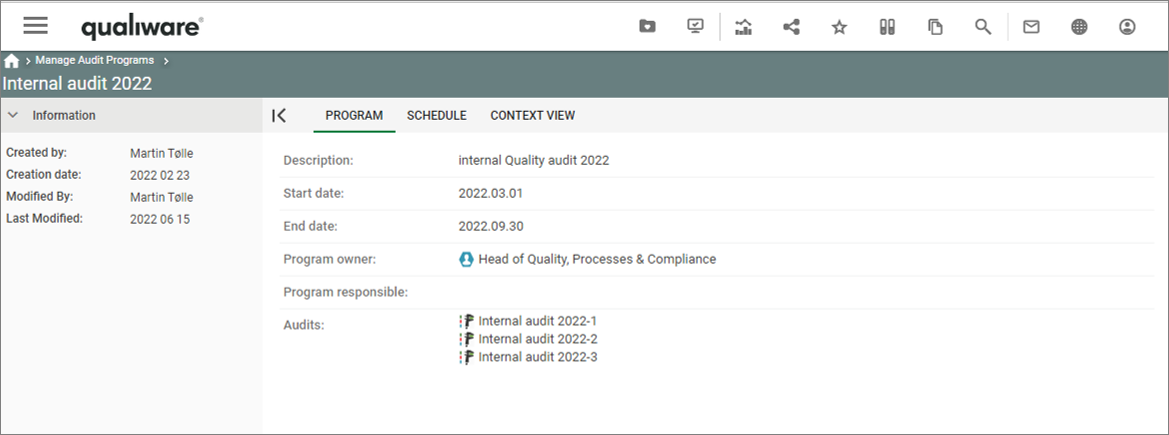
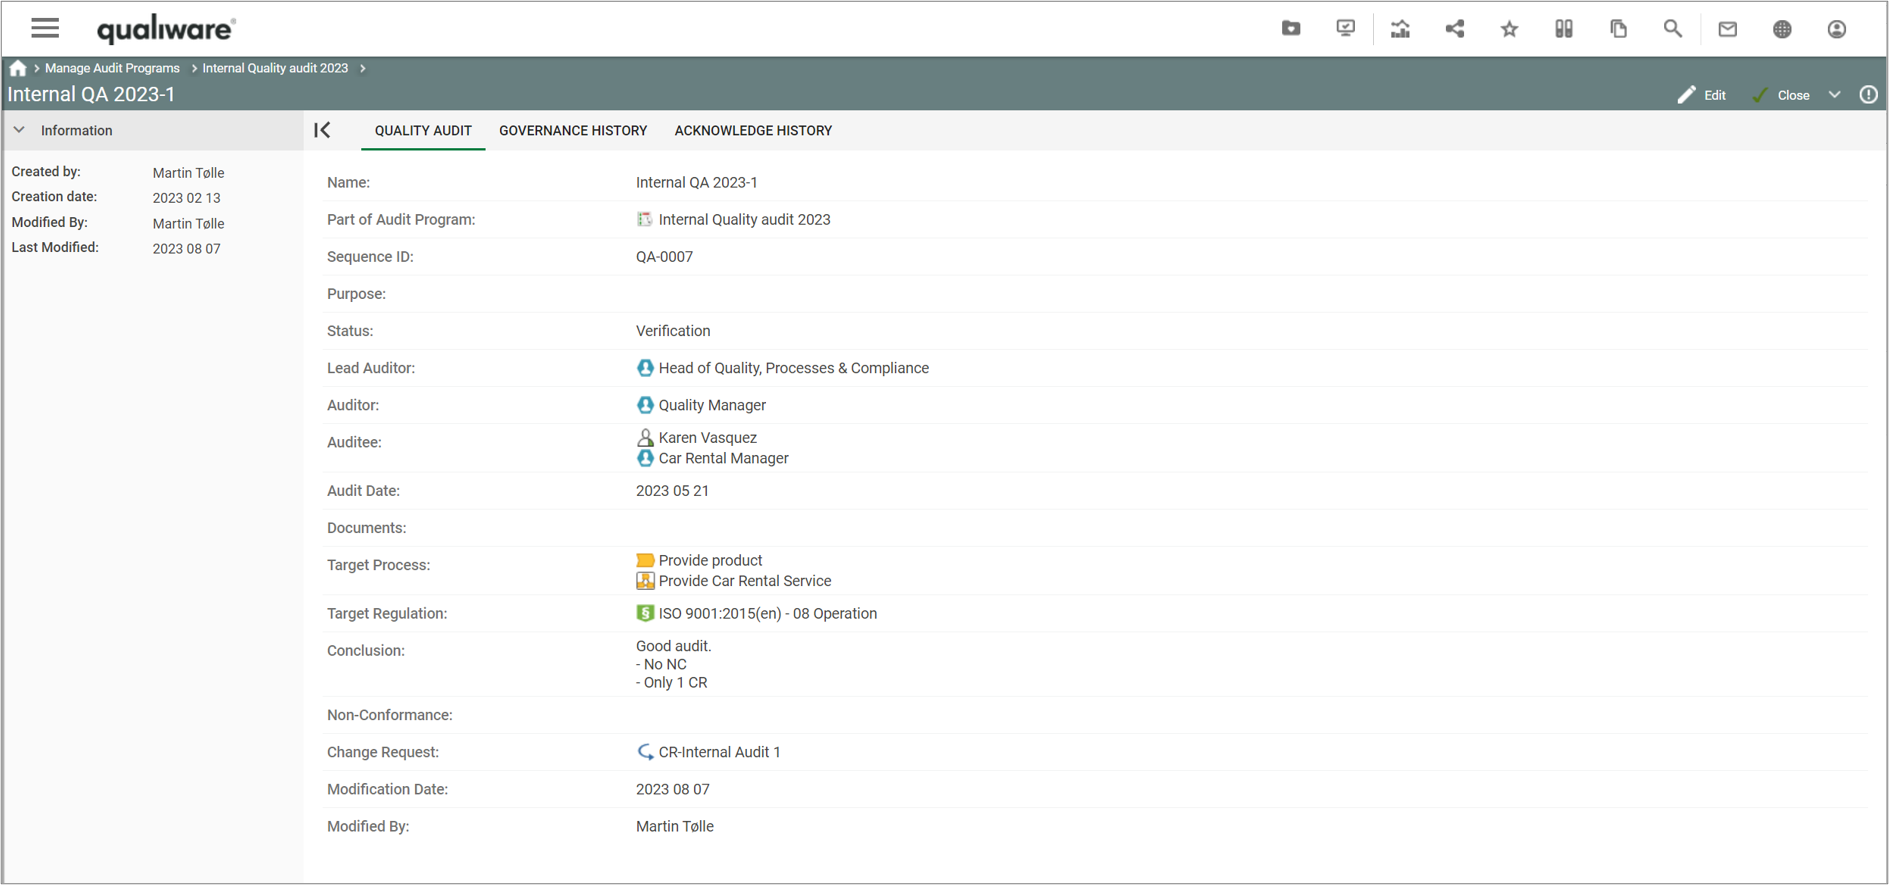
The above picture shows the properties dialogue window for the Performance Diagram where you can view and edit the diagram’s properties in QualiWare Lifecycle Manager.
