Purpose: The Purpose of the Data Model Diagram template is to model the structure of data entities of an Information System and their relationships. Documenting the structure of information is a very important part of the preliminary analysis before implementing any Information System.
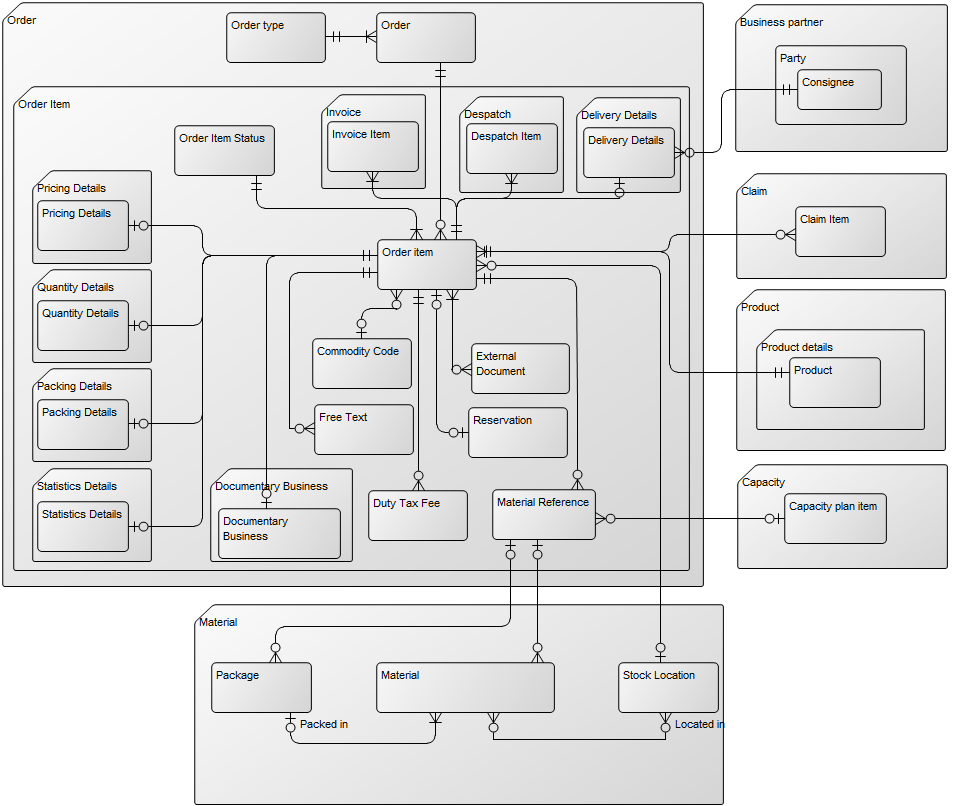
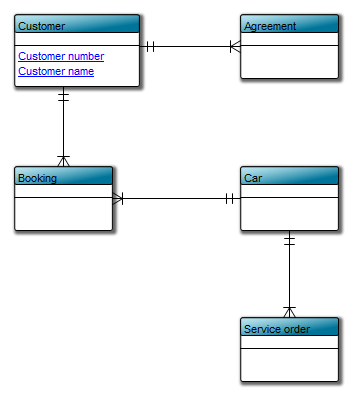
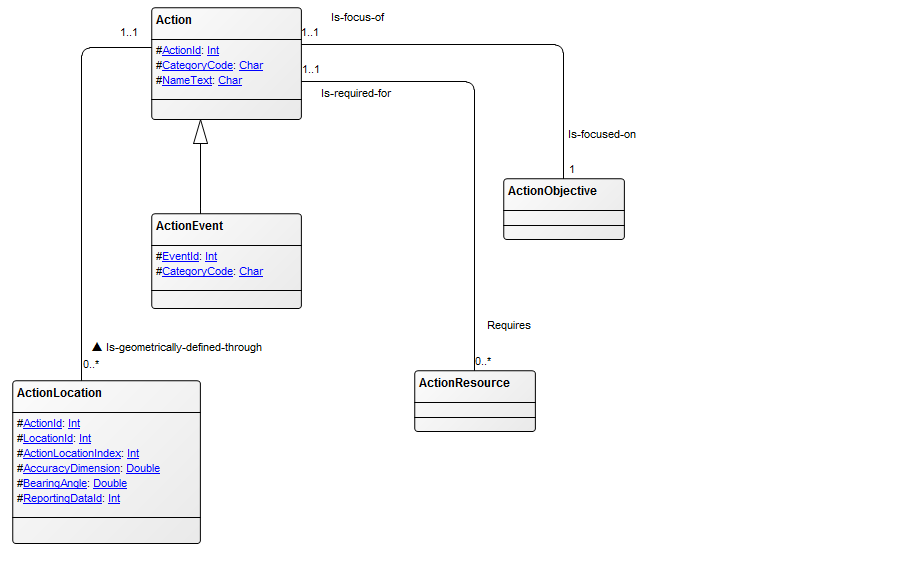
Core concerns: The Data Model Diagram template enables the user to document the structure of the information, that an Information System is supposed to store. The template allows you to model using Data Entities, Subject Area, Data Entity View, Model View and inheritance. The Connection types available are: Data Relation, Inheritance Connection, Complex Relation and Generalization. Below you can see an example of a Data Model Diagram describing the information structure related to an order:
Relation to other templates: The Data Model Diagram template should not be used to document data flows. In that case the Data Flow Diagram template should be used.
Properties and metadata: The Data Model Diagram can for example retain the following information:
A description of the diagram
Link to the owner of the diagram
Link to the one responsible for the accuracy of the diagram
Audits (auto generated information regarding its current state and access rights)
Associated documents, diagrams and other objects
Inherent Risk detailing risk considerations
Governance information detailing information about the published diagram and who has been involved in the approval of the diagram
Project status: information about budgeted and actual man-hours spent, percentage completed and the latest milestone, result and quality control of a change process.
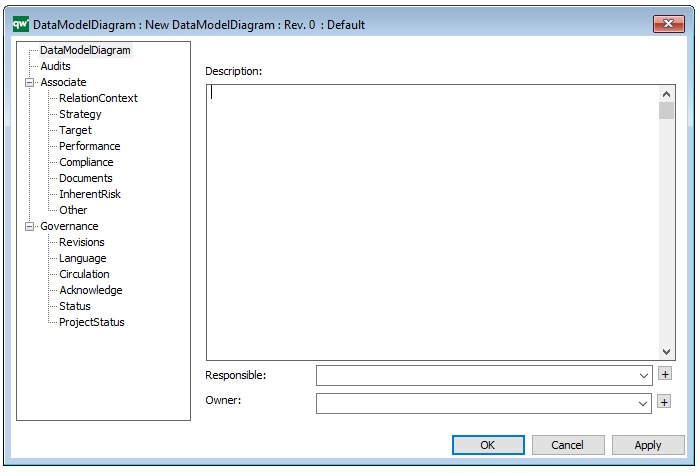
The above picture shows the properties dialogue window for the Data Model Diagram where you can view and edit the diagram’s properties.
Purpose: The Purpose of the Customer Journey Map template is to document the customer’s journey from awareness to the end of their interaction with an organization, covering possible touch points from the customer’s perspective.
Core Concerns: The Customer Journey Map template allows you to model connections between different Personas, Customer Journey Phases, Touch Points, Goals, Roles, Locations, Channels, Technology and the aspects from a SWOT analysis.
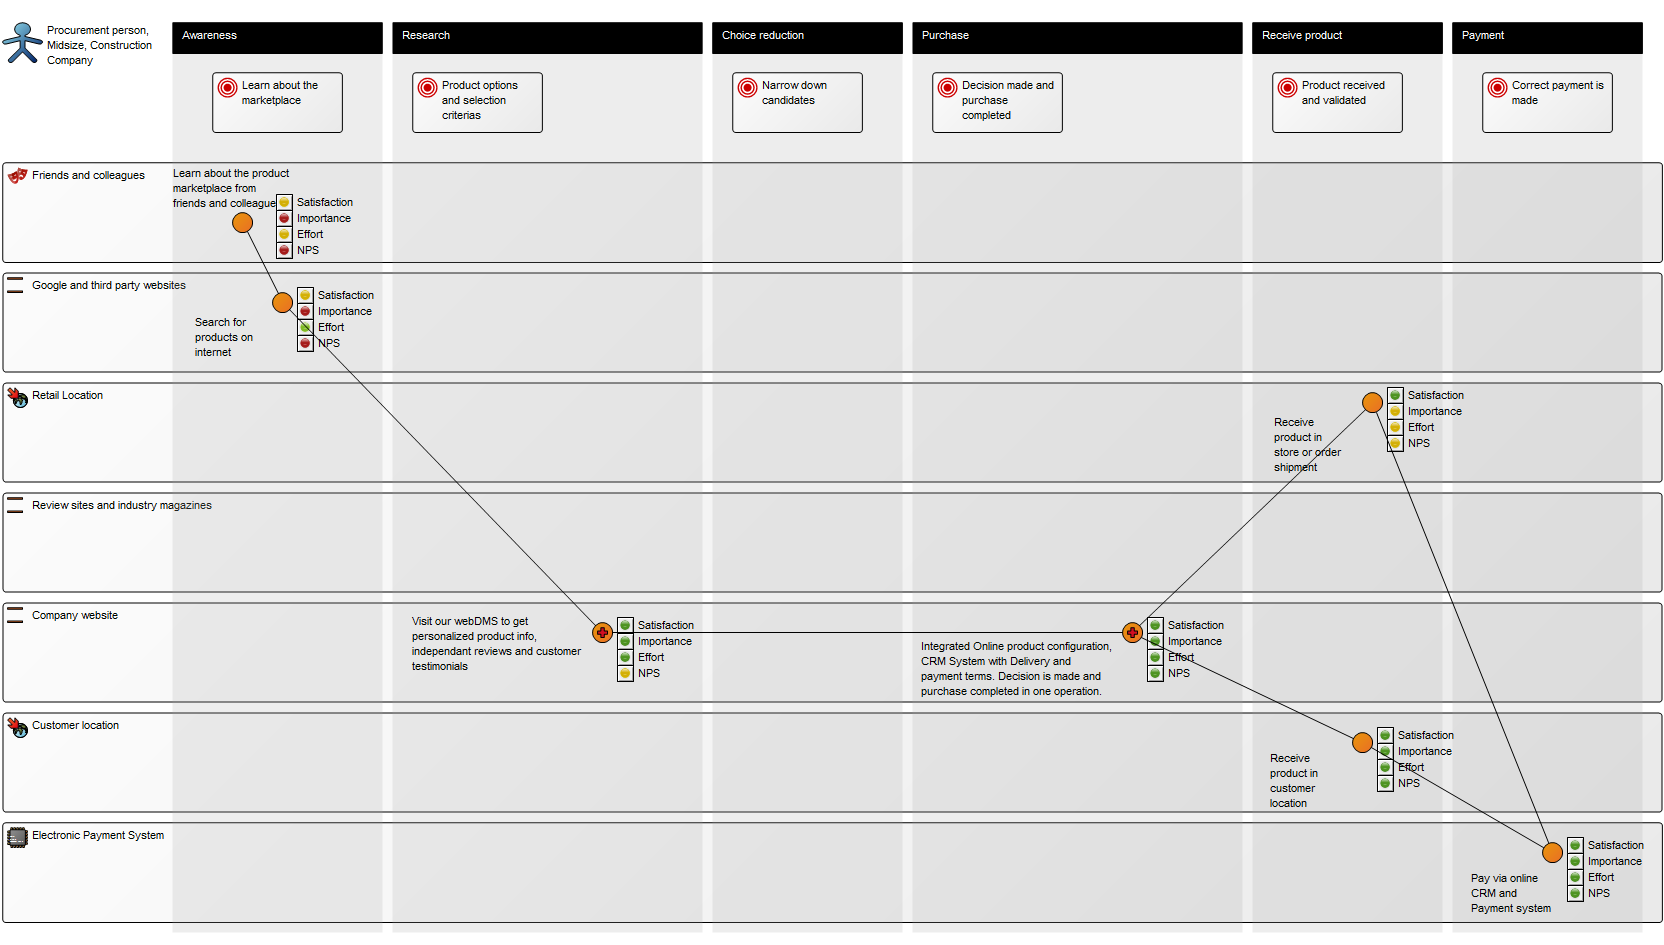
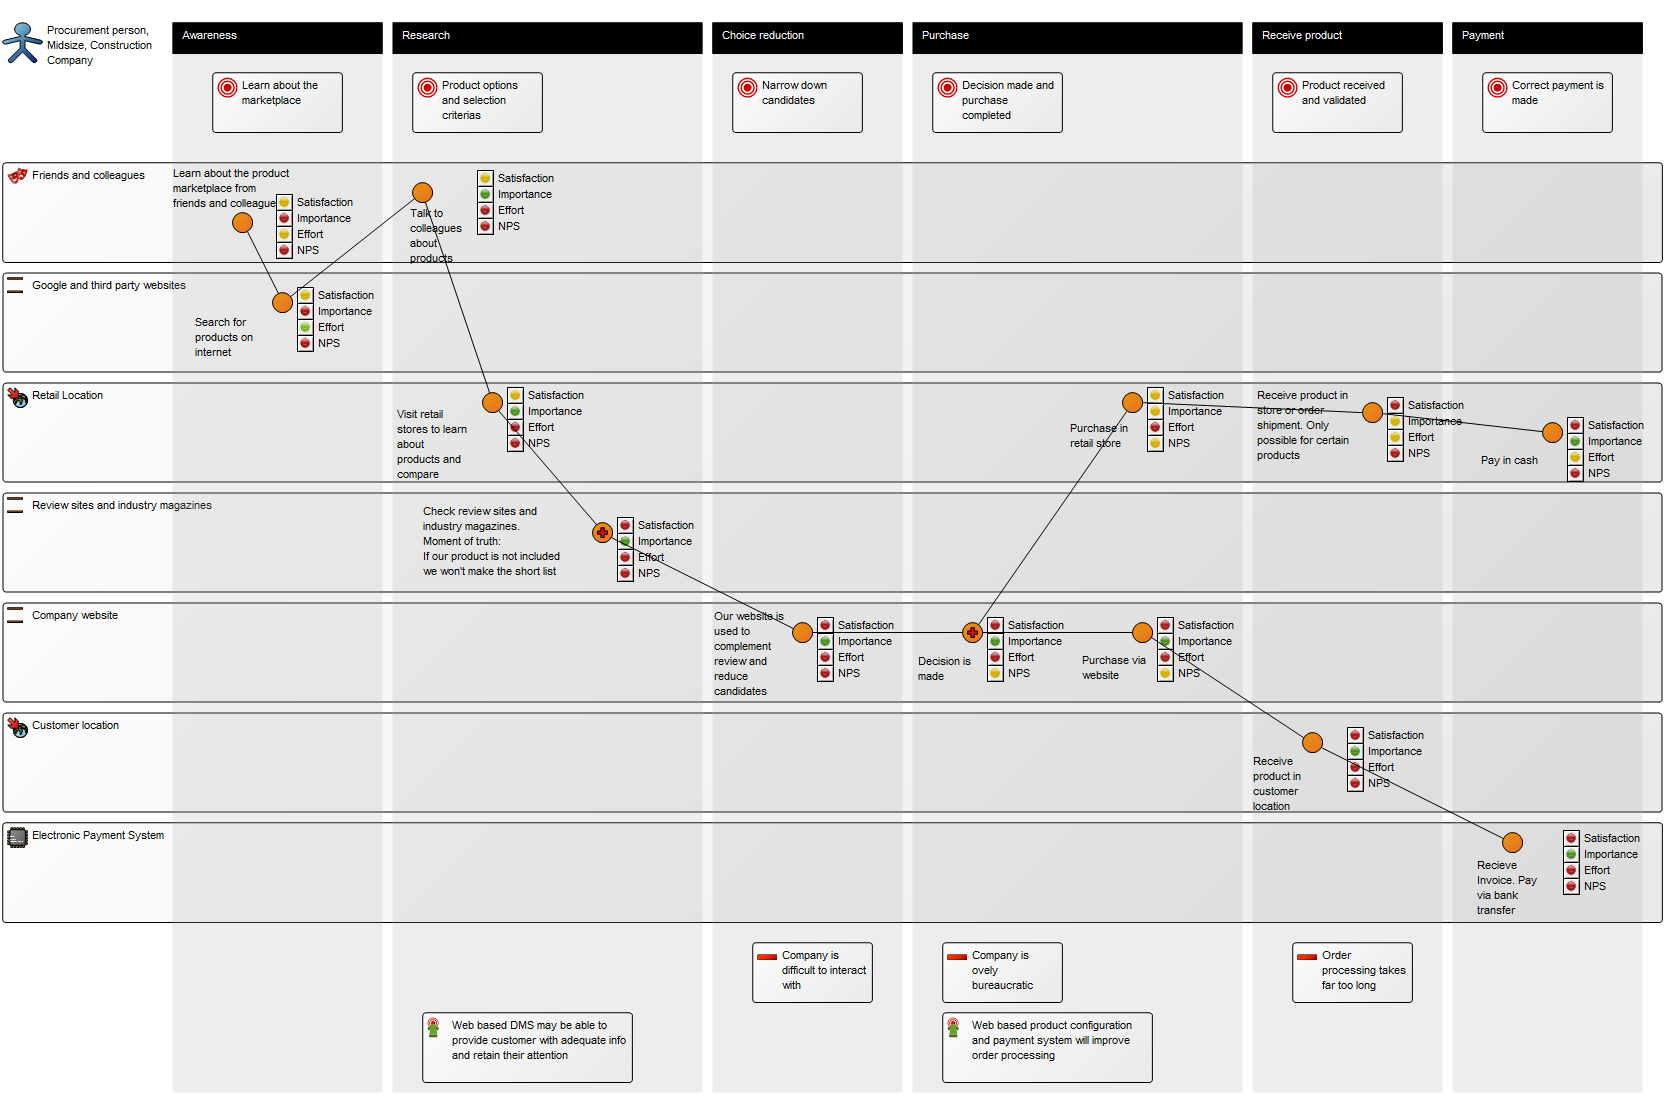
You can choose to model both a current state and a desired future state of the customer journey and use the documentation for process improvement. Below is an example of a current state model and a future state model:
Current state model:
Desired future model:
Other functionalities: The customer’s touchpoints can be elaborated upon with four scores for Customer Satisfaction, Customer Importance, Customer Effort and Net Promoter Score. Particularly vital touchpoints can be designated as a Moment of Truth.
Relation to other templates: The Customer Journey Map can be used as a groundwork for a strategic change, which for example can be modelled in a Work Model, a Business Capability Model and/or a Strategy Model.
Properties and metadata: The Customer Journey Map can for example retain the following information:
A description of the diagram
Link to the owner of the diagram
Link to the one responsible for the accuracy of the diagram
Audits (auto generated information regarding its current state and access rights)
Associated documents, diagrams and other objects
Inherent Risk detailing risk considerations
Governance information detailing information about the published diagram and who has been involved in the approval of the diagram
Project status: information about budgeted and actual man-hours spent, percentage completed and the latest milestone, result and quality control of a change process.
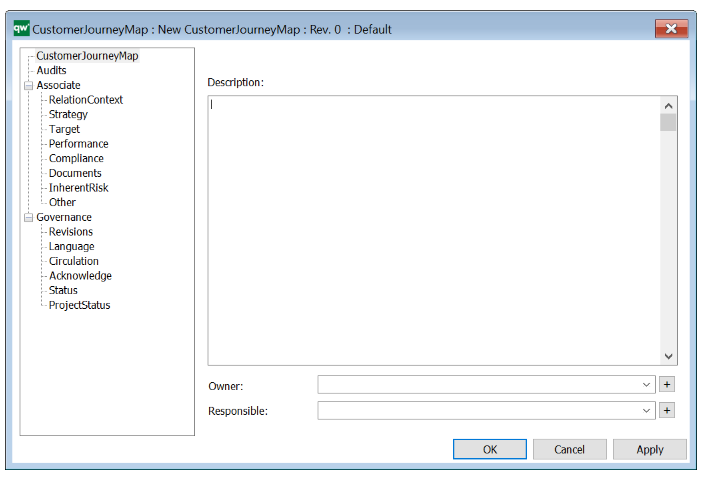
The above picture shows the properties dialogue window for the Customer Journey Map, where you can view and edit the diagram’s properties.
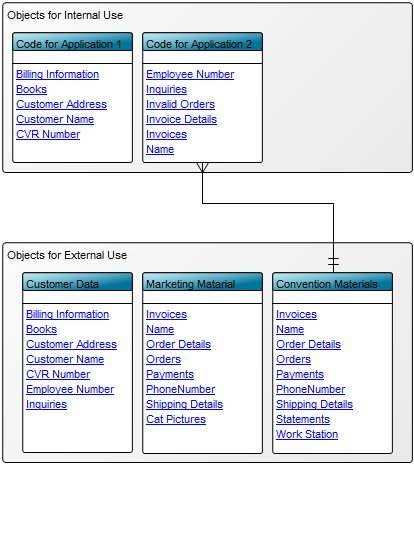
Purpose: The Conceptual Data Model template is used to describe a high-level business oriented structure of the information concept used in a specific business area. Below yo can se an example of a Conceptual Data Model where the data is divided into data for internal and external use:
Core concerns: The conceptual data model template enables you to model a preliminary high level data model. It may be abstract in content and sparse in attributes. Its preliminary structure allows for many-to-many relationships. When using the Conceptual Data Model, you can model Information Concepts, Subject Areas, and their interrelationships. Below, you can see a car rental service’s Conceptual Data Model for a customer’s data.
Relation to other templates: The conceptual data model is a means of communicating information structures between participants in a project or documenting the overall Information Concept of a specific organization. For a more detailed model you should use a Data Model Diagram.
Properties and metadata: The Conceptual Data Model can for example retain the following metadata:
A description of the diagram
Link to the owner of the diagram
Link to the one responsible for the accuracy of the diagram
Audits (auto generated information regarding its current state and access rights)
Associated documents, diagrams and other objects
Inherent Risk detailing risk considerations
Governance information detailing information about the published diagram and who has been involved in the approval of the diagram
Project status: information about budgeted and actual man-hours spent, percentage completed and the latest milestone, result and quality control of a change process.
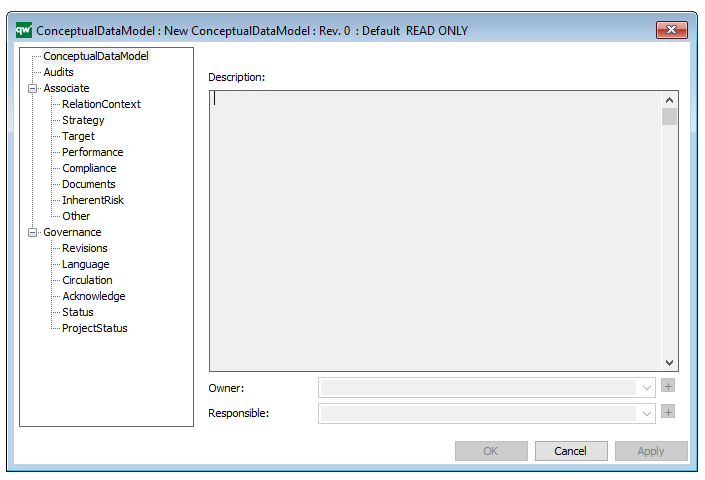
In the picture below you can see the Conceptual Data Model’s properties dialogue window, where the information can be viewed and edited:
Purpose: The primary objective of the Class Diagram template is to visually represent and document the structural components of a system utilizing the Unified Modeling Language (UML). Displayed below is an example of a straightforward Class Diagram:
Core concerns: The Class Diagram effectively captures the various classes within a system, their attributes, operations, and the relationships between classes and other objects, such as packages. This comprehensive representation enables a clear understanding of the system’s structure, promoting efficient communication among stakeholders and facilitating system design and maintenance.
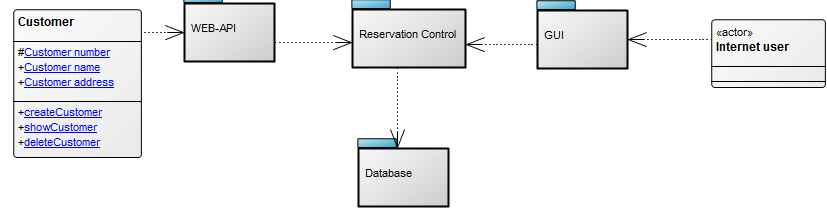
Example: In the Class Diagram below, the relationships between the classes “Customer” and “Internet User” and the packages “WEB-API”, “Reservation Control”, “GUI” (Graphical User Interface), and “Database” are illustrated. This example highlights the connections among different components and provides a visual overview of how they interact within the system:
Relation to other templates: The Class Diagram presents a detailed structural view of information. It can for example be a decomposition of an Information System which typically is presented in an Application Architecture Diagram. If a Class Diagram becomes too complex or large, a Package Diagram, where the classes are grouped into Packages, could be modelled instead.
Properties and metadata: The Class Diagram can for example retain the following information:
A description of the diagram
Link to the owner of the diagram
Link to the one responsible for the diagram
Audits (auto generated information regarding its current state and access rights)
Extensions regarding constraints and tagged values
Associated documents, diagrams and other objects
Inherent Risk detailing risk considerations
Governance information detailing information about the published diagram and who has been involved in the approval of the diagram
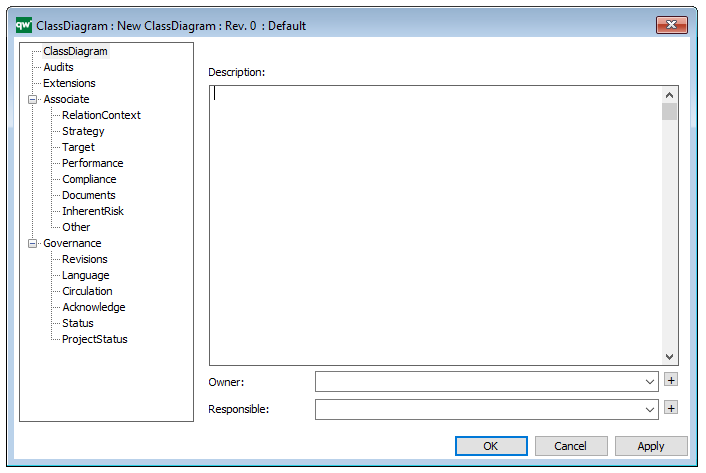
In the picture below you can see the Class Diagrams properties dialogue window, where the information can be viewed and edited:
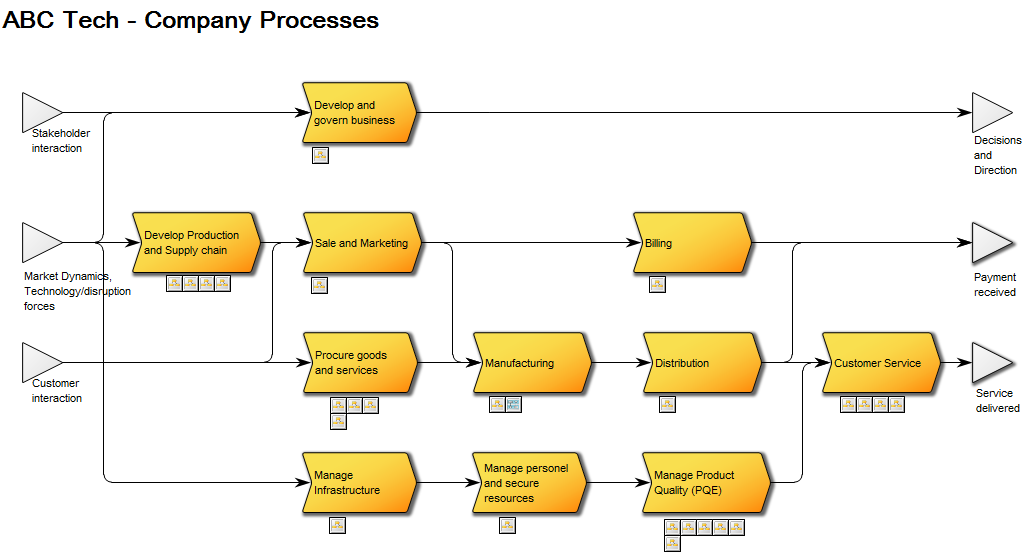
Purpose: The purpose of the Business Process Network is to at document a mid- to high-level view of Business Processes and their interrelationships.
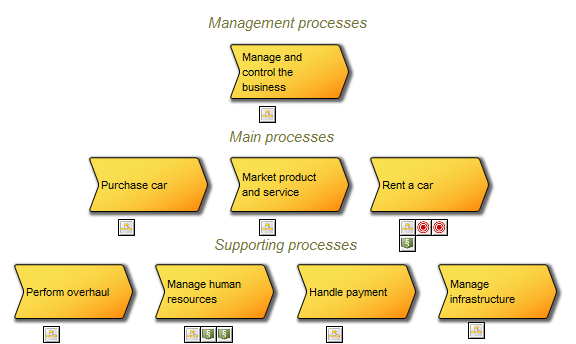
Core concerns: The Business Process Network template enables the documentation of top to mid-level processes. The core objects available to model with are Business Processes, Business Events, Business Objects, Business Scope, Information Systems, and different types of connections. Below you can see two examples of a Business Process Network modelled in different styles.
High level process view without business events or connections between processes:
High-level process view where business events and connections indicate a flow between processes, stakeholders and customers:
Relation to other templates: The top-level processes would typically be broken down to one or more levels of mid-level processes. The last level of Business Process Networks can then be broken down to several Workflow Diagrams or Business Process Diagrams detailing the activities contained within the business process
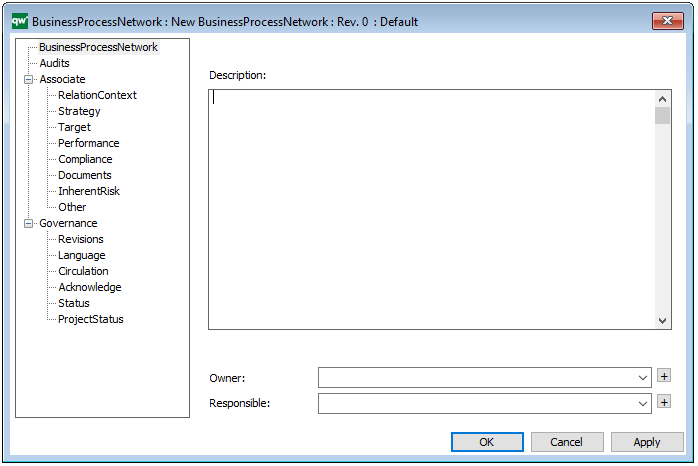
Properties and metadata: The Business Process Network can for example retain the following information:
Description of the diagram
Link to the owner of the diagram
Link to the one responsible for executing the processes in the diagram
Audits (auto generated information regarding its current state and access rights)
Associated documents, diagrams and other objects
Inherent Risk detailing risk considerations
Governance information detailing information about the published diagram and who has been involved in the approval of the diagram
In the picture below you can see the Business Process Network’s properties dialogue window, where the diagrams properties can be viewed and edited:
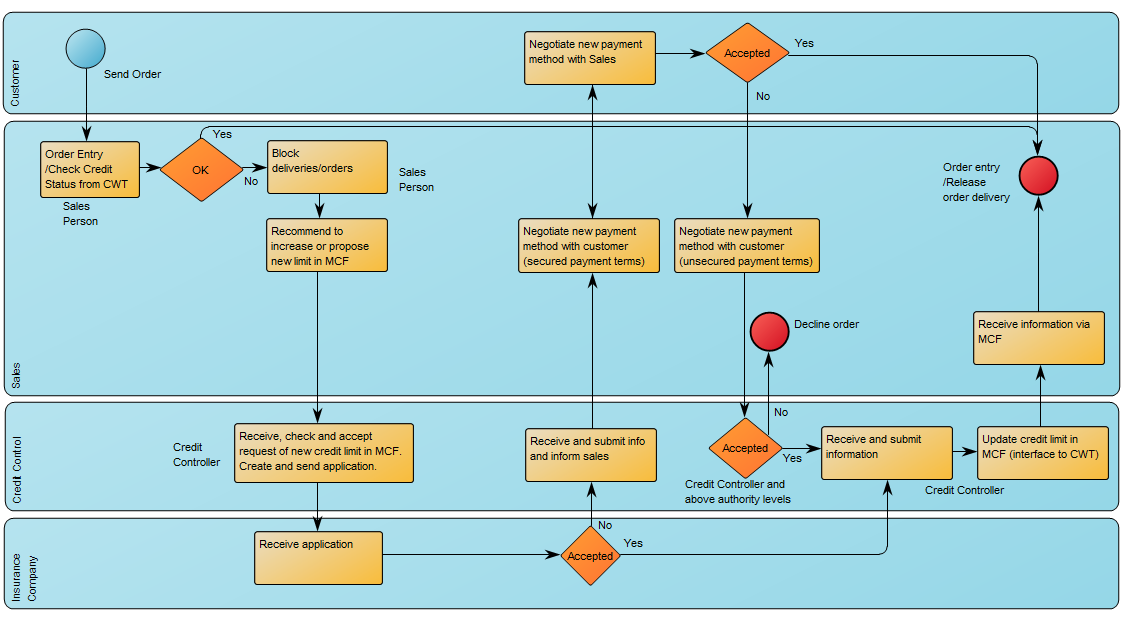
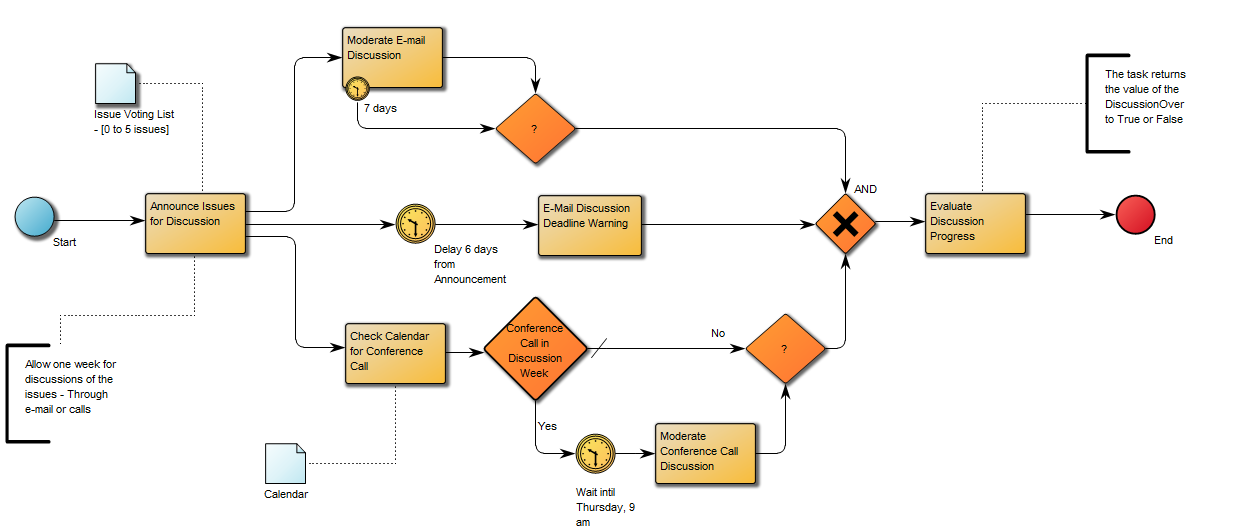
Purpose: The purpose of the Business Process Diagram template is to enable workflow modelling using the industry standard BPMN (Business Process Modeling Notation).
Core concerns: The Business Process Diagram template supply you with the BPMN icons that enable you to draw a workflow diagram. These icons include different types of events, activities, gateways, connectors, as well as pools, lanes and artifacts such as data objects and messages. The Business Process Diagram is typically used to illustrate business processes and software processes used in requirement documentation. Below is an example of a classic BPMN diagram with swimlanes:
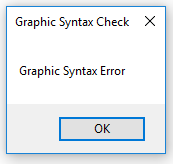
To ensure the right BPMN syntax, the Business Process Diagram template will continuously perform Graphic Syntax Checks while you model. When a graphic syntax error occurs, you will be met with an error message like the one shown below:
Other functionalities: The Business Process Diagram can enable the execution and automation of a process when the diagram is converted into XML type files.
If you don’t wish to have a visible pool in your diagram, you can choose to have a ‘default pool’ that doesn’t have to be graphically represented. You can see an example of a diagram without pool and lanes below:
Relation to other templates: The Business Process Diagram template is exclusively aimed at modeling using the BPMN standard. If the BPMN is not chosen as a mandatory standard, the WorkFlow Diagram template, which has fewer syntax limitations, can be used instead.
The Business Process Diagram is typically linked as a decomposition of a Business Process contained in a Business Process Network template.
Properties and metadata: The Business Process Diagram can for example retain the following information:
Description of the diagram
Expression and query language
Link to the owner of the process
Link to the one responsible for executing the process
Audits (auto generated information regarding its current state and access rights)
Associated documents, diagrams and other objects
Inherent Risk detailing risk considerations
Governance information detailing information about the published diagram and who has been involved in the approval of the diagram
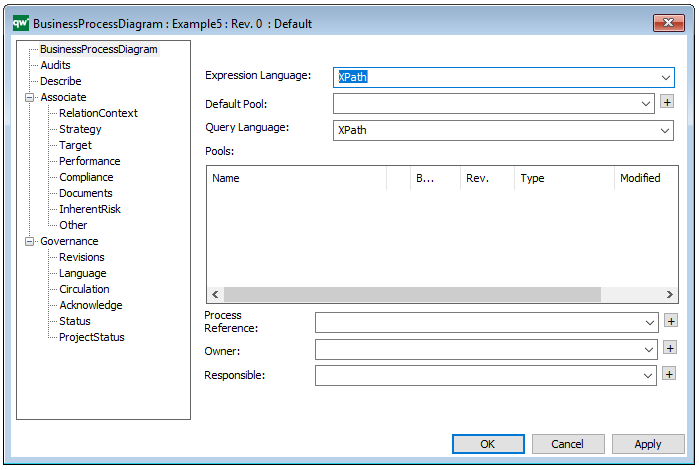
In the picture above you can see the Business Process Diagram’s properties dialogue window, where the diagram’s properties can be viewed and edited:
Purpose: The purpose of the Business Ecosystem template is to enable an organization to understand itself from an outside-out perspective by modelling the environment in which the organization is embedded.
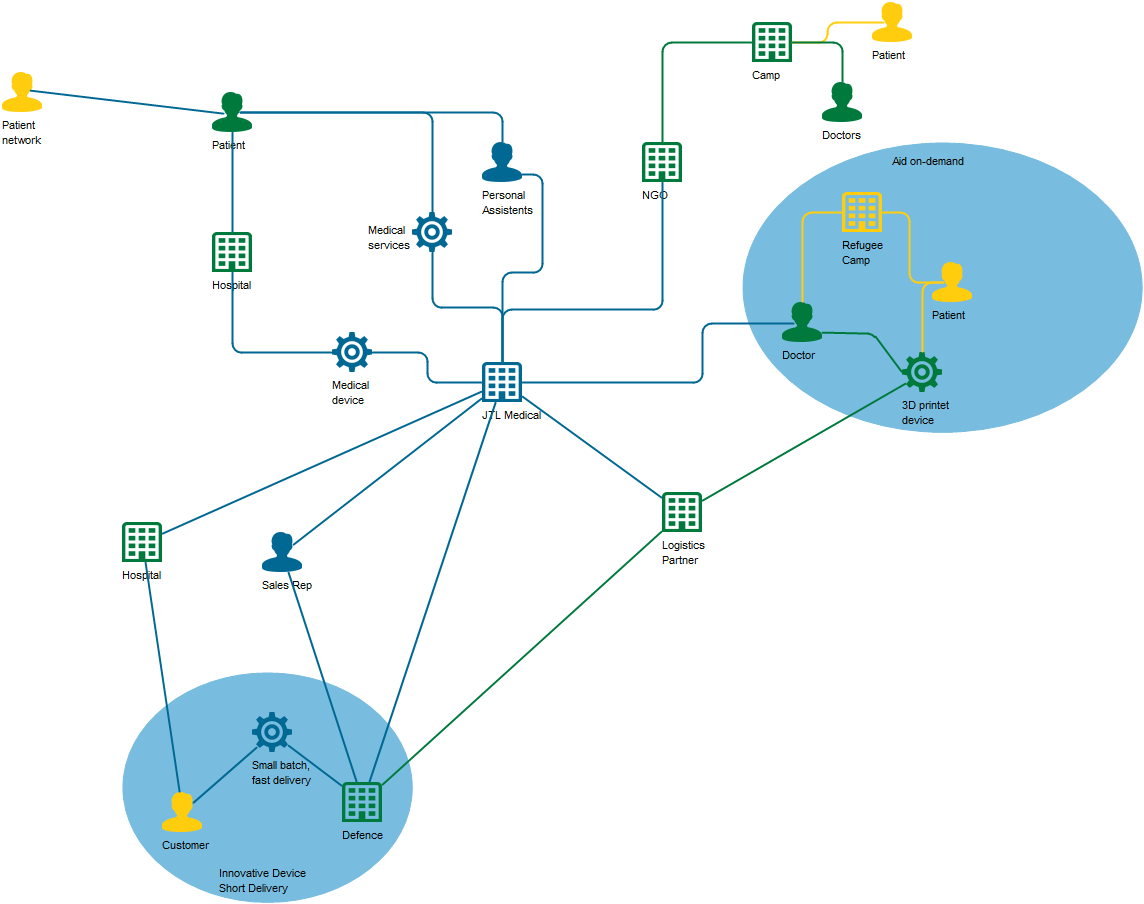
Core concerns: The Business Ecosystem supplies five elements to model with: Business, People, Things, Business Interaction and Business Moment. The Business Ecosystem template should primarily be used for modeling entities outside the enterprise to identify new business opportunities in the form of Business Moments.
Above you can see a model of a Business Ecosystem. The blue areas are Business Moments, where the interactions between People, Businesses and Things create business opportunities for your enterprise.
Relation to other templates: The Business Ecosystem model is based on the Enterprise Design theories and is as such in the same family as the Customer journey map.
Properties and metadata: The Business Ecosystem can for example retain the following information:
A description of the diagram
Link to the owner of the application architecture
Link to the one responsible for the application architecture
Audits (auto generated information regarding its current state and access rights)
Associated documents, diagrams and other objects
Inherent Risk detailing risk considerations
Governance information detailing information about the published diagram and who has been involved in the approval of the diagram
Project status: information about budgeted and actual man-hours spent, percentage completed and the latest milestone, result and quality control of a change process.
For more information: If you want to learn more about Enterprise Design, we have a four-part webinar by Milan Guenther available for viewing. You can also visit Milan’s website, where you can learn more about the Enterprise Design framework.
Purpose: The purpose of the Business Capability Model template is to provide an overview of the of the state and health of an enterprise in the form of its Capabilities.
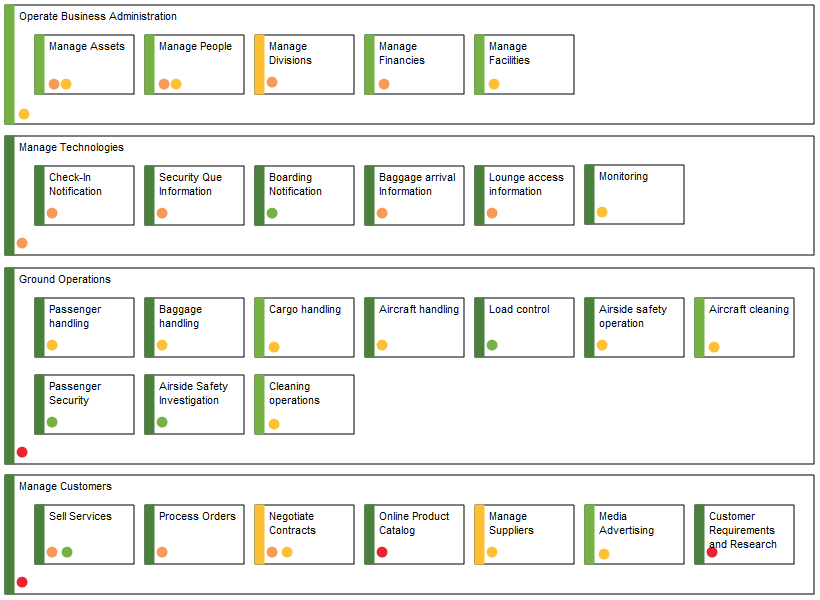
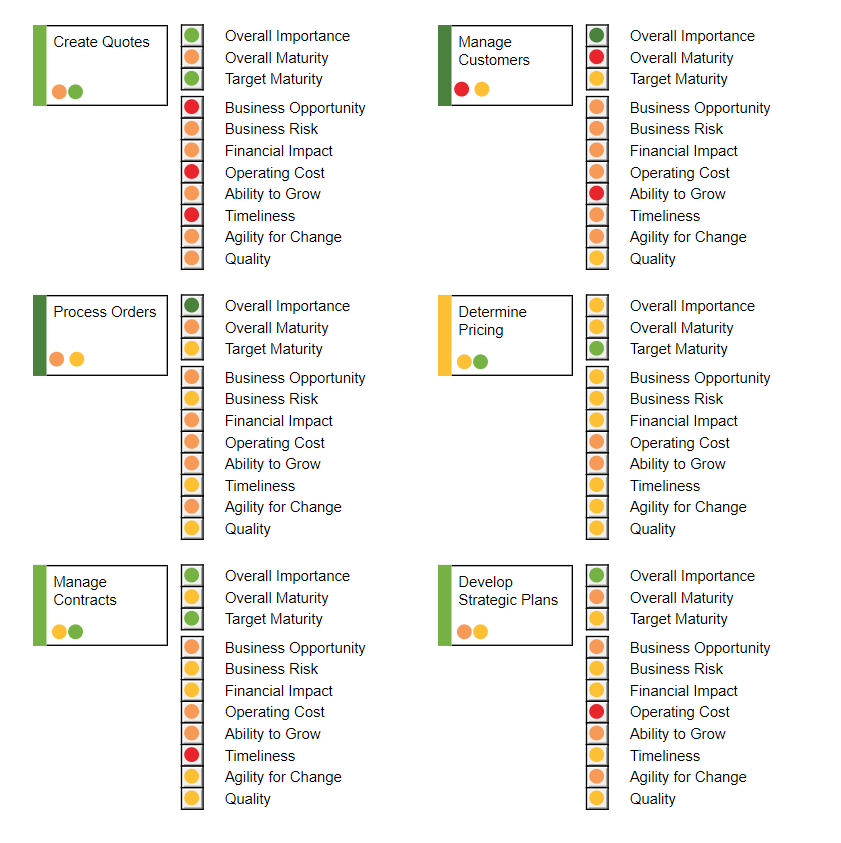
Core concerns: The Business Capability Model is a simple template that by default only allows for the modelling of Capabilities with the possibility to add notes if needed. The metadata of the Capabilities – such as status and importance can then be graphically displayed in the business capabilities to create a useful overview.
The stripe on the left side to represent Business Importance and two dots representing Business Maturity and Target Maturity. The new design scales better and provides management with a single view of important strategic capabilities with a plan for improvements. Also it allows the business architect to highlight a set of capabilities by coloring the symbol’s background – a widely used technique.
Business Capability model with new symbol design
In the picture above you can see an example of a Business Capability Model. Here the Business Capabilities are grouped in different areas and the status and importance of them are shown by their green, yellow or red colorings.
In this Business Capability Model (shown above), more attributes are shown at the right-hand side of the Capability. This way you can get a more detailed view of the state of your enterprises Capabilities.
Other functionalities: Using the Analysis tool, the information from the Business Capability Model template can generate maturity- and score heat maps, hierarchies, score views, capability contexts, gap analyses, dashboards, and what-if-, impact- and investment analyses.
Relation to other templates: The Business Capability Model is a strategic template and is as such complimentary to for example the Strategy Model and Work Model. It can be used to illustrate a change process going from one set of capabilities to another. A Capability can link to the Business Processes that uses it as well as the resources it employs. This way it can also be analyzed which Business Processes would be affected by the improvement or worsen of a given Capability.
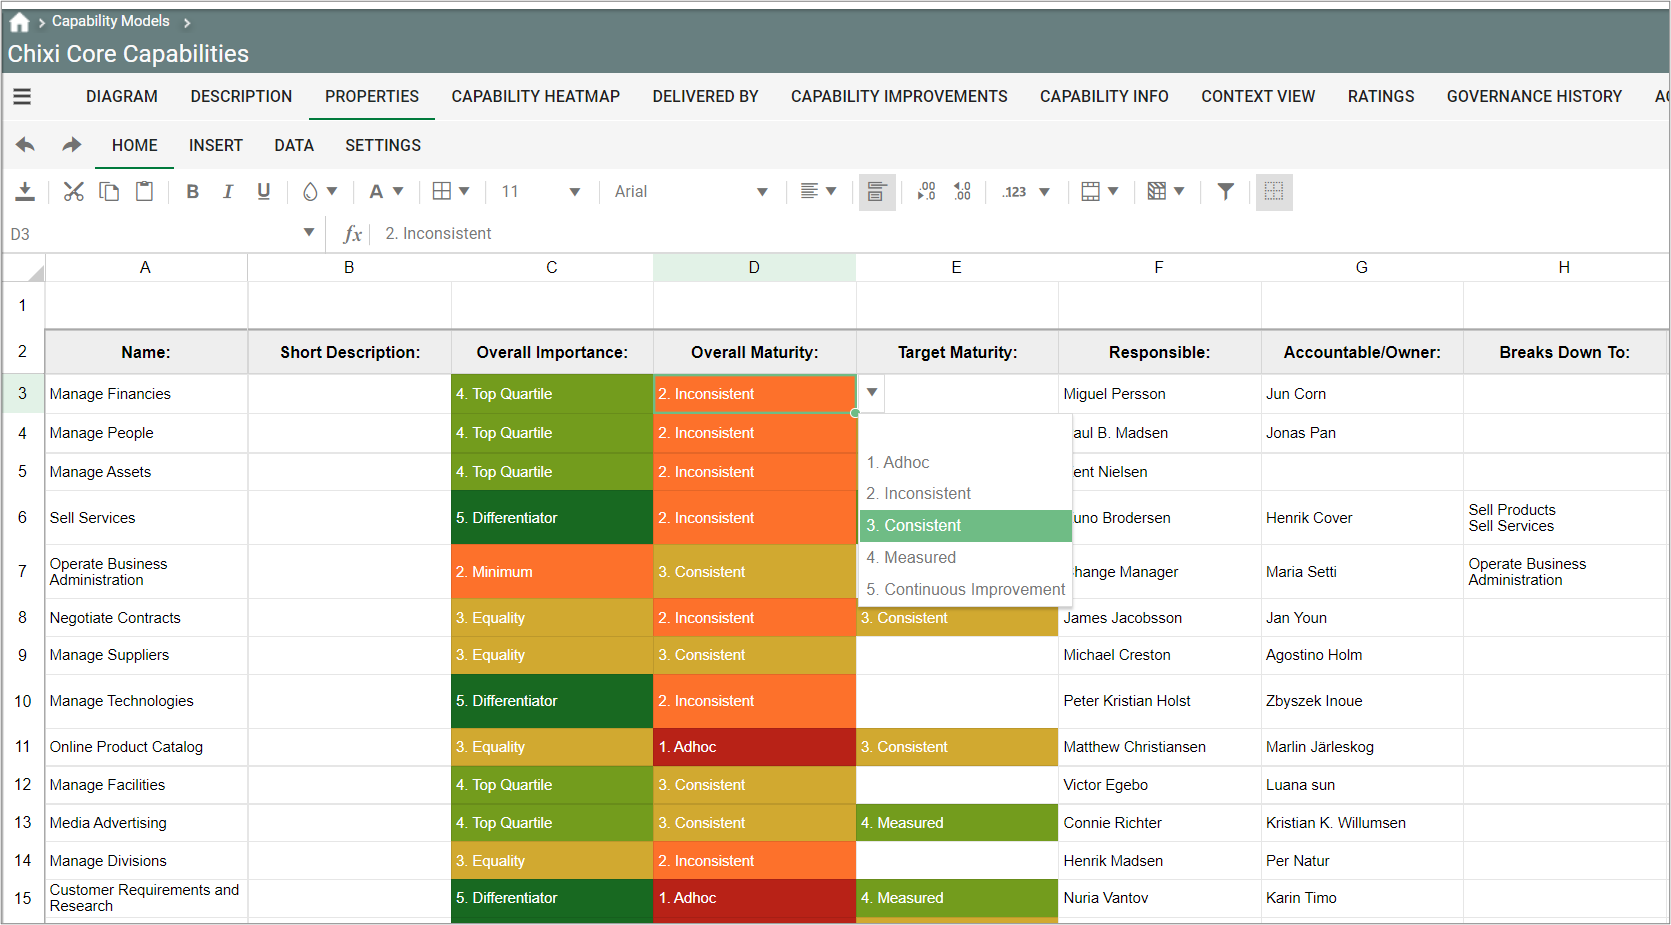
It is easy to update and analyse the capability models via the standard views on the web:
The capabilities in a Business Capability Model can easily be scored and presented in filterable and editable lists via the spreadsheet functionality in e.g. the Properties view
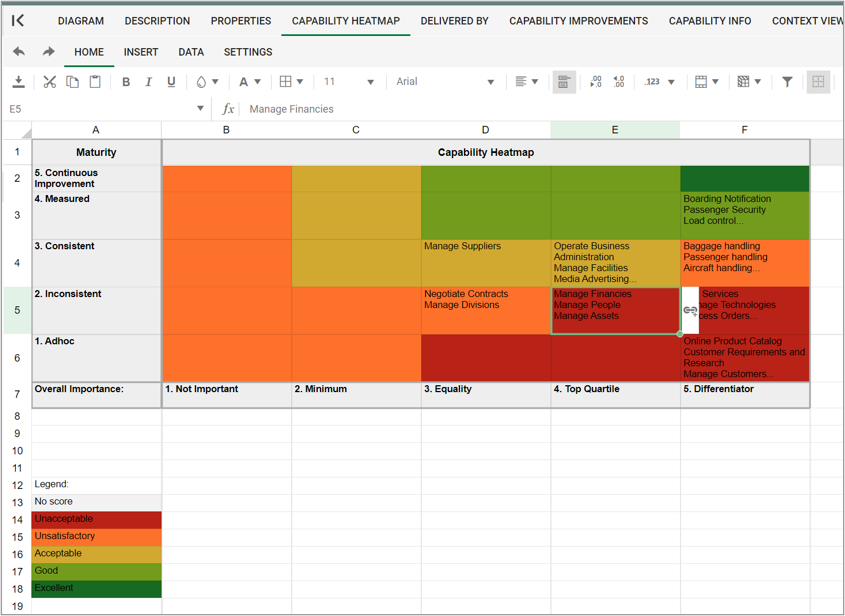
The capabilities can be presented in a Capability heatmap
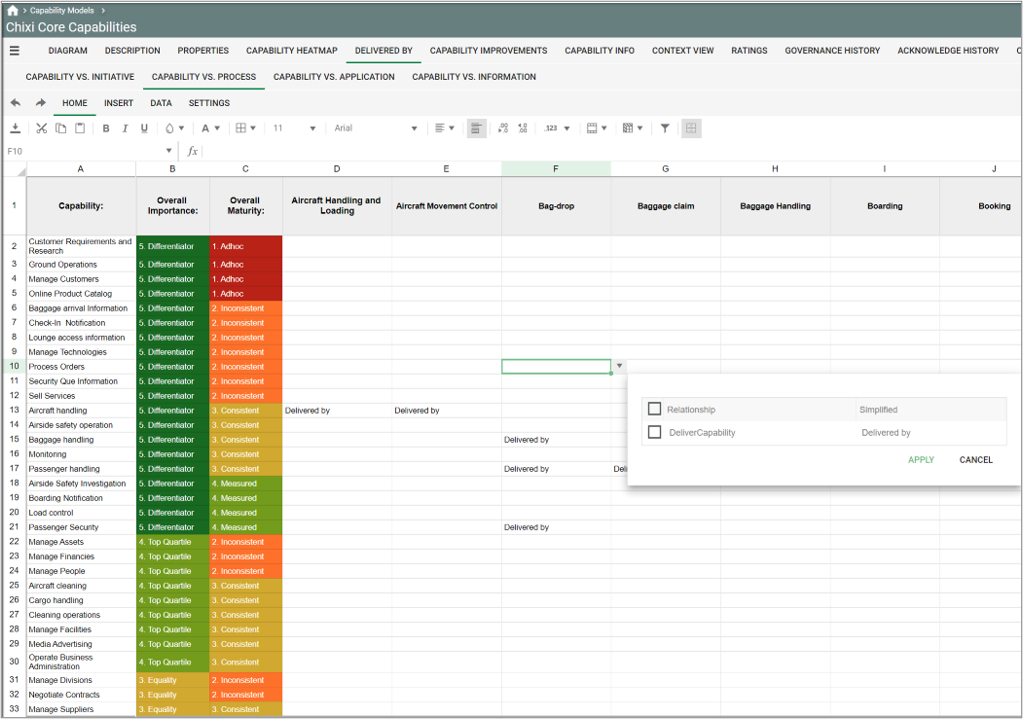
From the Delivered by view you can analyze and update relations between capabilities and initiatives, processes, applications and information-objects.
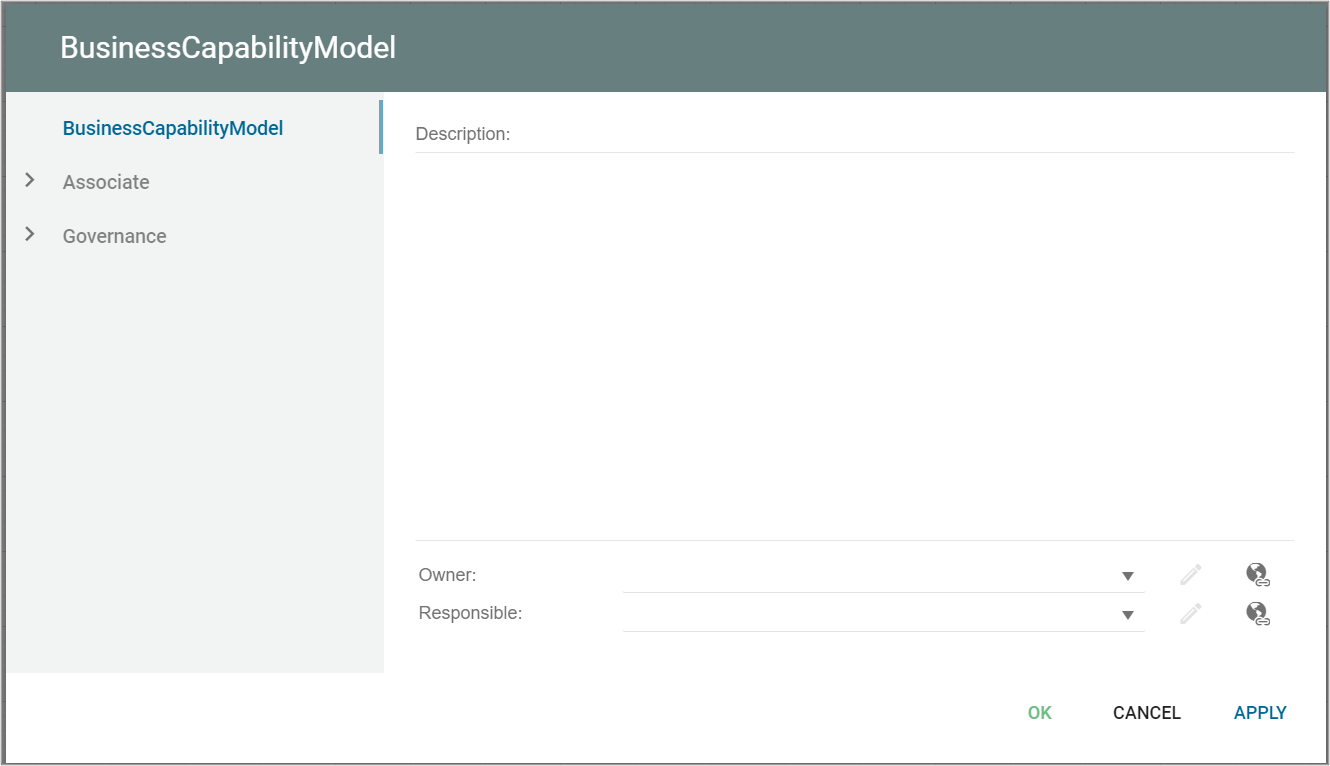
Properties and metadata: The Business Capability Model can for example retain the following information:
A description of the diagram
Link to the owner of the diagram
Link to the one responsible for the accuracy of the diagram
Associated documents, diagrams and other objects
Inherent Risk detailing risk considerations
Governance information detailing information about the published diagram and who has been involved in the approval of the diagram
Project status: information about budgeted and actual man-hours spent, percentage completed and the latest milestone, result and quality control of a change process.
The above picture shows the properties dialogue window for the Business Capability Model where you can edit the diagram’s properties.
Note that the Capabilities’ metadata that are exhibited in the Business Capability Model is not further described here as they belong to the Capability object and not the Business Capability Model template.
Purpose: The Business Canvas, is a strategic management and entrepreneurial template. It allows you to describe, design, challenge, invent, and pivot your business model.
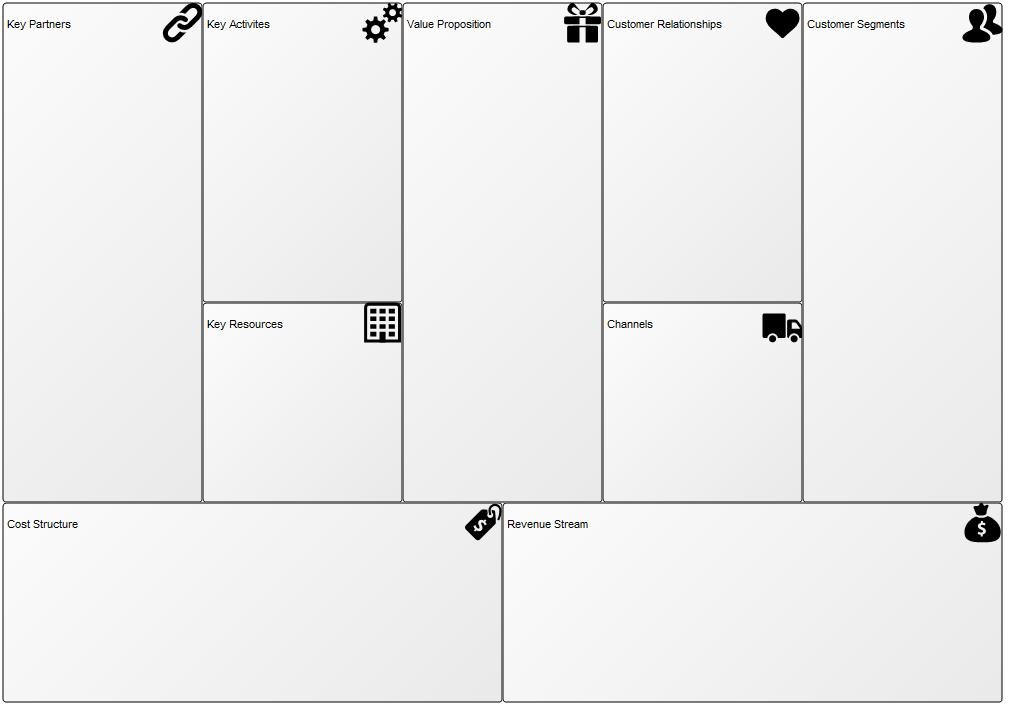
Core Concerns: The core elements of the business canvas are framework cells that define a strategic or organizational entities and, if needed, connections between them. The Business Model can be structured any way you wish. The most well know structure of a business model is Alexander Osterwalder’s Business Model Canvas.
The above picture shows a blank Business Model Canvas where each area is represented by a framework cell.
The strategic or organizational entities can then be enriched with an extended portfolio of strategic symbols such as vision, mission, goals, stakeholders, information systems and business processes.
Full content list of the extended portfolio:
Vision
Mission
Business Object
Market
Competitive Advantage
Technology
Competence
Capability
Performance Indicator
Business Function
Business Process
Organization Unit
Stakeholder
Information System
External Entity
Location
Channel
Goal
Opportunity
Threat
Trend
Material Asset
Intellectual Capital Asset
Business Rule
Key Performance Indicator
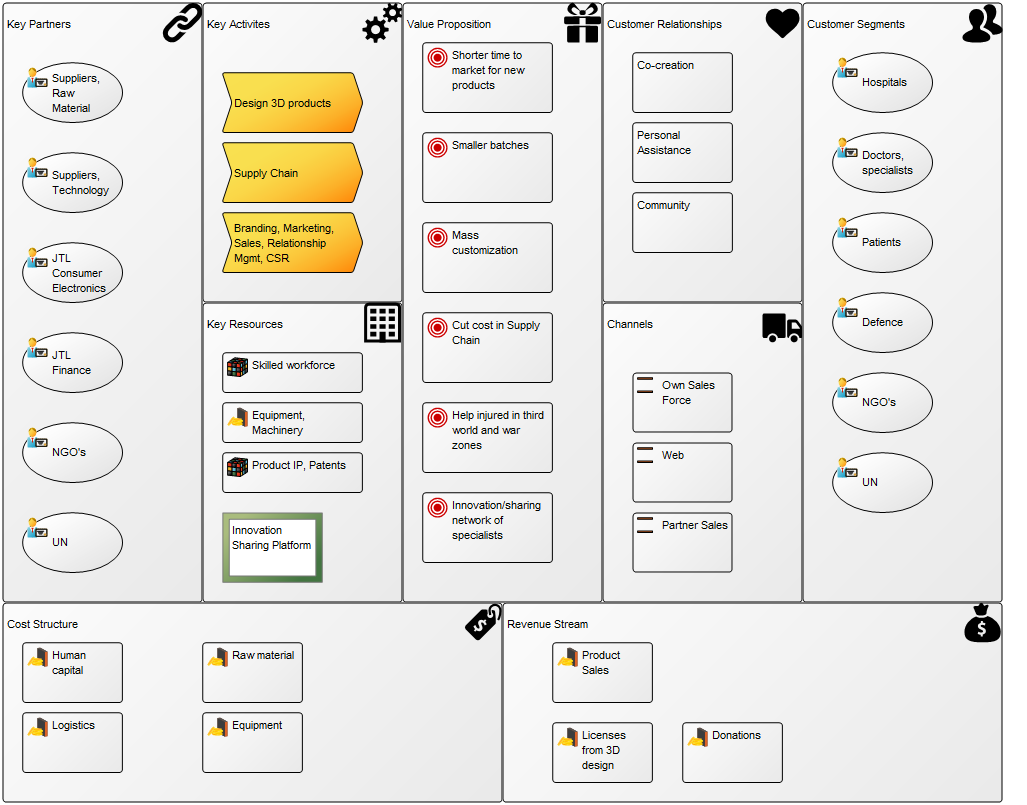
The picture below shows a Business Model Canvas that is filled out with symbols from the extended portfolio.
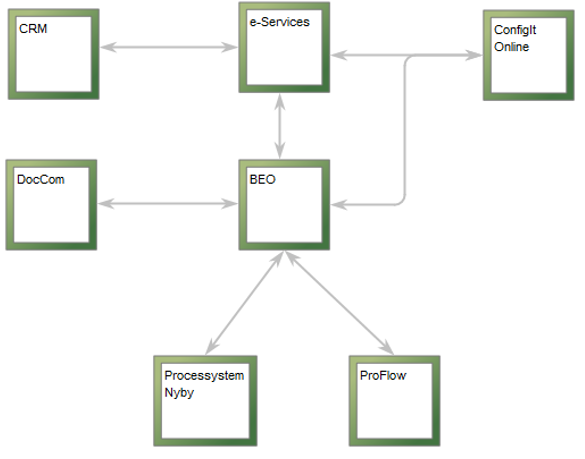
Purpose: The purpose of an Application Architecture Diagram is to show the structure of an Information System and its relations to other Information Systems.
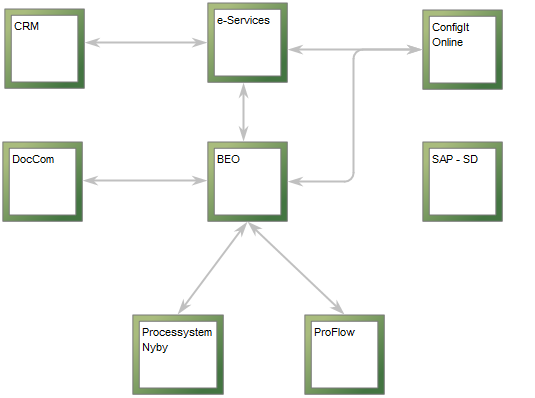
Core concerns: The Application Architecture Diagram is used to document the application/systems layer. It can show information flows and system dependencies between Information Systems as well as depict system components and system areas.
The above picture shows an example of an Application Architecture Diagram depicting an overview of the Information Systems related to BEO. The information systems are connected by arrows that symbolize system dependencies.
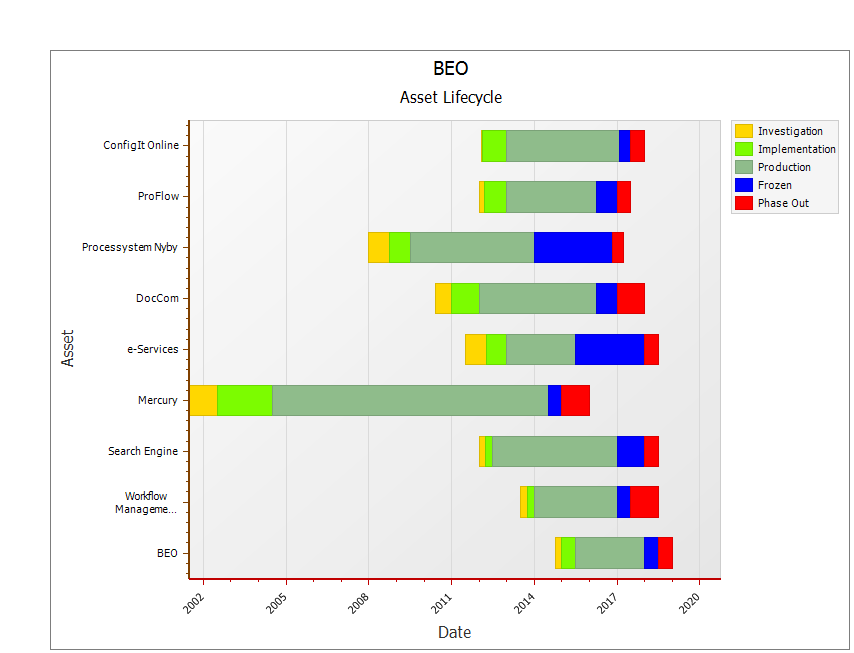
Other functionalities: Application Architecture Diagrams can be analyzed in QualiWare via the toolbar for Application Portfolio Management. The Application Portfolio Management tools offers analysis for redundant functionalities, performance matrix generation, system heat map generation, asset lifecycle view (se below picture), lifecycle dependencies, and capabilities delivered by multiple information systems.
The above picture shows the Asset Lifecycle of the Information System ‘BEO’ and the Information Systems related to it is shown. The information depicted is pulled from the Information Systems’ metadata.
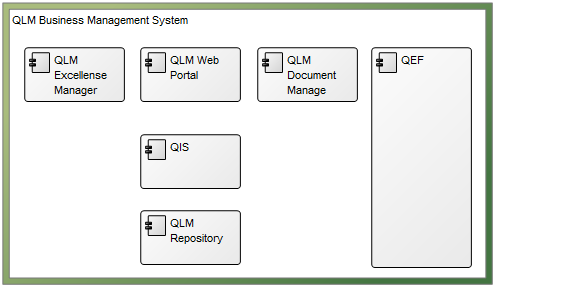
Relation to other templates: The elements depicted in the Application Architecture Diagram can be described in further detail in another Application Architecture Diagram, or in related diagrams such as a Data Flow Diagram.
The above picture shows an example of a more detailed view of an information system. In this Application Architecture Diagram the System Components are visible.
For documentation of a physical or hardware layer, the Infrastructure Diagram template can be used.
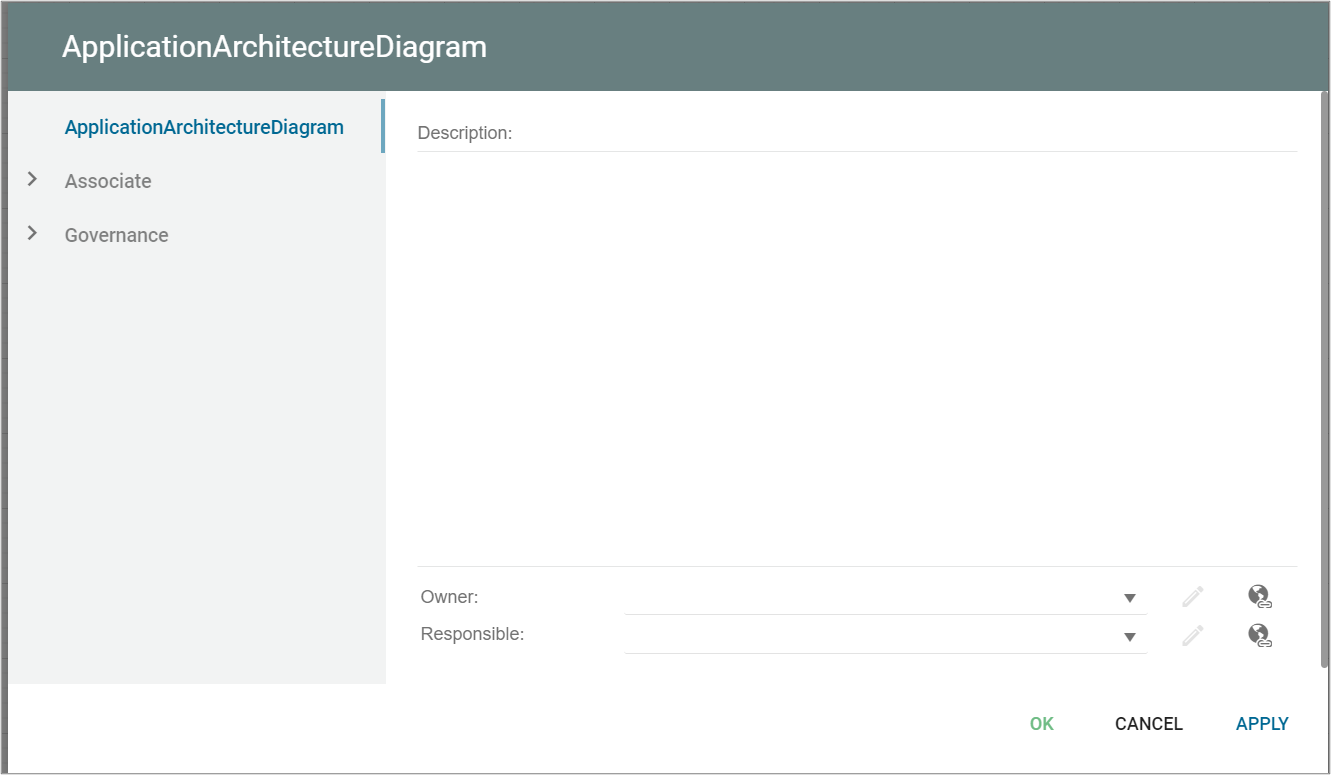
Properties and metadata: The Application Architecture Diagram can for example retain the following information:
A description of the diagram
Link to the owner of the application architecture
Link to the one responsible for the application architecture
Associated documents, diagrams and other objects
Inherent Risk detailing risk considerations
Governance information detailing information about the published diagram and who has been involved in the approval of the diagram
The above picture shows the properties dialogue window for the Application Architecture Diagram where you can view and edit the diagram’s properties.