Business Capability Model

Business Capability model with new symbol design

Purpose: The purpose of the Business Capability Model template is to provide an overview of the of the state and health of an enterprise in the form of its Capabilities.

Core concerns: The Business Capability Model is a simple template that by default only allows for the modelling of Capabilities with the possibility to add notes if needed. The metadata of the Capabilities – such as status and importance can then be graphically displayed in the business capabilities to create a useful overview.

The stripe on the left side to represent Business Importance and two dots representing Business Maturity and Target Maturity. The new design scales better and provides management with a single view of important strategic capabilities with a plan for improvements. Also it allows the business architect to highlight a set of capabilities by coloring the symbol’s background – a widely used technique.

Business Capability model with new symbol design

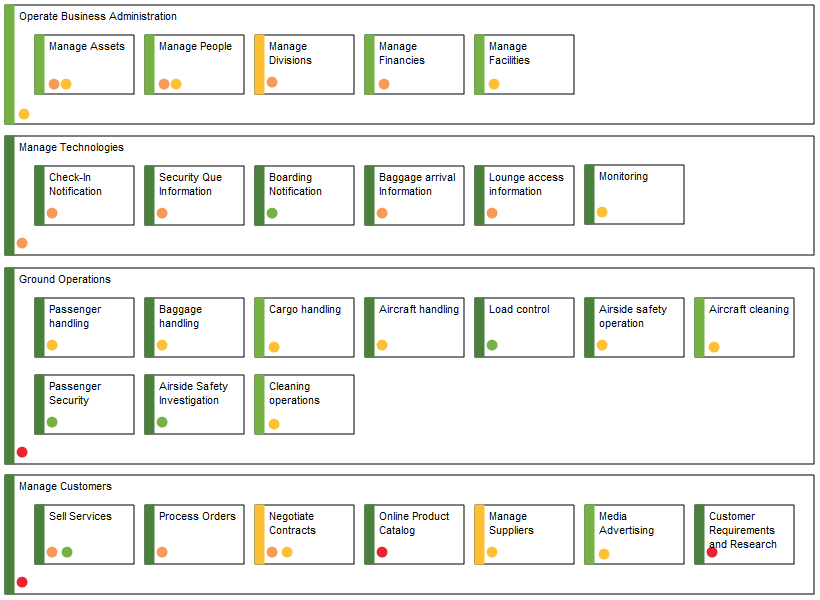
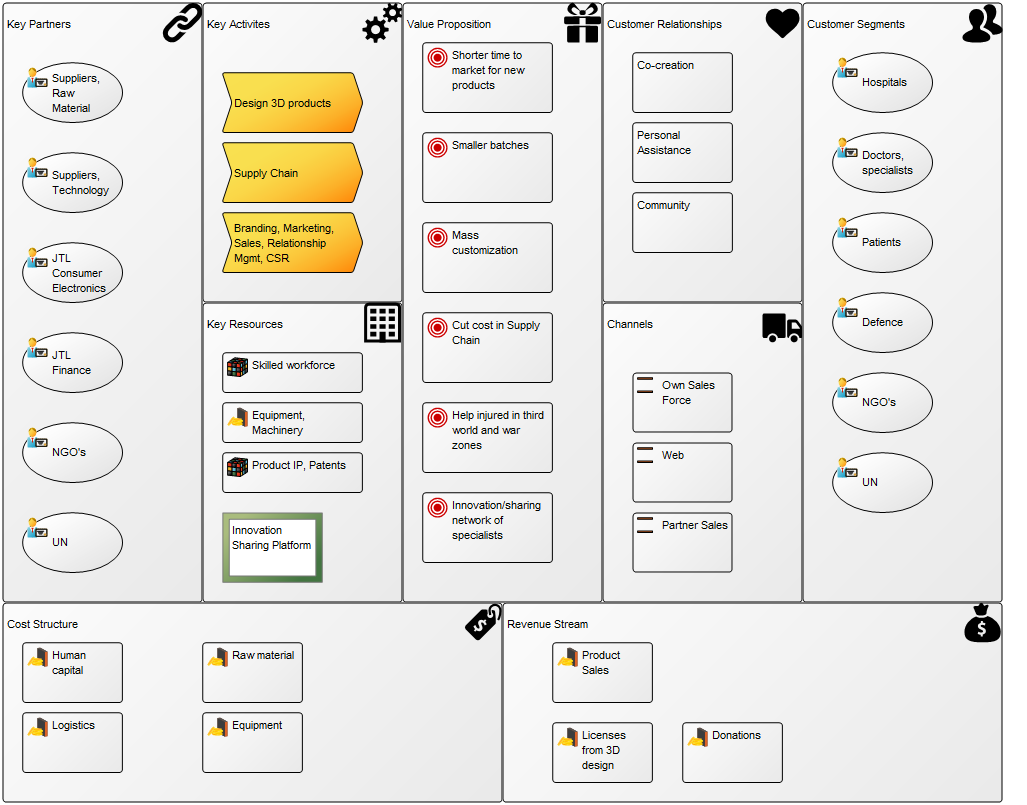
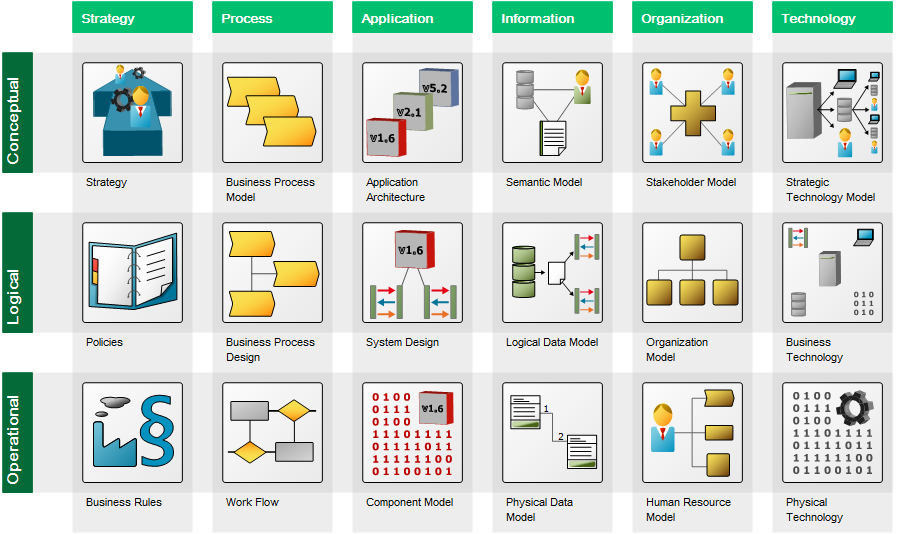
In the picture above you can see an example of a Business Capability Model. Here the Business Capabilities are grouped in different areas and the status and importance of them are shown by their green, yellow or red colorings.

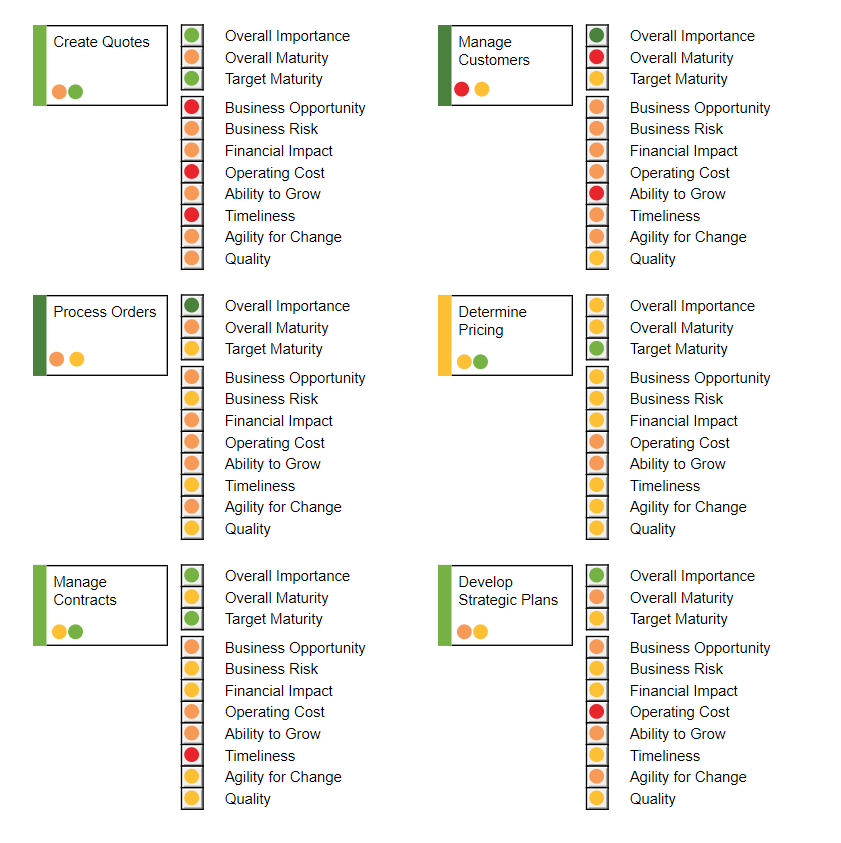
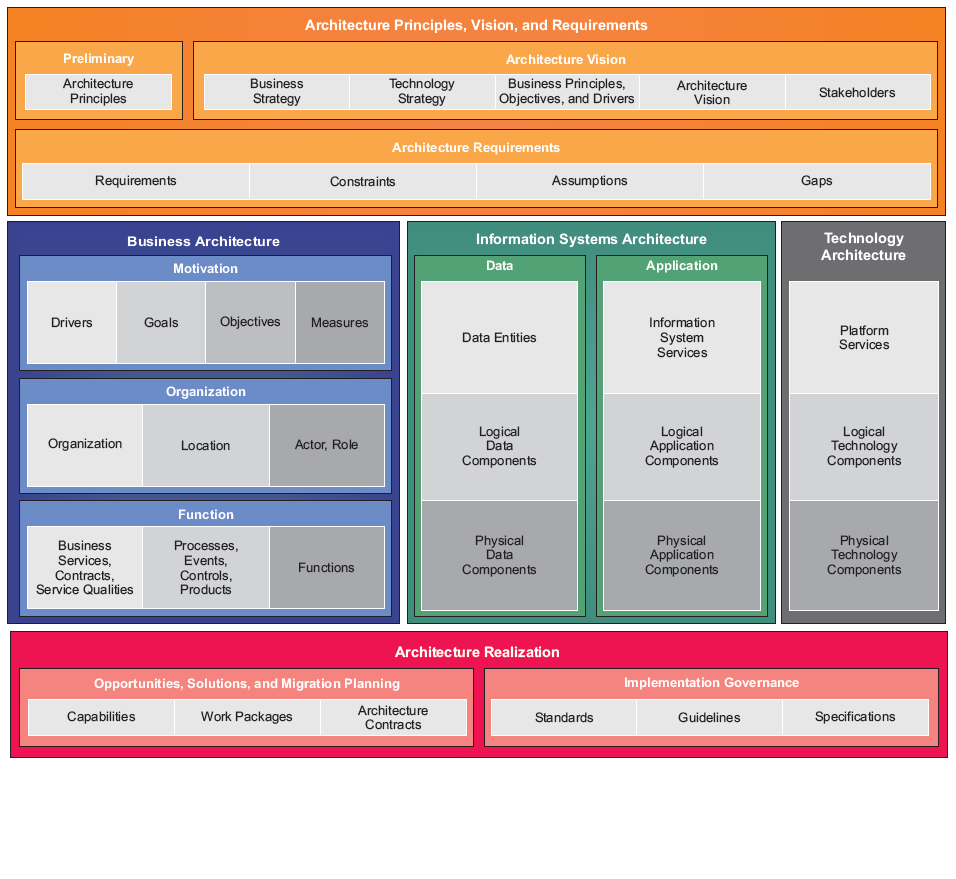
In this Business Capability Model (shown above), more attributes are shown at the right-hand side of the Capability. This way you can get a more detailed view of the state of your enterprises Capabilities.

Other functionalities: Using the Analysis tool, the information from the Business Capability Model template can generate maturity- and score heat maps, hierarchies, score views, capability contexts, gap analyses, dashboards, and what-if-, impact- and investment analyses.

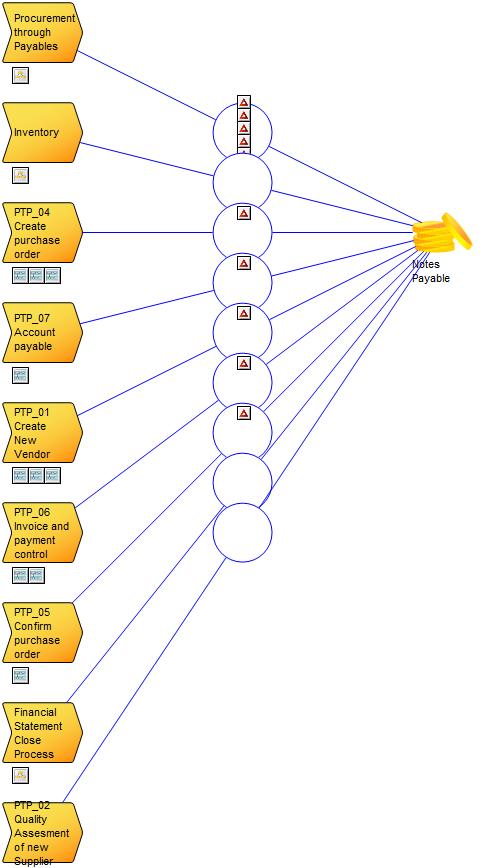
Relation to other templates: The Business Capability Model is a strategic template and is as such complimentary to for example the Strategy Model and Work Model. It can be used to illustrate a change process going from one set of capabilities to another. A Capability can link to the Business Processes that uses it as well as the resources it employs. This way it can also be analyzed which Business Processes would be affected by the improvement or worsen of a given Capability.

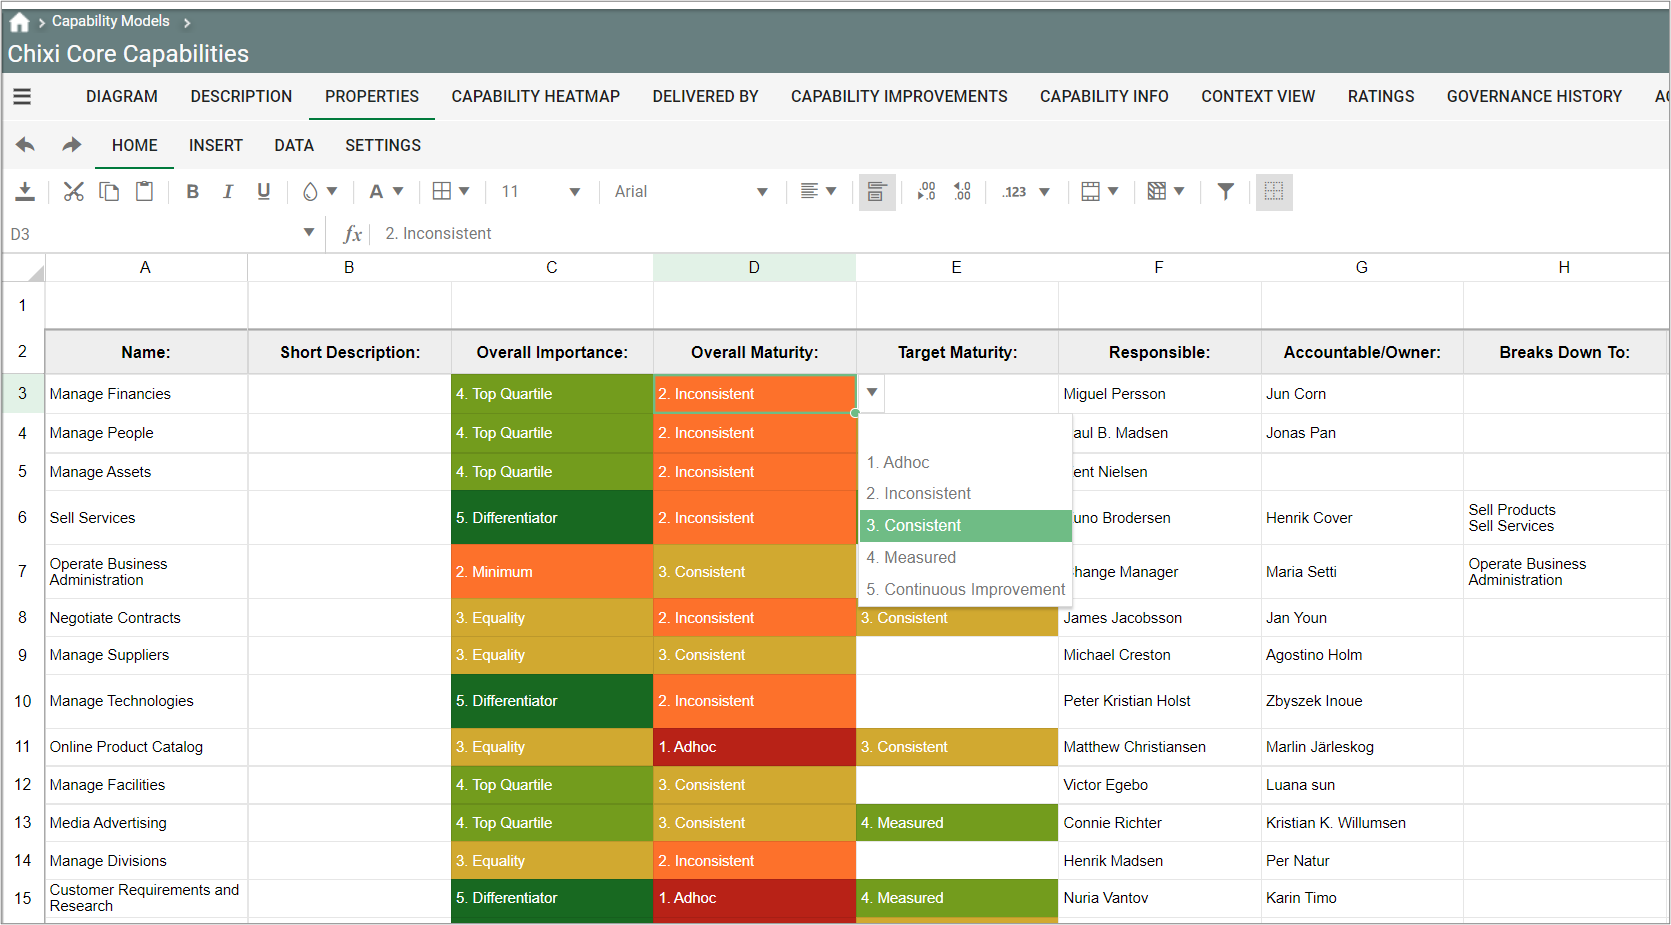
It is easy to update and analyse the capability models via the standard views on the web:

  • The capabilities in a Business Capability Model can easily be scored and presented in filterable and editable lists via the spreadsheet functionality in e.g. the Properties view

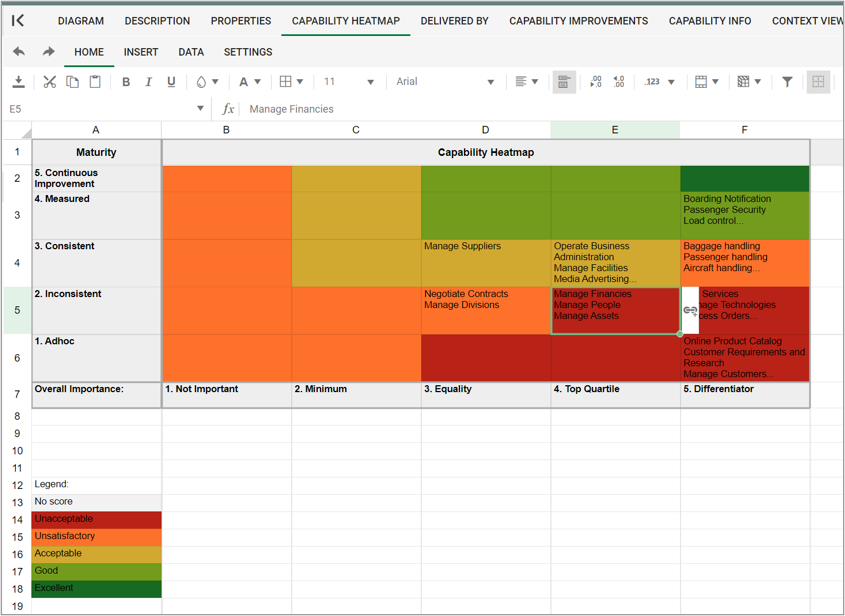
  • The capabilities can be presented in a Capability heatmap

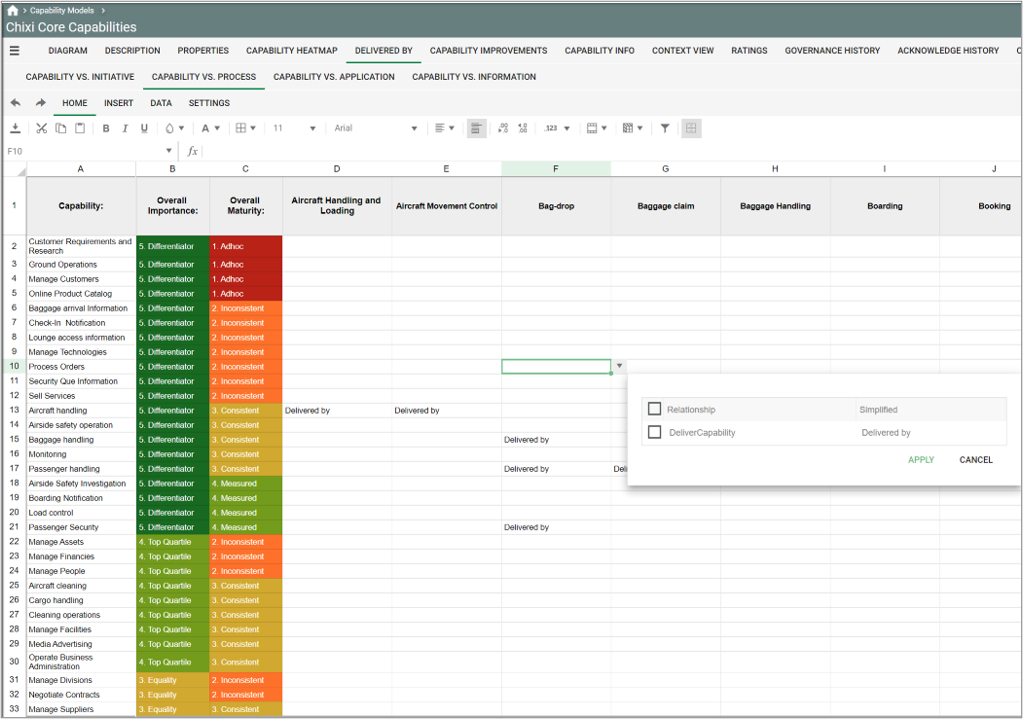
  • From the Delivered by view you can analyze and update relations between capabilities and initiatives, processes, applications and information-objects.

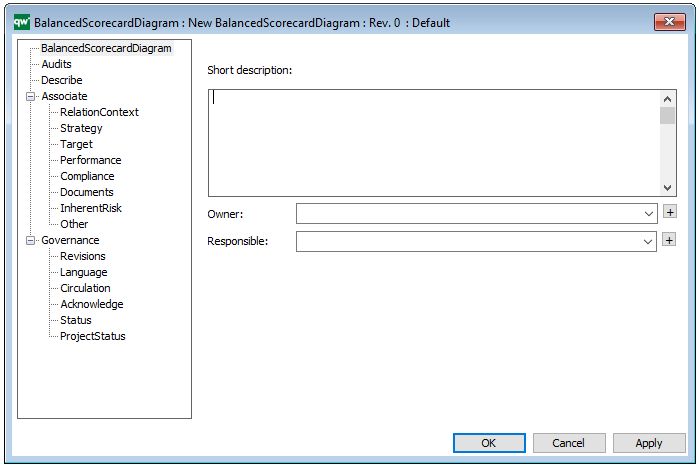
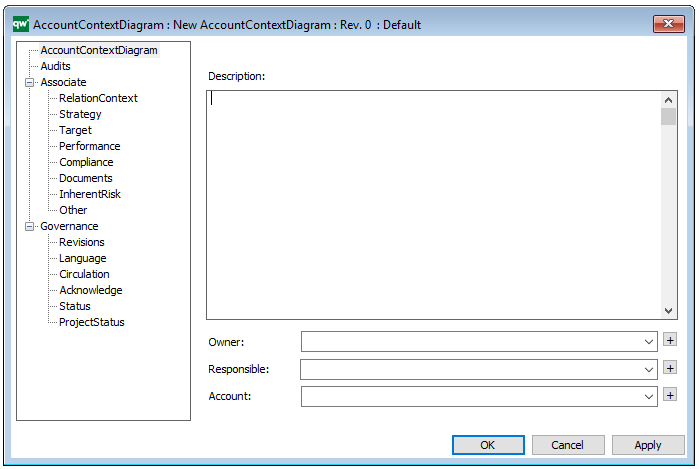
Properties and metadata: The Business Capability Model can for example retain the following information:

  • A description of the diagram
  • Link to the owner of the diagram
  • Link to the one responsible for the accuracy of the diagram
  • Associated documents, diagrams and other objects
  • Inherent Risk detailing risk considerations
  • Governance information detailing information about the published diagram and who has been involved in the approval of the diagram
  • Project status: information about budgeted and actual man-hours spent, percentage completed and the latest milestone, result and quality control of a change process.

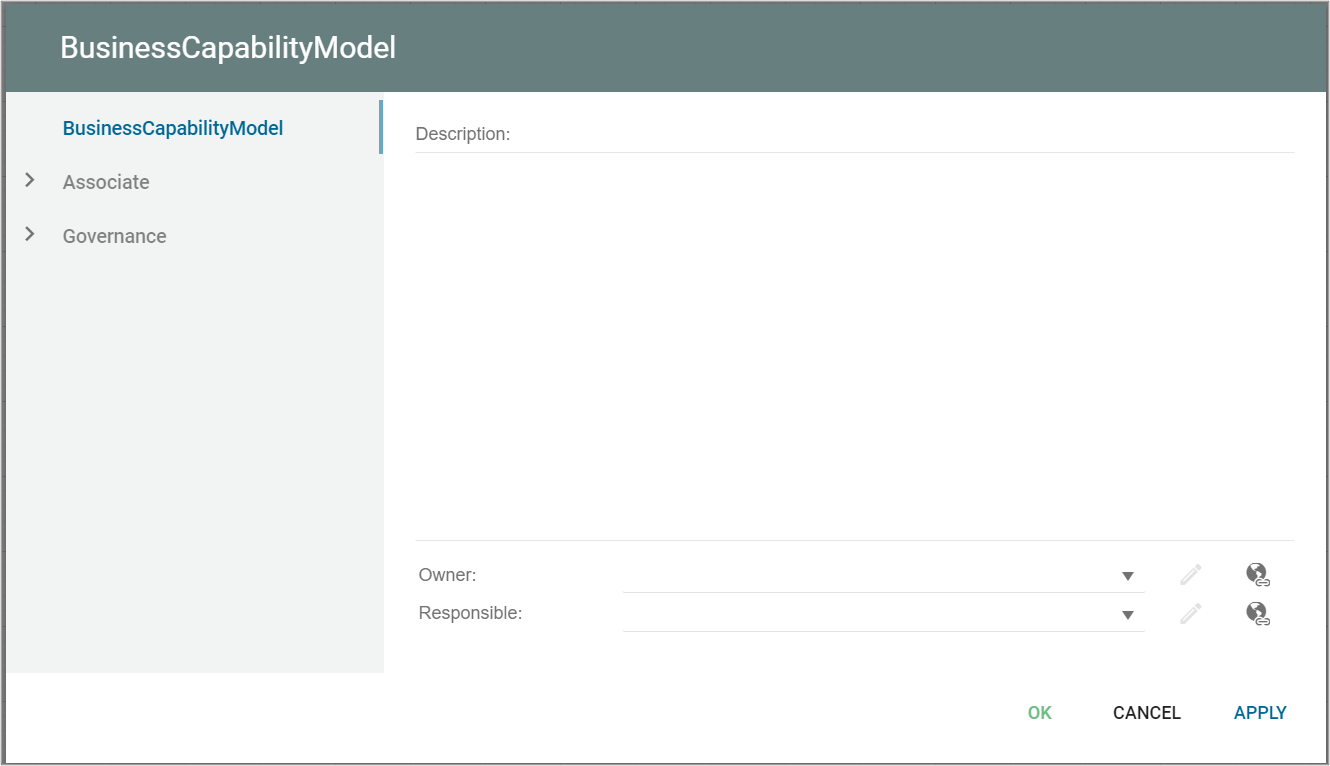
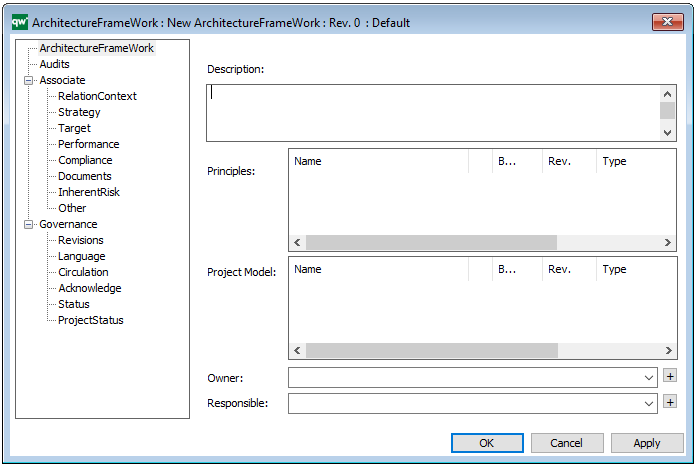
The above picture shows the properties dialogue window for the Business Capability Model where you can edit the diagram’s properties.

Note that the Capabilities’ metadata that are exhibited in the Business Capability Model is not further described here as they belong to the Capability object and not the Business Capability Model template.

Business Canvas

Purpose: The Business Canvas, is a strategic management and entrepreneurial template. It allows you to describe, design, challenge, invent, and pivot your business model.

Core Concerns: The core elements of the business canvas are framework cells that define a strategic or organizational entities and, if needed, connections between them. The Business Model can be structured any way you wish. The most well know structure of a business model is Alexander Osterwalder’s Business Model Canvas.

BusinessCanvas_1

The above picture shows a blank Business Model Canvas where each area is represented by a framework cell.

The strategic or organizational entities can then be enriched with an extended portfolio of strategic symbols such as vision, mission, goals, stakeholders, information systems and business processes.

Full content list of the extended portfolio:

  • Vision
  • Mission
  • Business Object
  • Market
  • Competitive Advantage
  • Technology
  • Competence
  • Capability
  • Performance Indicator
  • Business Function
  • Business Process
  • Organization Unit
  • Stakeholder
  • Information System
  • External Entity
  • Location
  • Channel
  • Goal
  • Opportunity
  • Threat
  • Trend
  • Material Asset
  • Intellectual Capital Asset
  • Business Rule
  • Key Performance Indicator


The picture below shows a Business Model Canvas that is filled out with symbols from the extended portfolio.

BusinessCanvas_2

Relation to other templates: The Business Canvas can link to multiple related templates detailing the businesses capabilities, business processes, strategy and more.

Properties and metadata: The Business Canvas Diagram can for example retain the following information:

  • A description of the diagram
  • Link to the owner of the application architecture
  • Link to the one responsible for the application architecture
  • Audits (auto generated information regarding its current state and access rights)
  • Associated documents, diagrams and other objects
  • Inherent Risk detailing risk considerations
  • Governance information detailing information about the published diagram and who has been involved in the approval of the diagram


Balanced Scorecard Diagram

Purpose: The purpose of the Balanced Scorecard Diagram is to model Balanced Scorecards, as described by Robert Kaplan and David Norton in 1992.

Core concern: Usually, a Balanced Scorecard Diagram template measures the state of the enterprise via Key Performance Indicators that are categorized into four different perspectives using Business Scopes. Aside from this, the template enables you to model general concepts and cause/effect.

Below, you can see an example of a Balanced Scorecard Diagram:

BalancedScoracardDiagram_1

Relation to other templates: The Balanced Scorecard Diagram can be used to create a Performance Evaluation Model or a Strategic Management Diagram the Key Performance Indicators it contains can be broken down into Performance Diagrams offering a detailed view of how the organization performs. If CXO dashboards are to be created, the Strategy Model should be used instead.

Properties and metadata: The Balanced Scorecard Diagram can for example retain the following information:

  • A description of the diagram
  • Link to the owner of the diagram
  • Link to the one responsible for the diagram
  • Audits (auto generated information regarding its current state and access rights)
  • Associated documents, diagrams and other objects
  • Inherent Risk detailing risk considerations
  • Governance information detailing information about the published diagram and who has been involved in the approval of the diagram.

The above picture shows the properties dialogue window for the Balanced Scorecard Diagram, where you can view and edit the diagram’s properties in QualiWare Lifecycle Manager.

Architecture Framework

Purpose: The purpose of the Architecture Framework template, is to provide an overview of the enterprise, and the context for a diagram, showing where in the architecture and repository it belongs. An Architecture Framework shows the overall structure of the architecture and the structure with which it is represented in the repository.

Core concerns: The Architecture Framework template consists of FrameWorkCells, FrameWorkColumns, FrameWorkRows and LineOfBusinesses. You can choose to model the framework to fit the one your organization is using – QualiWare supports a wide range of architecture frameworks out of the box such as Zachman, TOGAF , OIOEA, EA3 Cube, EDGY, QualiWare EA Framework, and many more.

Below, you can see an example of the QualiWare EA Framework:

ArchitectureFramework_1

Below, you can see an example of a TOGAF framework:

ArchitectureFramework_2

Relation to other templates: The Architecture Framework template is used to represent the repository’s architecture in the form of a specific framework. If CXO dashboards are to be created, the Strategy Model should be used instead.

An ArchitectureFramework can be modeled using FrameWorkRows, FrameWorkColumns, and FrameWorkCells

Properties and metadata: The Architecture Framework can for example retain the following information:

  • A description of the diagram
  • Link to Architecture principles and project models
  • Link to the owner of the framework
  • Link to the one responsible for the framework
  • Audits (auto generated information regarding its current state and access rights)
  • Associated documents, diagrams and other objects
  • Inherent Risk detailing risk considerations
  • Governance information detailing information about the published diagram and who has been involved in the approval of the diagram

The above picture shows the properties dialogue window for the Architecture Framework where you can view and edit the diagram’s properties in QualiWare Lifecycle Manager.

Account Context Diagram

Purpose: The purpose of the Account Context Diagram is to enable financial risk management by illustrating which processes create transactions on a given account, and which risks are related to this transaction.

Core concerns: The Account Context Diagram enables you to model Accounts, Business Processes and link them with influences.

Below, you can see an example of an Account Context Diagram for the account ‘Other Payables’:

The risks are linked to the influencers and shown on the diagram. For example, in the above diagram, both risks are: ‘Goods received not invoiced, not recognized as a liability at period end’.

It is possible to link multiple risks to each influence. In the following diagram, you can see a similar Account Context Diagram, where several risks are connected to a single influence:

Relation to other templates: The Account Context diagram is for financial risk management. It is related to the Control Coverage Map and the Heat Map templates, which can be generated based on the information in the Account Context Diagram.

Properties and metadata: The Account Context Diagram ­­­­can for example retain the following information:

  • A description of the diagram
  • Link to the owner of the diagram
  • Link to the one responsible for the diagram
  • Link to the Account shown in the diagram
  • Audits (auto generated information regarding its current state and access rights)
  • Associated documents, diagrams and other objects
  • Inherent Risk detailing risk considerations
  • Governance information detailing information about the published diagram and who has been involved in the approval of the diagram

The above picture shows the properties dialogue window for the Account Context Diagram where you can view and edit the diagram’s properties in QualiWare Lifecycle Manager.