Purpose: The Purpose of the Data Model Diagram template is to model the structure of data entities of an Information System and their relationships. Documenting the structure of information is a very important part of the preliminary analysis before implementing any Information System.
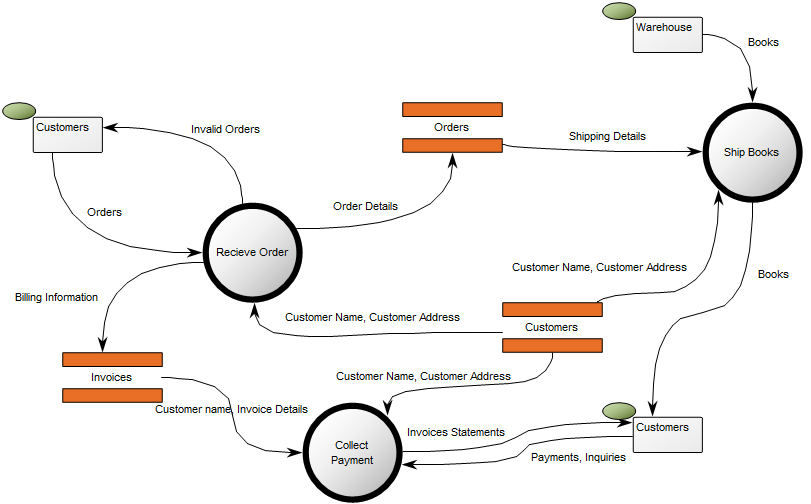
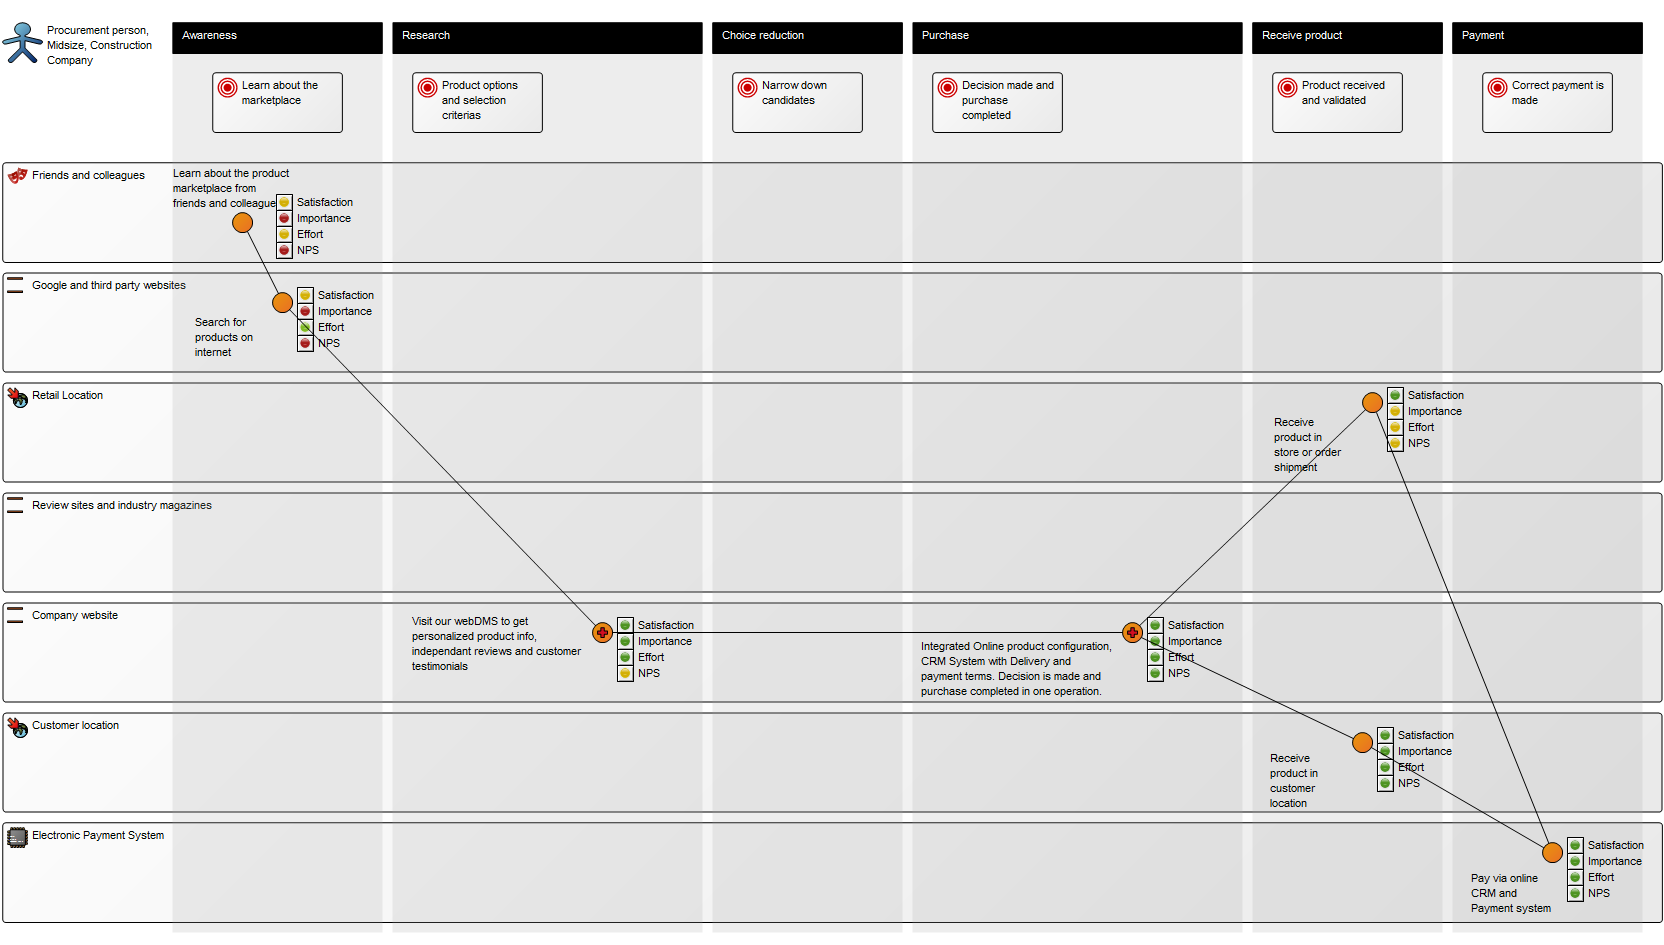
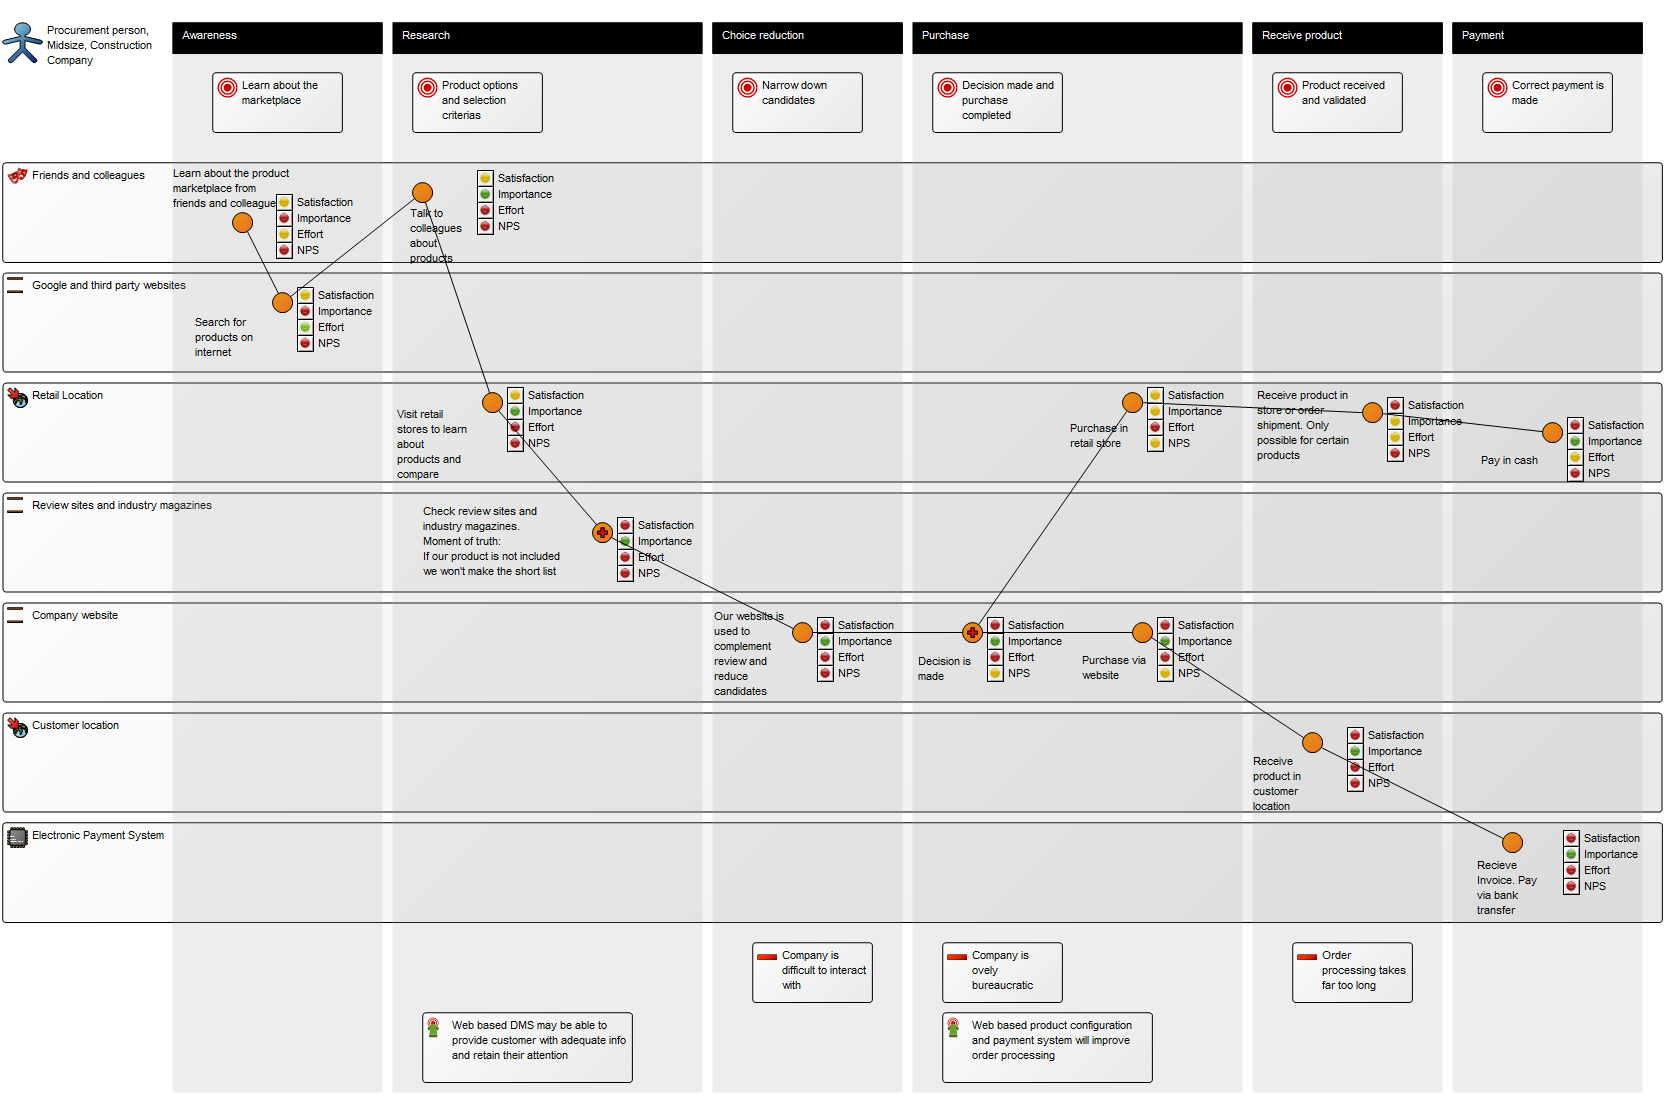
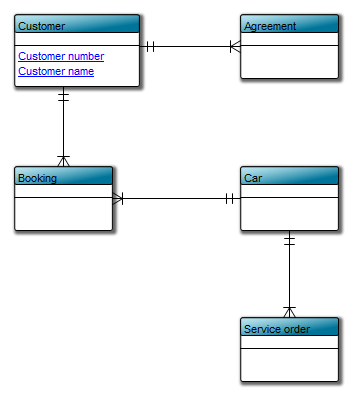
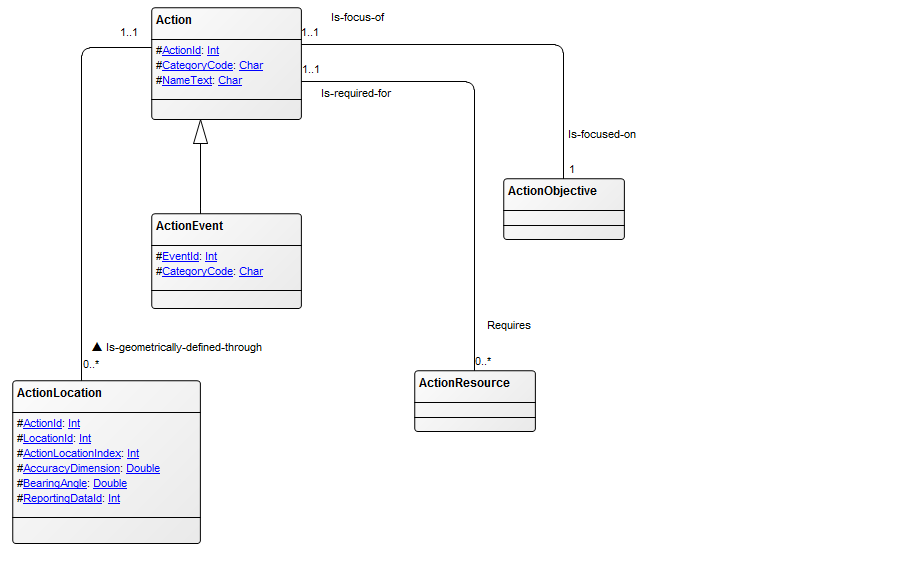
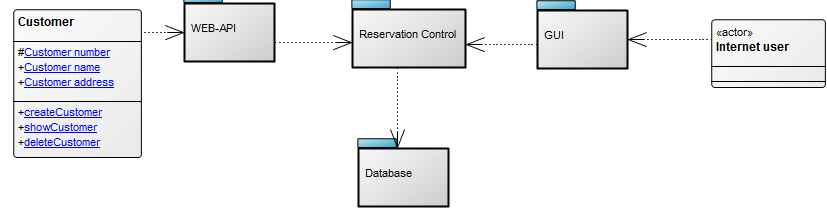
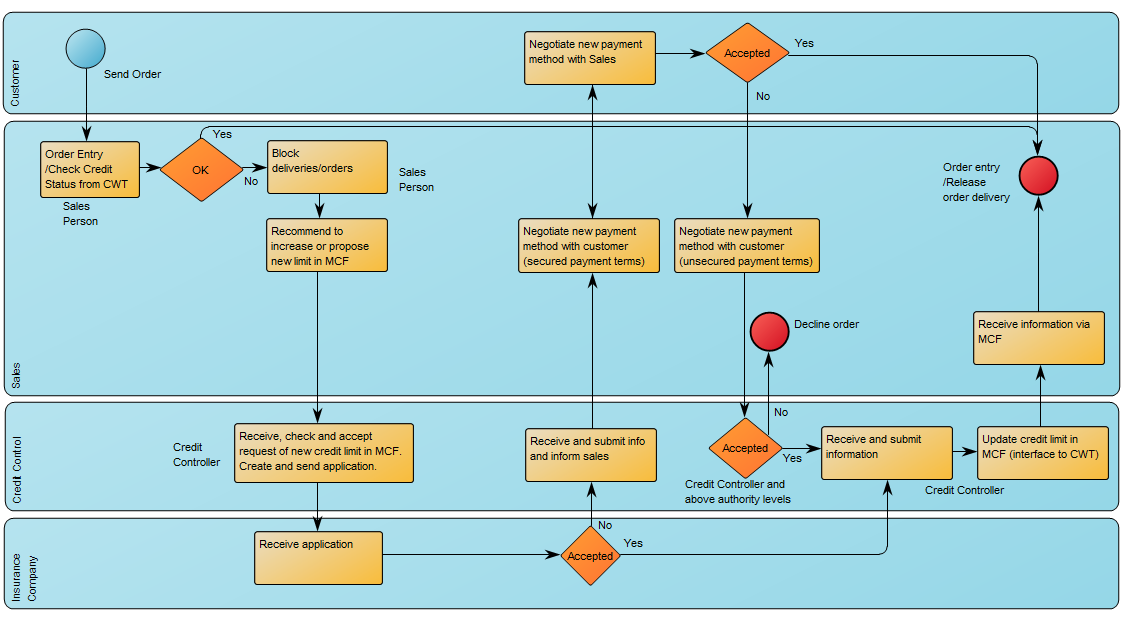
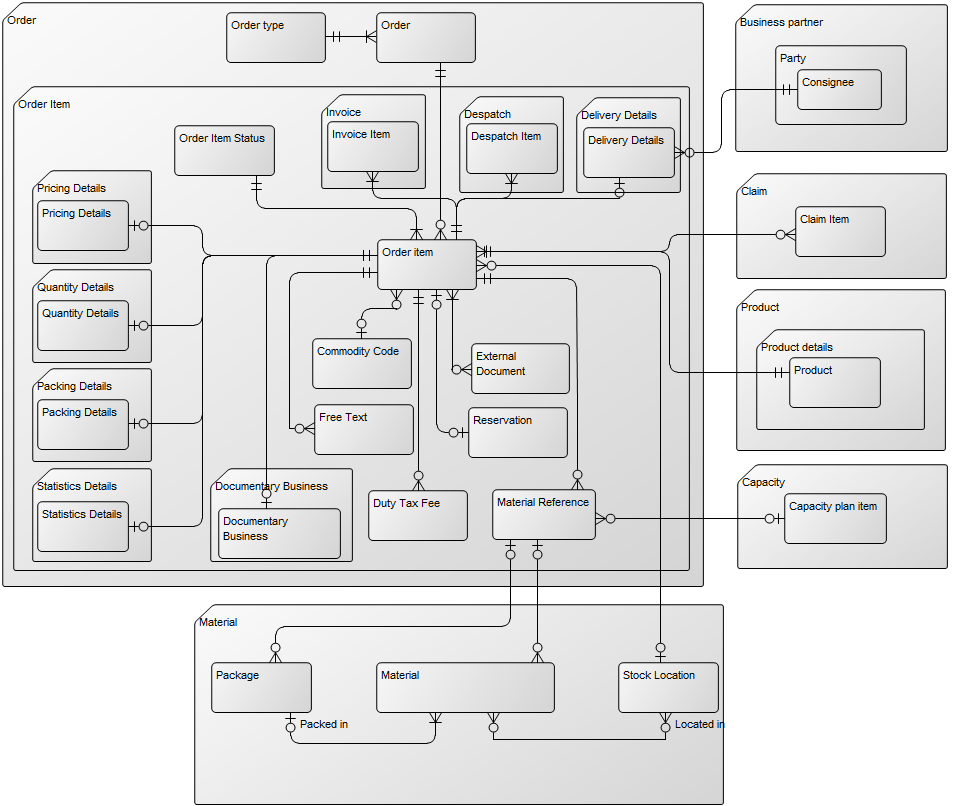
Core concerns: The Data Model Diagram template enables the user to document the structure of the information, that an Information System is supposed to store. The template allows you to model using Data Entities, Subject Area, Data Entity View, Model View and inheritance. The Connection types available are: Data Relation, Inheritance Connection, Complex Relation and Generalization. Below you can see an example of a Data Model Diagram describing the information structure related to an order:
Relation to other templates: The Data Model Diagram template should not be used to document data flows. In that case the Data Flow Diagram template should be used.
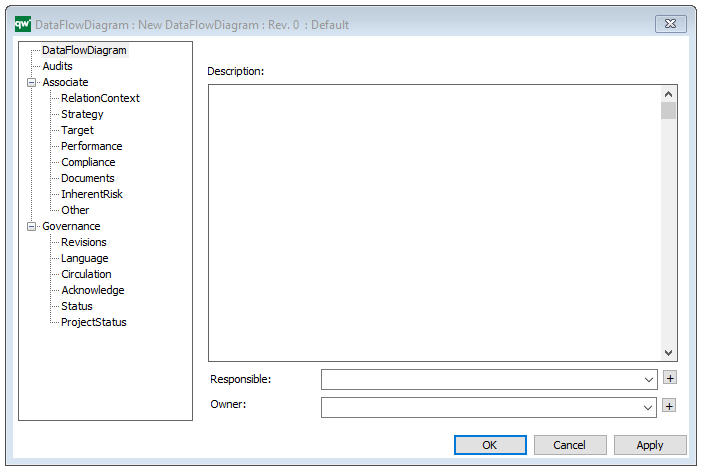
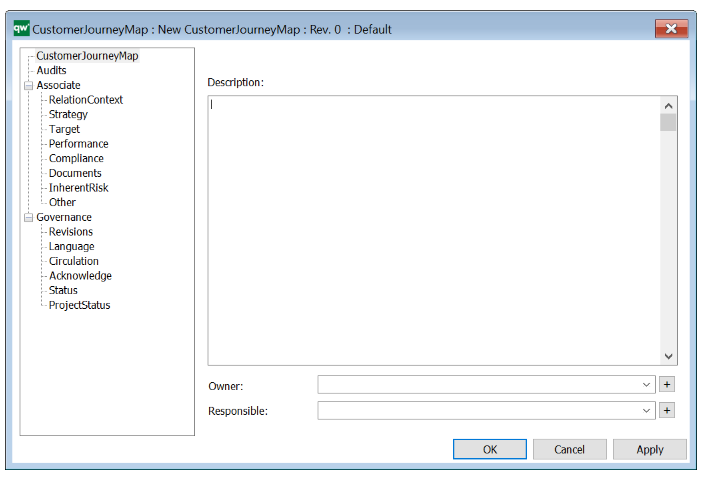
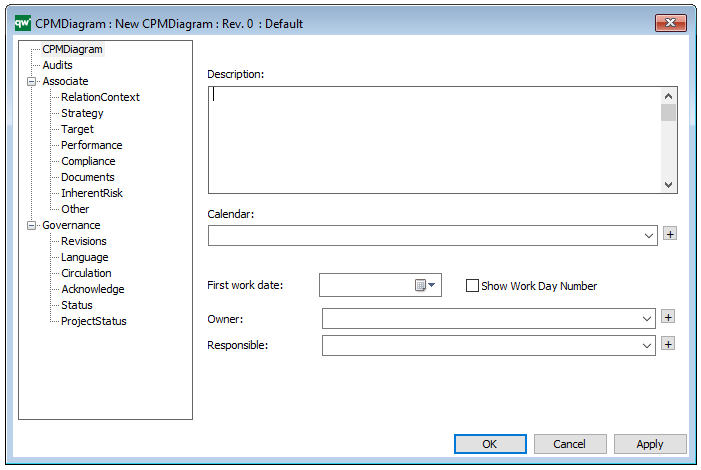
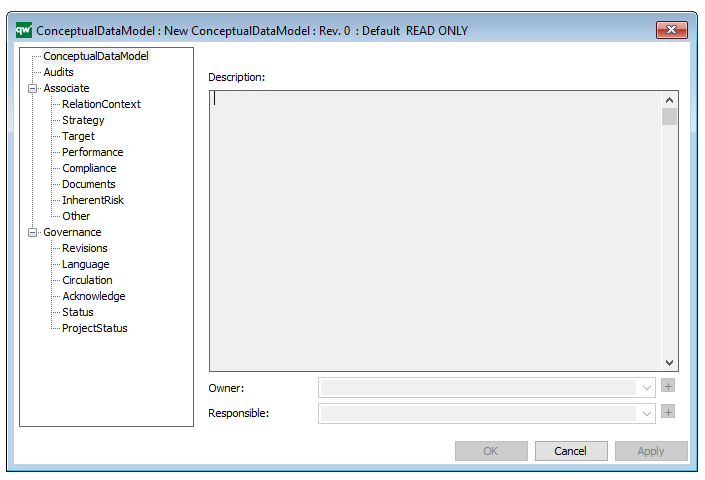
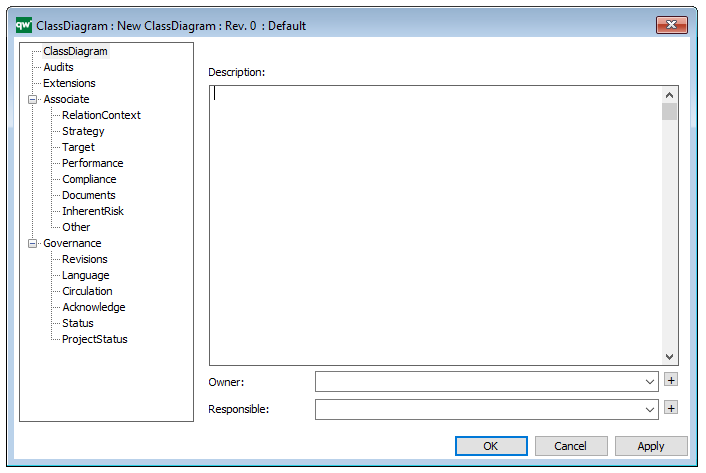
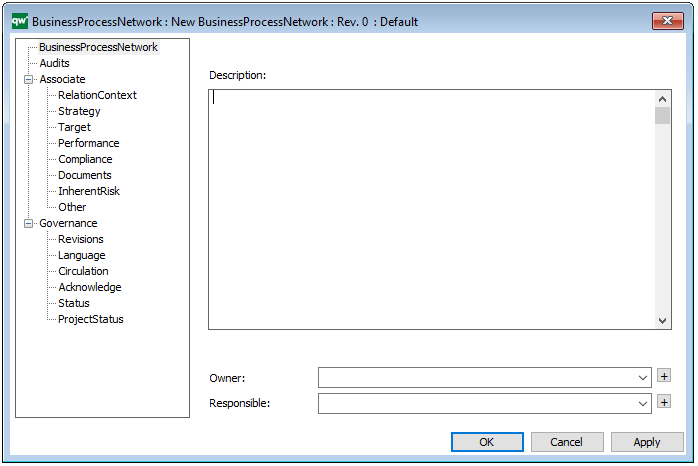
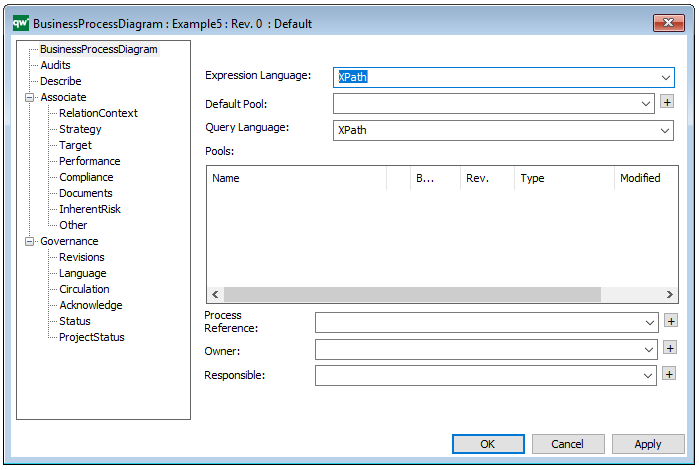
Properties and metadata: The Data Model Diagram can for example retain the following information:
- A description of the diagram
- Link to the owner of the diagram
- Link to the one responsible for the accuracy of the diagram
- Audits (auto generated information regarding its current state and access rights)
- Associated documents, diagrams and other objects
- Inherent Risk detailing risk considerations
- Governance information detailing information about the published diagram and who has been involved in the approval of the diagram
- Project status: information about budgeted and actual man-hours spent, percentage completed and the latest milestone, result and quality control of a change process.
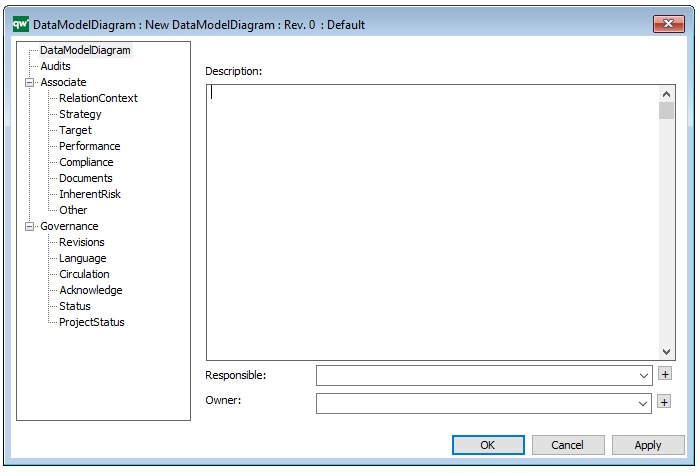
The above picture shows the properties dialogue window for the Data Model Diagram where you can view and edit the diagram’s properties.
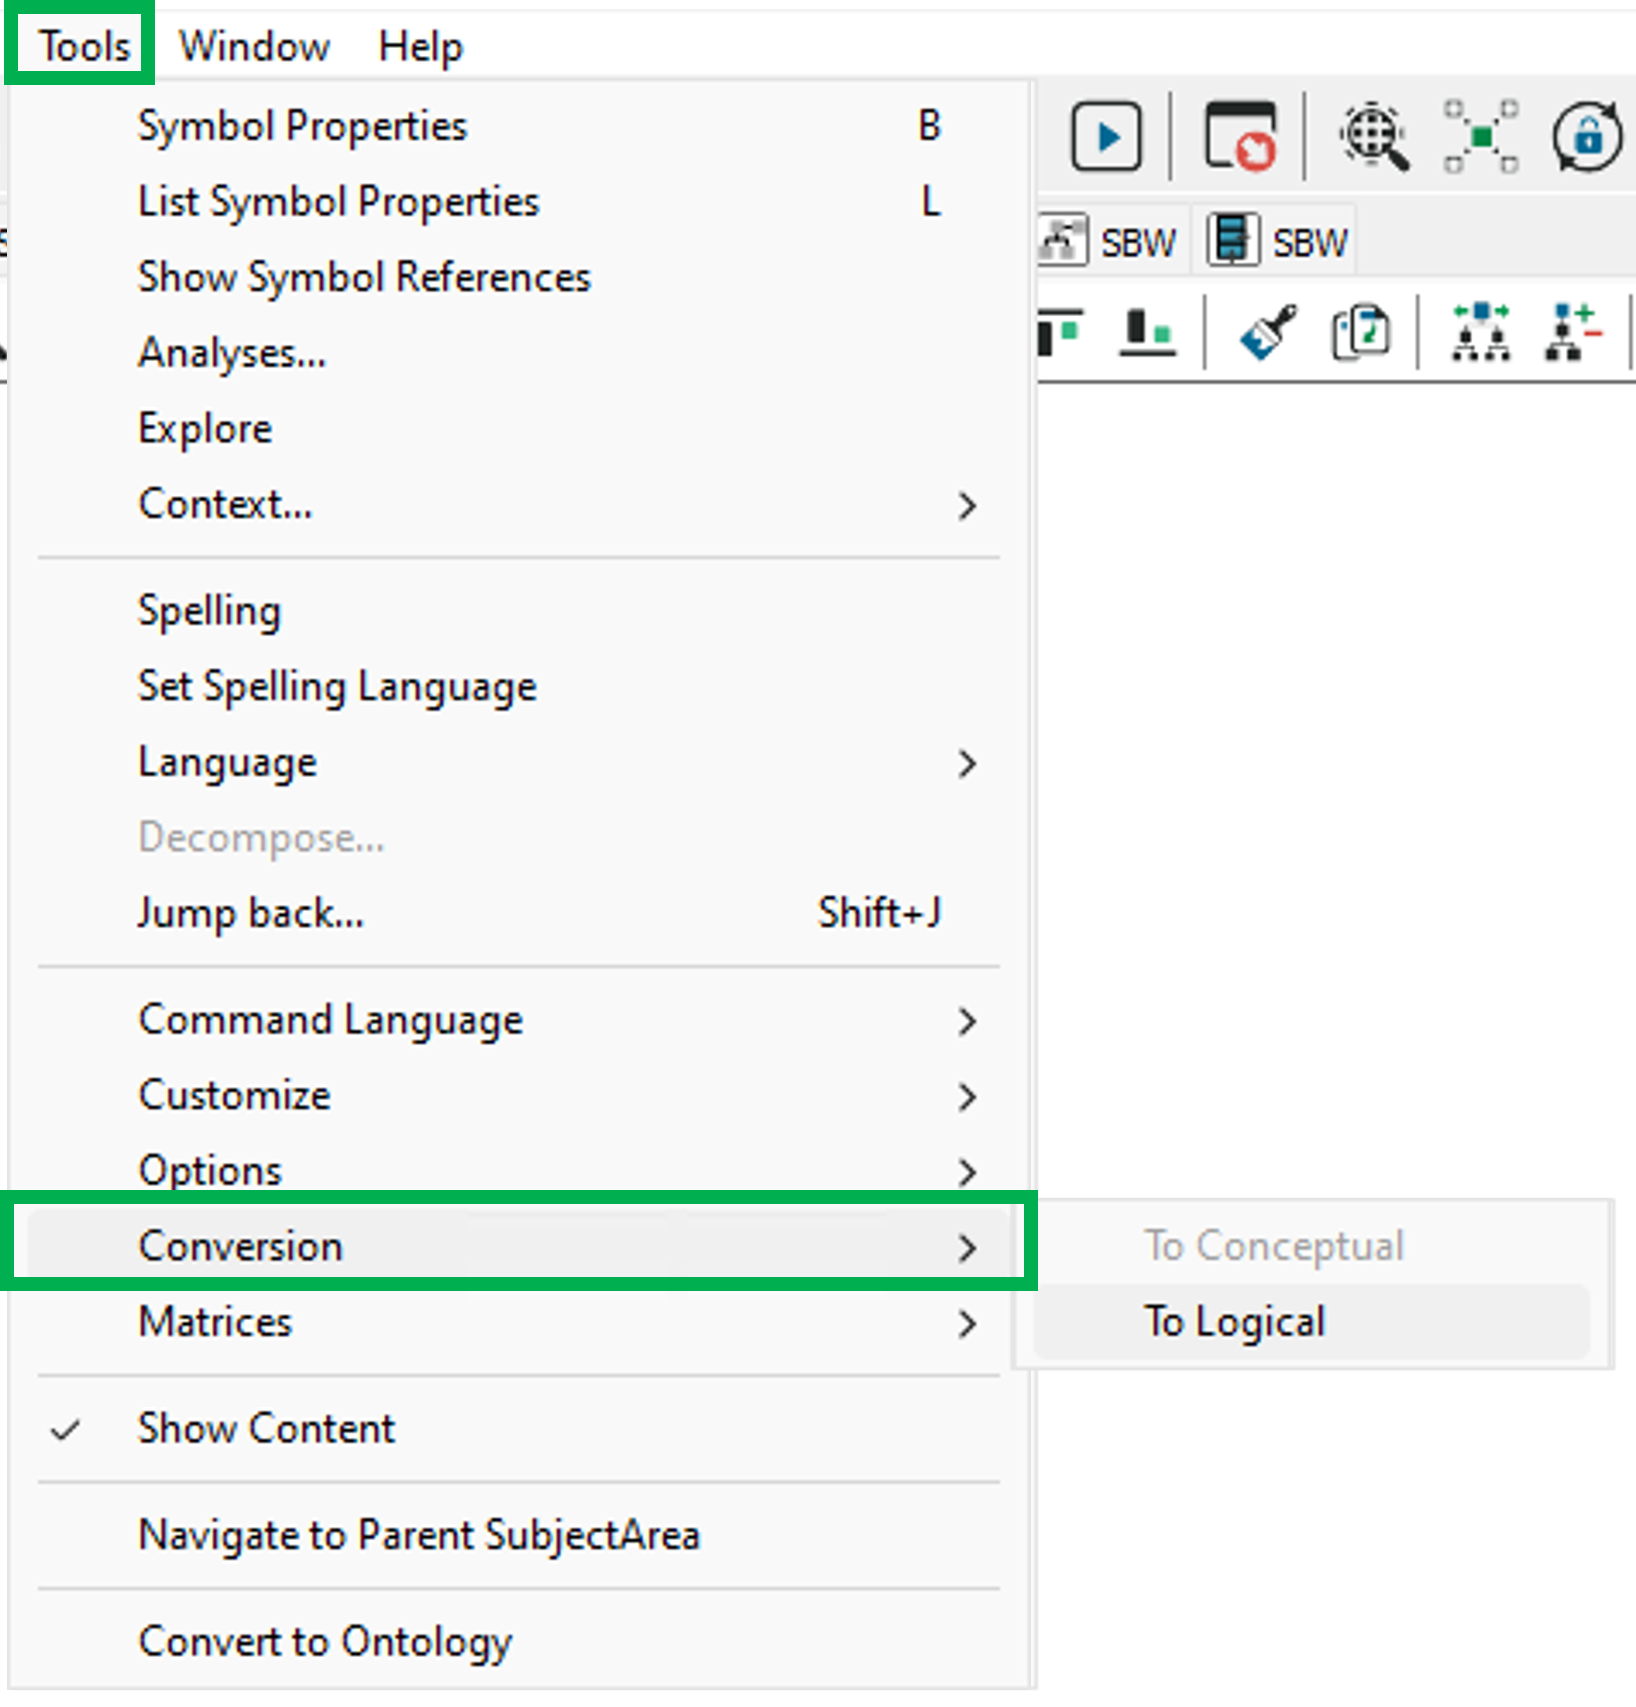
Conversions
It is possible to convert between the different models.
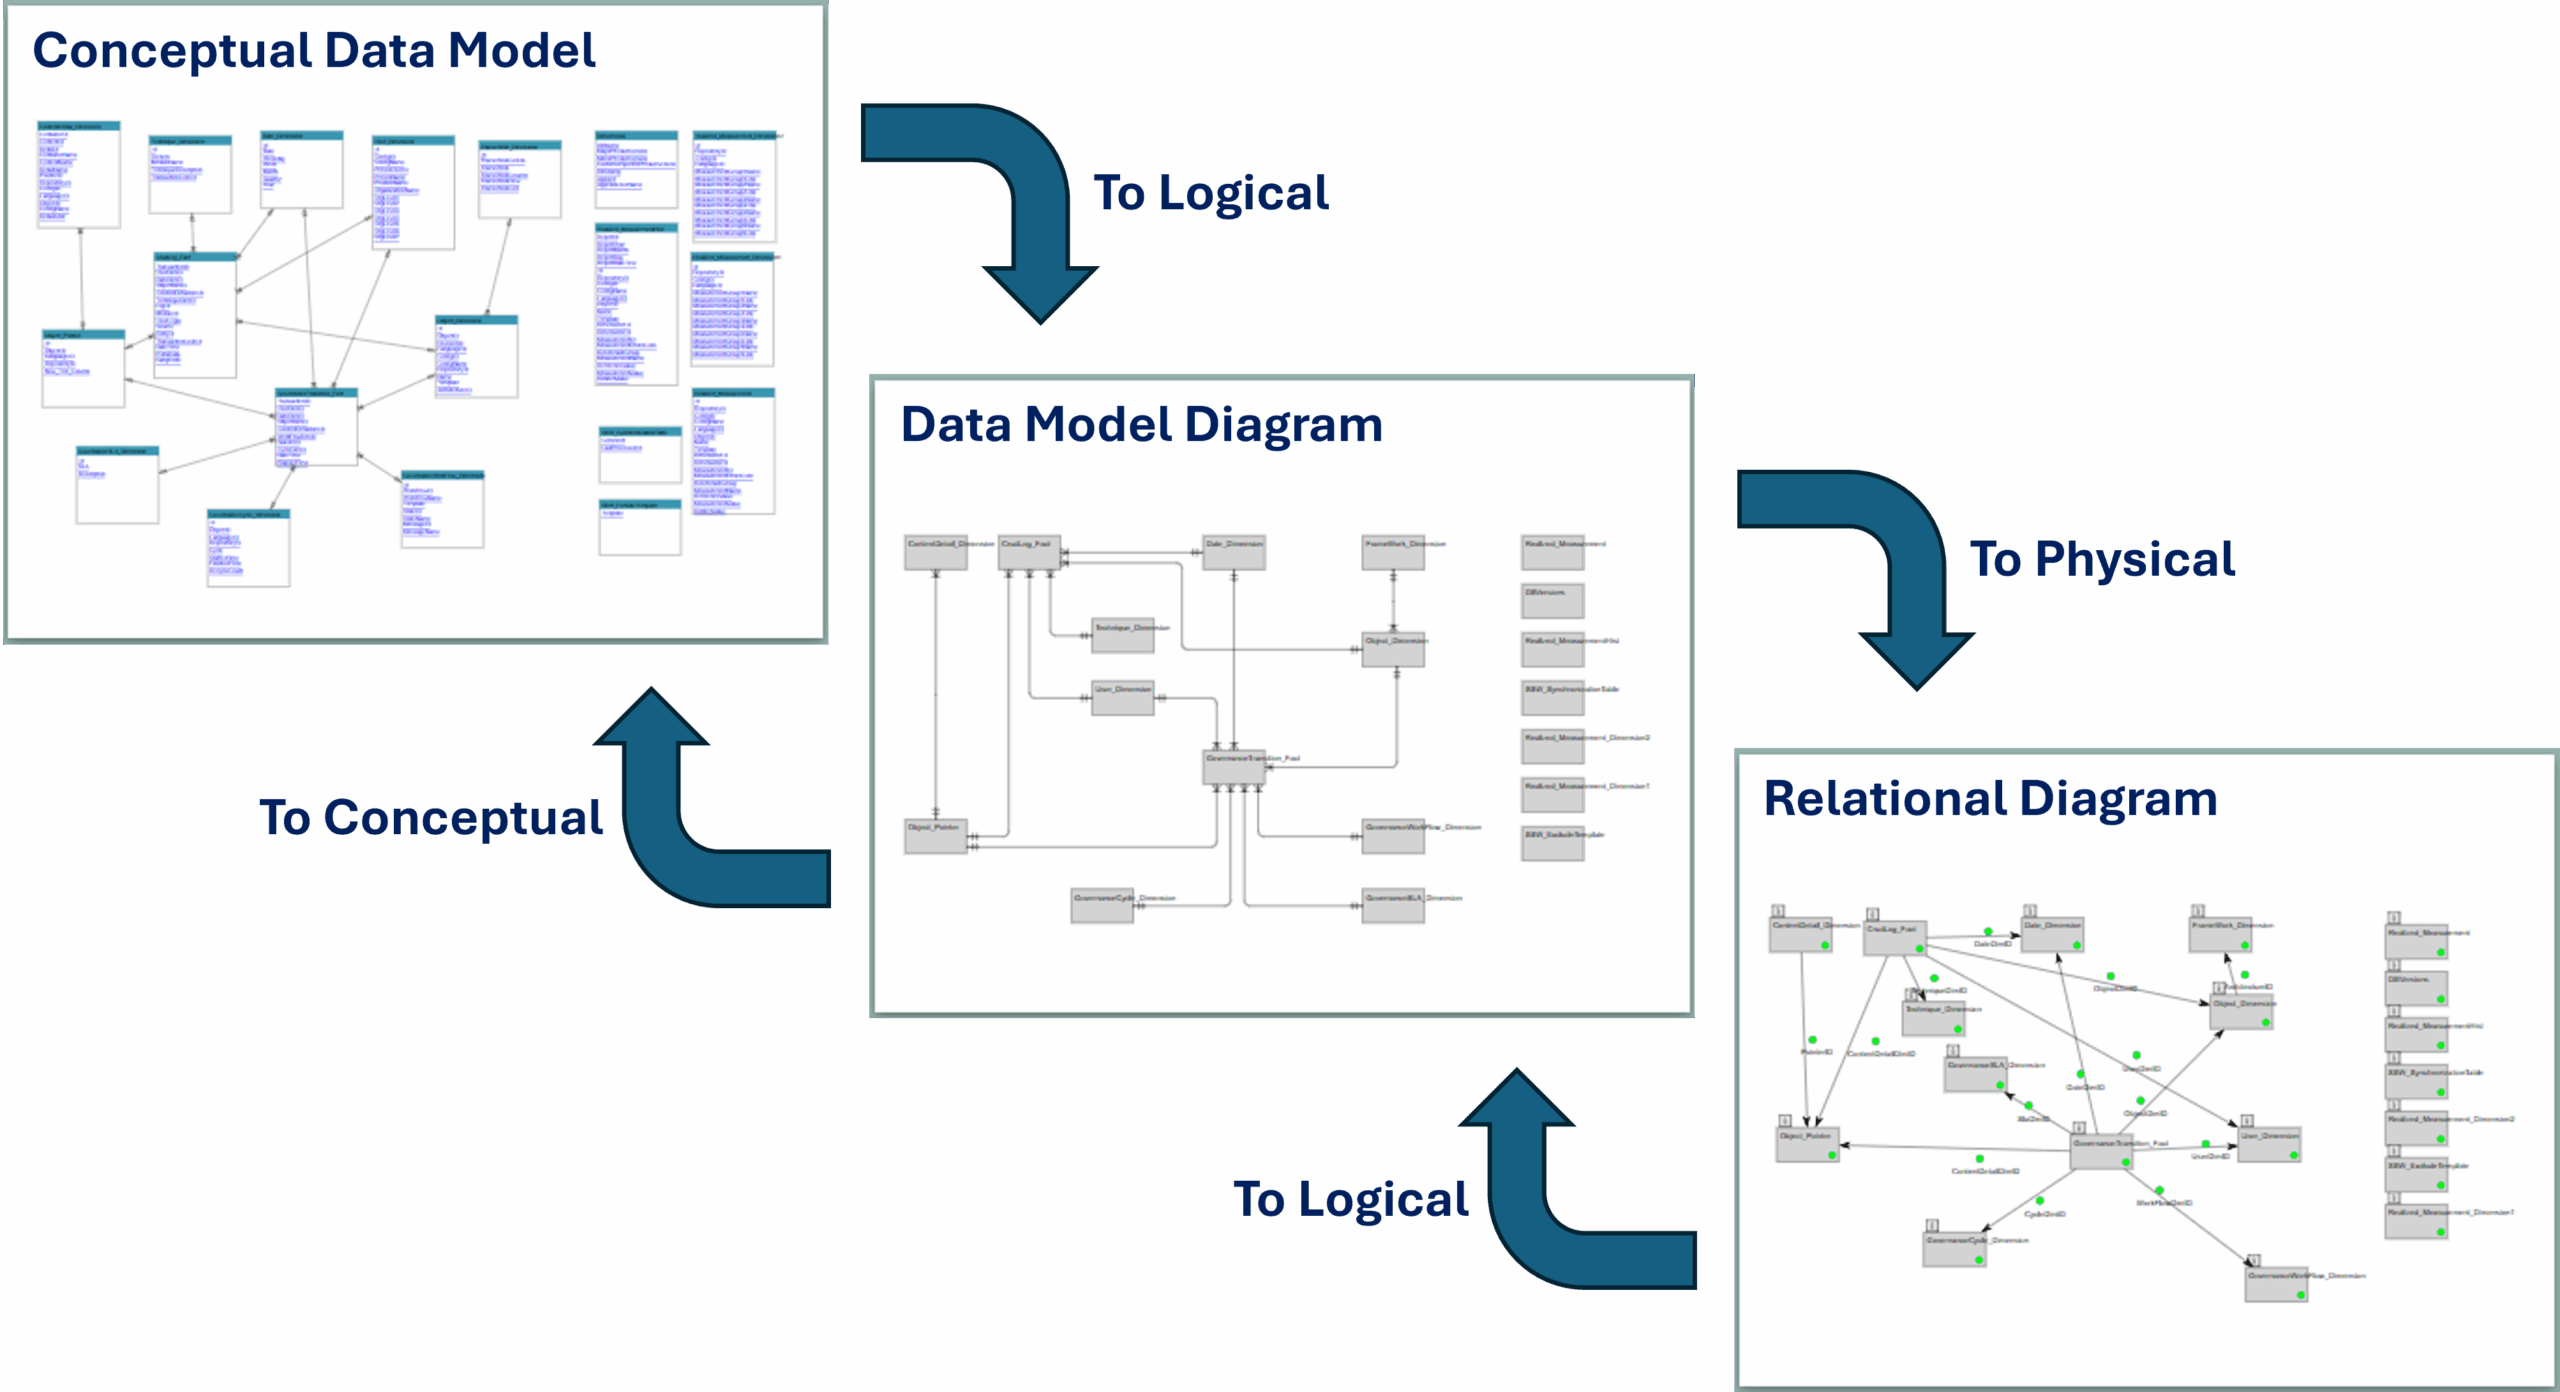
It is possible to convert a DataModelDiagram from the logical model to a conceptual (ConceptualDataModel) and physical level (RelationalDiagram) from the tools menu in QLM.
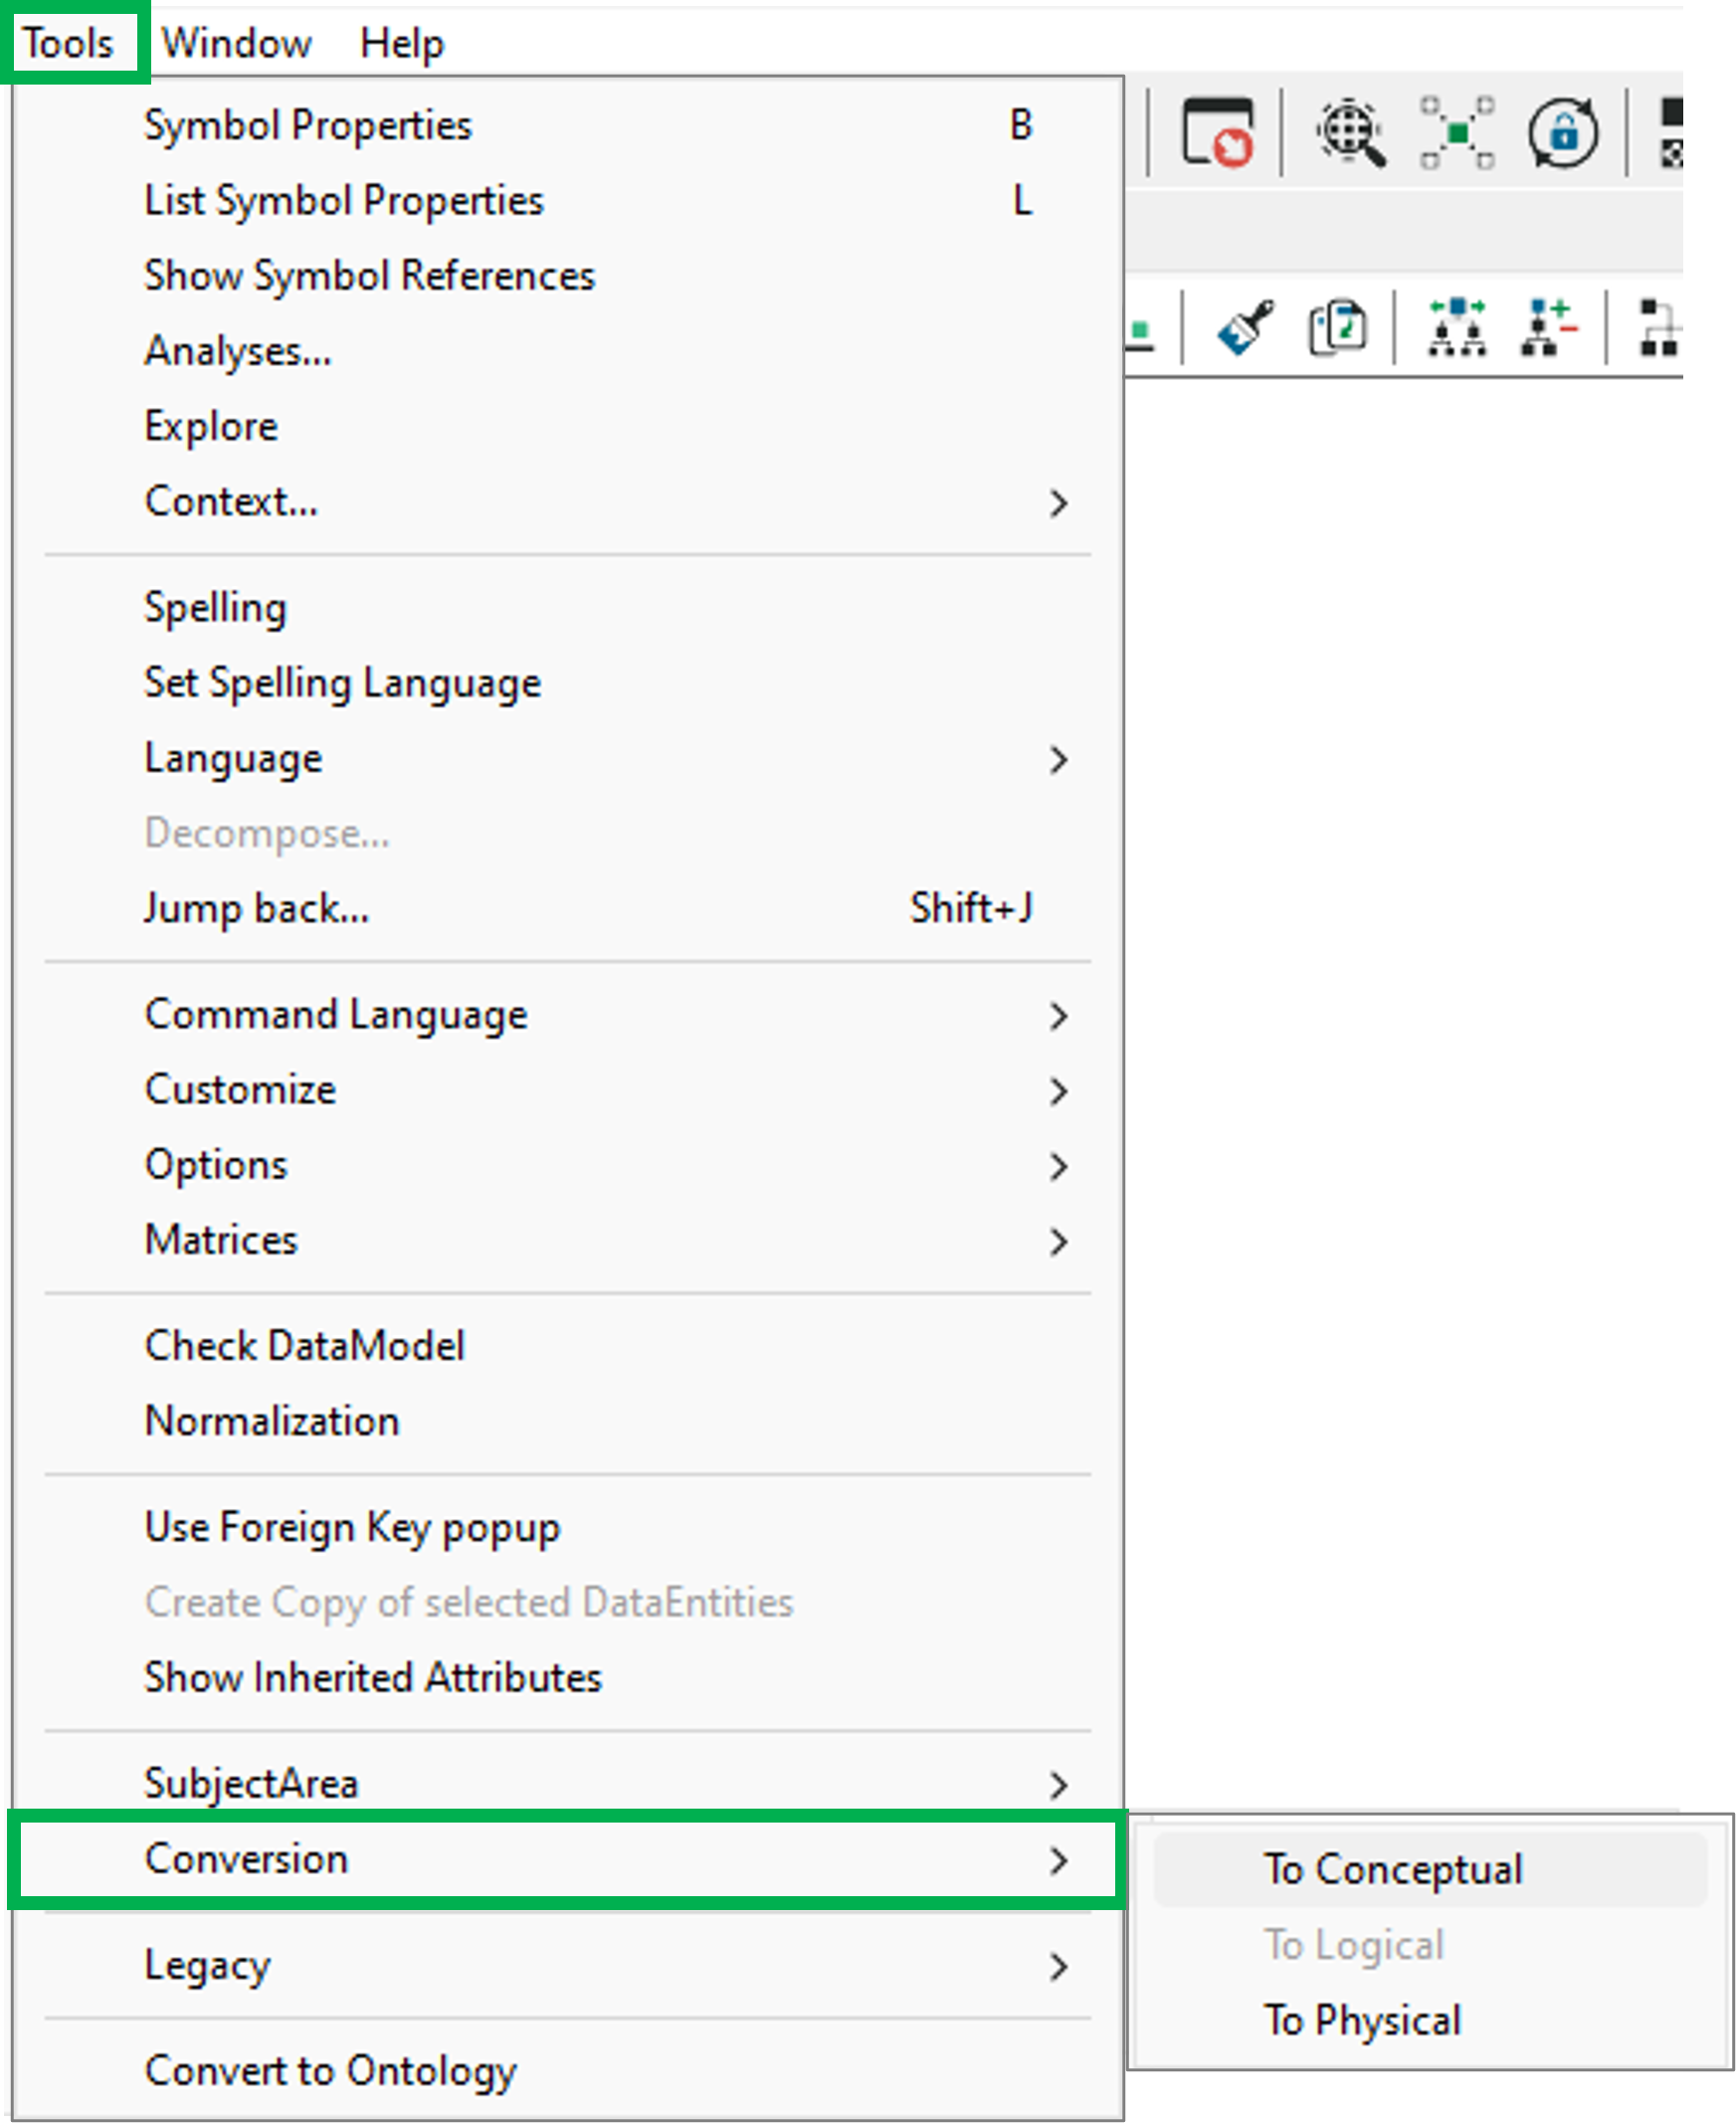
From the same menu the model can also be converted to an OntologyDiagram, and the model can be created from an OntologyDiagram read more here: