Matrix

Purpose: The Matrix template is used as an auxiliary diagram type for other diagrams. It can either show the properties or links of and between existing objects.

Concerns: There can be generated three types of Matrix diagrams: Link Matrices, Property Matrices and Text Matrices.

  • Link Matrices are typically used to summarize the links of two different template types. For example, a Link Matrix can be created using Business Process as the rows and Information Systems as the columns to quickly get an overview over which Information Systems are linked to which Business Processes under IT -Support.
  • Property Matrices can be used to summarize the contents of many objects, for example, of a single template type in a single diagram. For example, a Property Matrix can be created for Information Systems to obtain an overview over the details describing all the relevant Information Systems and identify any gaps in the information. You could also choose to filter the items in the template, so only the Information Systems used in a specified process are shown.
  • Text Matrices function as a regular spreadsheet. This type of matrix can for example be used to store data used for KPIs

Below is an example of a property matrix detailing the risks and control processes related to the process called ‘Inventory’:

Matrix_1

Below is an example of a link matrix detailing the relation between three identified risks and several controls (from the diagram, you can see that only two of three risks are addressed by the control processes):

Matrix_2

Relation to other templates: Where the Matrix can be used as a backend tool, Query Result Views (QRV’s) are created to give an overview of specific objects and their attributes on the collaboration platform.

 Properties and metadata: The Matrix template can for example retain the following information:

  • A description of the diagram
  • Audits (auto generated information regarding its current state and access rights)
  • Associated documents, diagrams and other objects

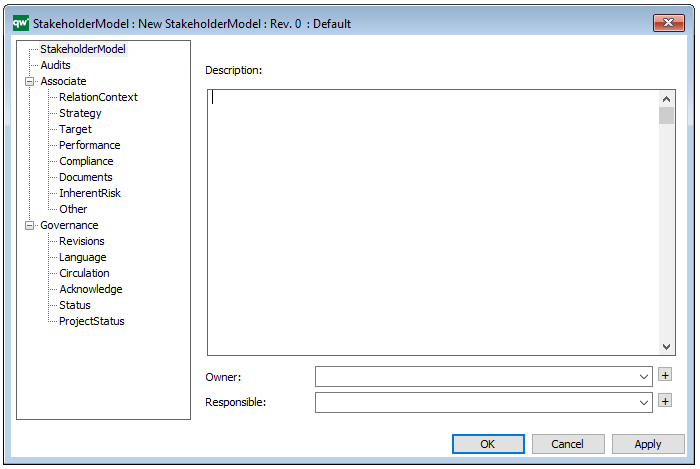
In the picture below you can see the Matrix template’s properties dialogue window, where the properties can be viewed and edited:

You can also edit the properties of the Matrix in the properties dialogue window by changing the Matrix behavior, Row filter or Column filter.


Manufacturing Routing Network

Purpose: The purpose of the Manufacturing Routing Network is to specify the steps used in manufacturing a product. Below is an example of a Manufacturing Routing Network of an Item including Assembly, test and final control. At the right-hand side, you can see that different specifications have been attached as well:

ManufacturingRoutingNetwork_2

Core concerns: The Manufacturing Routing Network template enables you to model Work Operations, Products, Business Objects, General Concepts, and Production Lines. You are also able to distinguish between Activity Paths, Assembly Flows and Transport Systems. If you wish to attach External Documents, they should be attached to the Work Operations they pertain to. Below is another example of a Manufacturing Routing Network that describes the process from assembly to shipping:

ManufacturingRoutingNetwork_1

Relation to other templates: The Manufacturing Routing Network template is related to the various different models for products such as the Product Viewpoint template, the Product Variant Master template, the Product Rule Table, the Product Roadmap and the Product Canvas. Each template offers a different viewpoint of the product in various stages of its lifecycle.

Properties and metadata: The Manufacturing Routing Network template can for example retain the following information:

  • A description of the diagram
  • Link to the owner of the diagram
  • Link to the one responsible for the accuracy of the diagram
  • Audits (auto generated information regarding its current state and access rights)
  • Associated documents, diagrams and other objects
  • Inherent Risk detailing risk considerations
  • Governance information detailing information about the published diagram and who has been involved in the approval of the diagram
  • Project status: information about budgeted and actual man-hours spent, percentage completed and the latest milestone, result and quality control of a change process.

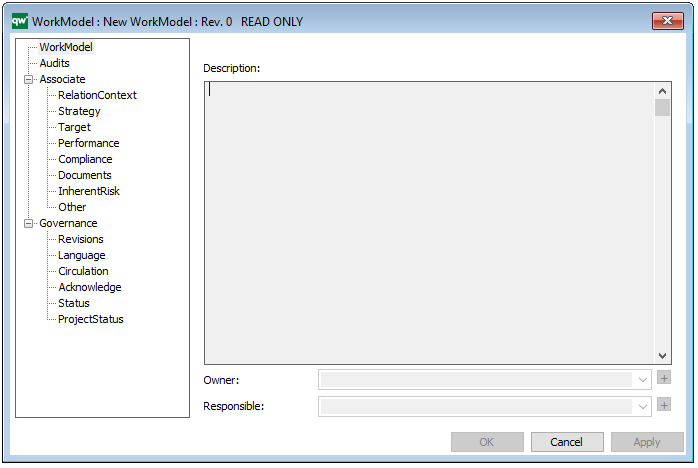
In the picture below you can see the Manufacturing Routing Network’s properties dialogue window, where the properties can be viewed and edited:


Lifecycle Assessment Diagram

Purpose: The purpose of the Life Cycle Assessment Diagram template is to document the relations for an activity or product in a lifecycle context.

Core concerns: The Lifecycle Assessment Diagram concerns itself with modelling elements in a company that interact with the environment. The template enables you to model Environmental Aspects and Objectives for Activities in your organization. This template allows you to model Business Objects, Activities, Performance Indicators, Business Connection, Goals, Policies, Critical Success Factors, Change Requests and Problems. These elements can be grouped into Categories and connected by Impact Quantity, Recycling, Logistical Flows, Information Flows, and Activity Paths.

Below, you can see an example of a Lifecycle Assessment Diagram for a Product, from production to packaging, focusing on reducing unbiodegradable waste:

The elements used in this example are Business Objects as input and output, Activities showing Logistical Flows and Recycle under Process. Under the Environment Category, Environmental Aspects, Impact and Objectives are identified and Policies for reaching the Objectives are also included. The diagram focus on a single Environmental impact: Waste. You can also choose to map out several Environmental impacts that are relevant to a specific activity or product.

Relation to other templates: The Environmental Aspects and Impacts from the Lifecycle Assessment Diagram can be further explored in the Environmental Impact Diagram. The Lifecycle Assessment Diagram is also related to the Business Process Diagram and Workflow Diagram, in the sense that they all are related to detailing aspects of processes. The Lifecycle Assessment Diagram can also be decomposed from the Inventory object shown in, for example, the Production Site template.

Properties and metadata: The Lifecycle Assessment Diagram template ­­­­can for example retain the following information:

  • A description of the diagram
  • Link to the owner of the diagram
  • Link to the one responsible for the diagram
  • Audits (auto generated information regarding its current state and access rights)
  • Associated documents, diagrams and other objects
  • Inherent Risk detailing risk considerations
  • Governance information detailing information about the published diagram and who has been involved in the approval of the diagram

The above picture shows the properties dialogue window for the Lifecycle Assessment Diagram template, where you can view and edit the diagram’s properties in QualiWare Lifecycle Manager.

For more information: You can learn more about Lifecycle Assessment on the US Sustainable Facilities Tool website or turn to ISO standard 14040.

Work Breakdown Structure

Purpose: The purpose of the Work Breakdown Structure template is to document the systematical structure of a project to define its organization or structural levels and plan resource allocation.

Core concerns: The Work Breakdown Structure diagram consists of Results, Notes, and their connections. It gives a simple overview of the structure of a projects phases and deliverables. In the illustration below, a Work Breakdown Structure for a project that is to define the requirement specifications for a new booking system:

Inside each Result, information about the estimated needed resources.

Relation to other templates: As a Work Breakdown Structure offers a detailed view of a project’s phases and deliverables and is as such, related to the Work Model. To determine the critical path of a project you should use the Critical Path Method Diagram.

Properties and metadata: The Work Breakdown Structure can for example retain the following information:

  • A description of the diagram
  • Link to the owner of the diagram
  • Link to the one responsible for the accuracy of the diagram
  • Audits (auto generated information regarding its current state and access rights)
  • Associated documents, diagrams and other objects
  • Inherent Risk detailing risk considerations
  • Governance information detailing information about the published diagram and who has been involved in the approval of the diagram
  • Project status: information about budgeted and actual man-hours spent, percentage completed and the latest milestone, result and quality control of a change process.

In the picture below you can see the Work Breakdown Structure’s properties dialogue window, where the properties can be viewed and edited:

Integration View

Purpose: The purpose of the Integration View template is to document the routing of integrations between systems.

Core concerns: The Integration View template enables you to model Information Systems, System Components and External Entities (a source to or a receiver of information from a system), and connect them using Integration Flows.

Below is an example of an Integration View concerning the flow of test data:

Relation to other templates: The Integration View belongs to the Application layer of the architecture and is as such related to the Application Architecture Diagram, the Data Flow Diagram and the Component Diagram.

Properties and metadata: The Integration View template can for example retain the following information:

  • A description of the model
  • Audits (auto generated information regarding its current state and access rights)
  • Associated documents, diagrams and other objects
  • Inherent Risk detailing risk considerations
  • Governance information detailing information about the published diagram and who has been involved in the approval of the diagram

The above picture shows the properties dialogue window for the Integration View template where you can view and edit the diagram’s properties in QualiWare Lifecycle Manager.
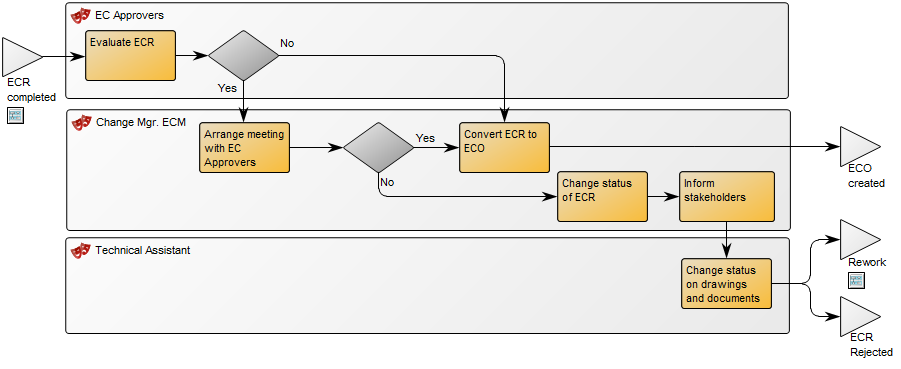
 

Innovation Canvas

Purpose: The Purpose of the Innovation Canvas is to model ideas for Innovation detailing their goals and ideas for action.

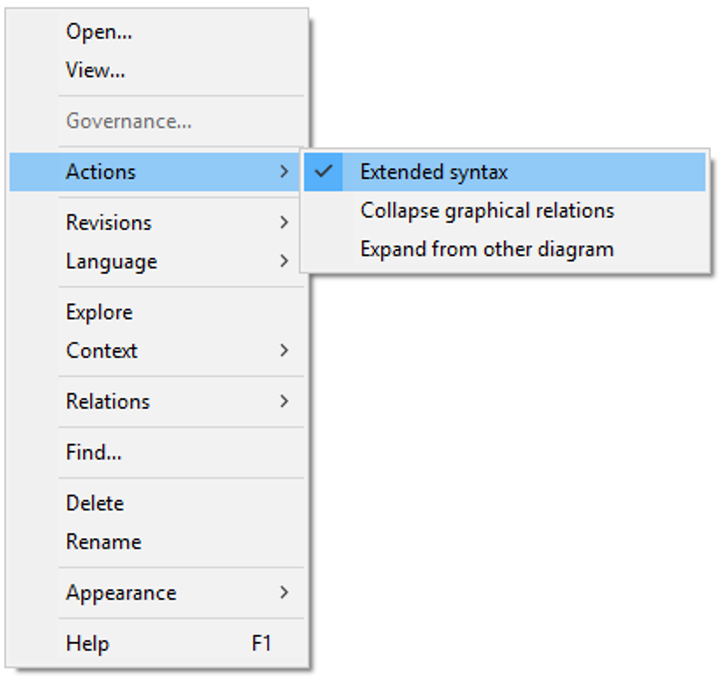
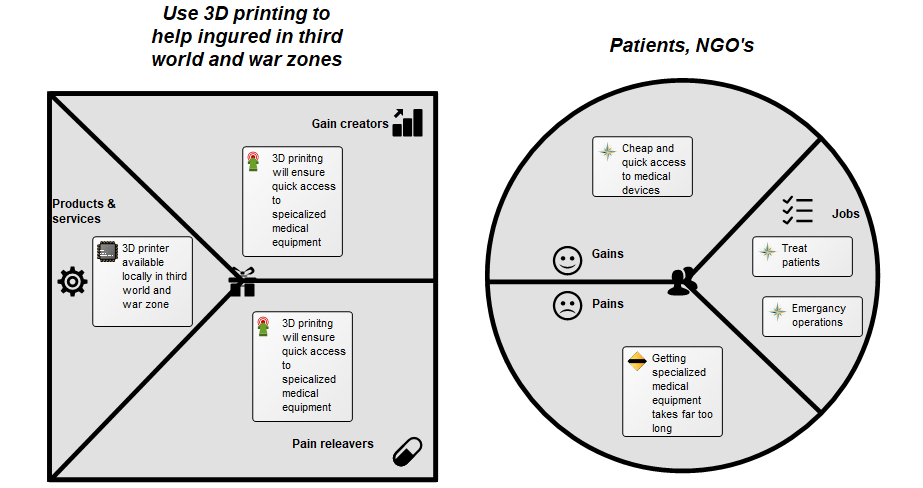
Core concerns: The Innovation Canvas allows you to model an innovation detailing the ideas that exist in relation to it. In the example below, the goals of the innovation have also been defined and attached. Goals, vision, mission and many more strategic objects are available in the default extended syntax for the diagram, enabling you to model your ideas for innovation in as much detail as you prefer.

Relation to other templates: The Innovation Canvas is a strategic template and the elements modelled in it can easily be connected to other strategic templates such as a Strategy Model, Enterprise Investment Portfolio, Business Canvas or Business Capability Model.

Properties and metadata: The Innovation Canvas can for example retain the following information:

  • A description of the diagram
  • Link to the owner of the diagram
  • Link to the one responsible for the accuracy of the diagram
  • Audits (auto generated information regarding its current state and access rights)
  • Associated documents, diagrams and other objects
  • Inherent Risk detailing risk considerations
  • Governance information detailing information about the published diagram and who has been involved in the approval of the diagram
  • Project status: information about budgeted and actual man-hours spent, percentage completed and the latest milestone, result and quality control of a change process.

In the picture below you can see the Innovation Canvas’ properties dialogue window, where the properties can be viewed and edited:

Infrastructure Diagram

Purpose: The purpose of the Infrastructure Diagram template is to document the physical infrastructure of the enterprise, which includes but is not limited to databases, wires, firewalls, computers etc.

Core concerns: The Infrastructure Diagram enables you to model your organizations infrastructure including: Computer Categories, Computers, Firewalls, Printers, Networks, Connection Points, Peripherals, Locations, Information Systems, System Components, Databases, Network Connections, Object Dependencies, Technology Domains, Technology Capabilities and Technology Components.

The models below exemplify how you would construct this type of diagram:

InfraStructureDiagram_1

InfraStructureDiagram_2

Relation to other templates: The Infrastructure Diagram template should not be used to document logical architecture, as the connections available in an Infrastructure Diagram are predominately geared towards documenting physical information about IT infrastructure. The Infrastructure Diagram can through its components be linked to other architectural diagrams such as the Application Architecture Diagram, and the data they contain. This way, if a firewall is breached, you would be able to very quickly identify what data has been vulnerable.

Properties and metadata: The Infrastructure Diagram can for example retain the following information:

  • A description of the diagram
  • Link to the owner of the diagram
  • Link to the one responsible for the diagram
  • Audits (auto generated information regarding its current state and access rights)
  • Associated documents, diagrams and other objects
  • Inherent Risk detailing risk considerations
  • Governance information detailing information about the published diagram and who has been involved in the approval of the diagram


The above picture shows the properties dialogue window for the Infrastructure Diagram, where you can view and edit the diagram’s properties in QualiWare Lifecycle Manager.
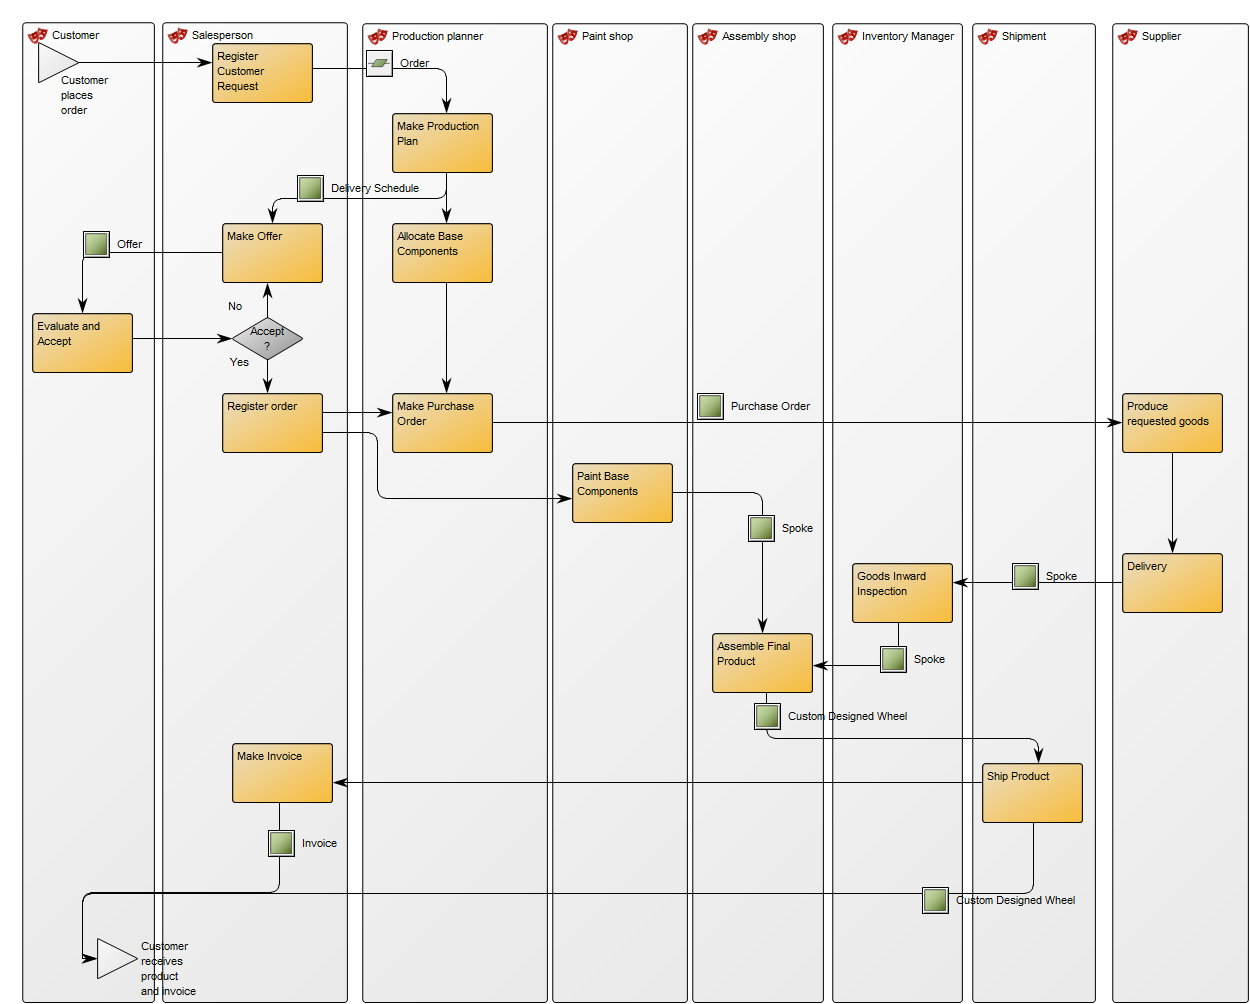
Hierarchy View

Purpose: The purpose of the Hierarchy View template is to show the hierarchy of objects related to a chosen root object.

Core concerns: The root object in the hierarchy View can for example be a Capability or a Business Process. The view is not modeled as a diagram, but generated based on information specified in the template’s property dialog, making the scope of the view flexible. Below, you can see an examples of a Hierarchy View for the Capability “Market Objects”:

Relation to other templates: The Hierarchy View is not directly connected to any single template but is not unlike a Context View. The Hierarchy View is, compared to a Context View, usually filtered to only show certain types of relations amongst certain types of objects and not as a default connected to diagram templates:

Properties and metadata: The Hierarchy View template can for example retain the following information:

  • A description of the diagram
  • Link to the owner of the Hierarchy View
  • Link to the one responsible for the Hierarchy View
  • Audits (auto generated information regarding its current state and access rights)
  • Specifications (definition of root object and other inclusion criteria)
  • Adjust (specification of templates that should be removed from the view)
  • Associated documents, diagrams and other objects
  • Inherent Risk detailing risk considerations
  • Governance information detailing information about the published diagram and who has been involved in the approval of the diagram

The above picture shows the properties dialogue window for the Hierarchy View template where you can view and edit the diagram’s properties in QualiWare Lifecycle Manager.
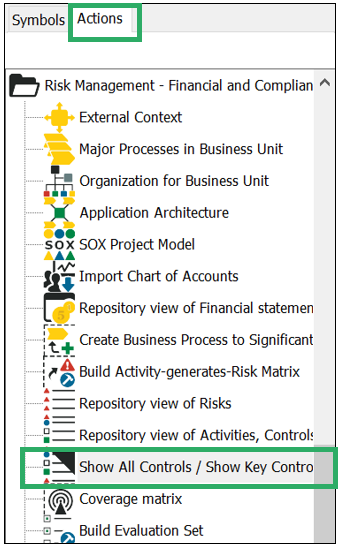
The HierachyView can be used in relation to the Standard Tree View in the HTMLPublisher, to establish a hierarchy for the network of process models in a repository.

Heatmap

Purpose: The purpose of the Heat Map template is to document a representation of values from other QualiWare templates in the form of a Heat Map.

Core concerns: The Heat Map template is created using the Risk Management and Application Portfolio Management toolbars in a diagrams action tab in QLM. It can afterwards be found under the Heat Map template in the repository explorer window.

The Heat Map template can, for example be used to document risks, identify the most pressing ones. Additionally, Heat Maps can be used to identify systems that don’t live up to business or technical criteria.

Below, you can see two examples of Heat Maps for risks. The first shows two risks and how they compare to each other with regards to significance and likelihood:

HeatMap_2

The second Heat Map shows four risks as well as their residual risks, and how they compare to each other regarding likelihood and significance:

HeatMap_1

Relation to other templates: The Heat Map can for example be generated from data gathered from a Business Process Network, Workflow Diagram, Business Process Diagram, Application Architecture Diagram or a Strategy Model.

Properties and metadata: The Heat Map template ­­­­can for example retain the following information:

  • A description of the diagram
  • Link to the owner
  • Link to the responsible
  • Audits (auto generated information regarding its current state and access rights)
  • Associated documents, diagrams and other objects
  • Inherent Risk detailing risk considerations
  • Governance information detailing information about the published diagram and who has been involved in the approval of the model

The above picture shows the properties dialogue window for the Heat Map template, where you can view and edit the template’s properties in QualiWare Lifecycle Manager.
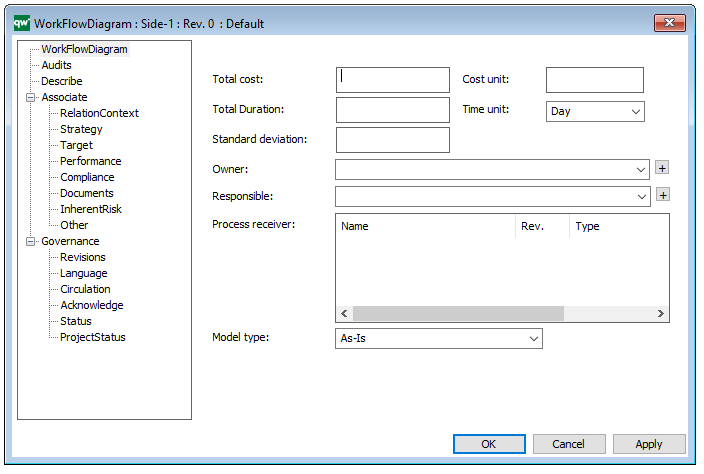
To learn how to build Heat Maps in QualiWare click here

Graphical Matrix

Purpose: The purpose of the Graphical Matrix template is to compare the states or scores of objects, such as for example Capabilities or Information Systems.

Core concerns: The Graphical Matrix is generated based on information inserted into its property dialog where input, x-axis and y-axis are defined. Below, you can see an example of a Graphical Matrix for capabilities, scoring their quality and timeliness:

GraphicalMatrix_1

Relation to other templates: When scoring risks and visualizing residual risks, you can use a Heatmap.

Properties and metadata: The Graphical Matrix template can for example retain the following information:

  • A description
  • Link to the source of the input
  • Coordinate definitions of the Graphical Matrix
  • Audits (auto generated information regarding its current state and access rights)
  • Associated documents, diagrams and other objects

The above picture shows the properties dialogue window for the Graphical Matrix, where you can view and edit the diagram’s properties in QualiWare Lifecycle Manager. Below, you can see the tab for Coordinate Definition: