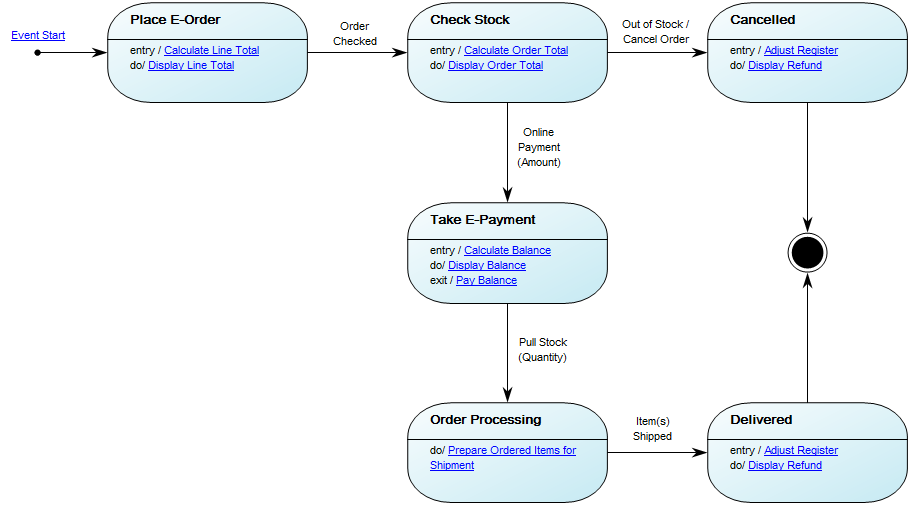
Purpose: The purpose of the State Event Diagram template is to document the time dependent behavior of a system by showing the different States and State Transitions a system can go through.
Core concerns: The State Event Diagram enables you to model States and connect them with State Transitions. The State can be manipulated by opening its properties dialog and chose ‘Final State’ to illustrate the end of the state. The Start event is created by choosing ‘Start’ in the properties of the State Transition.
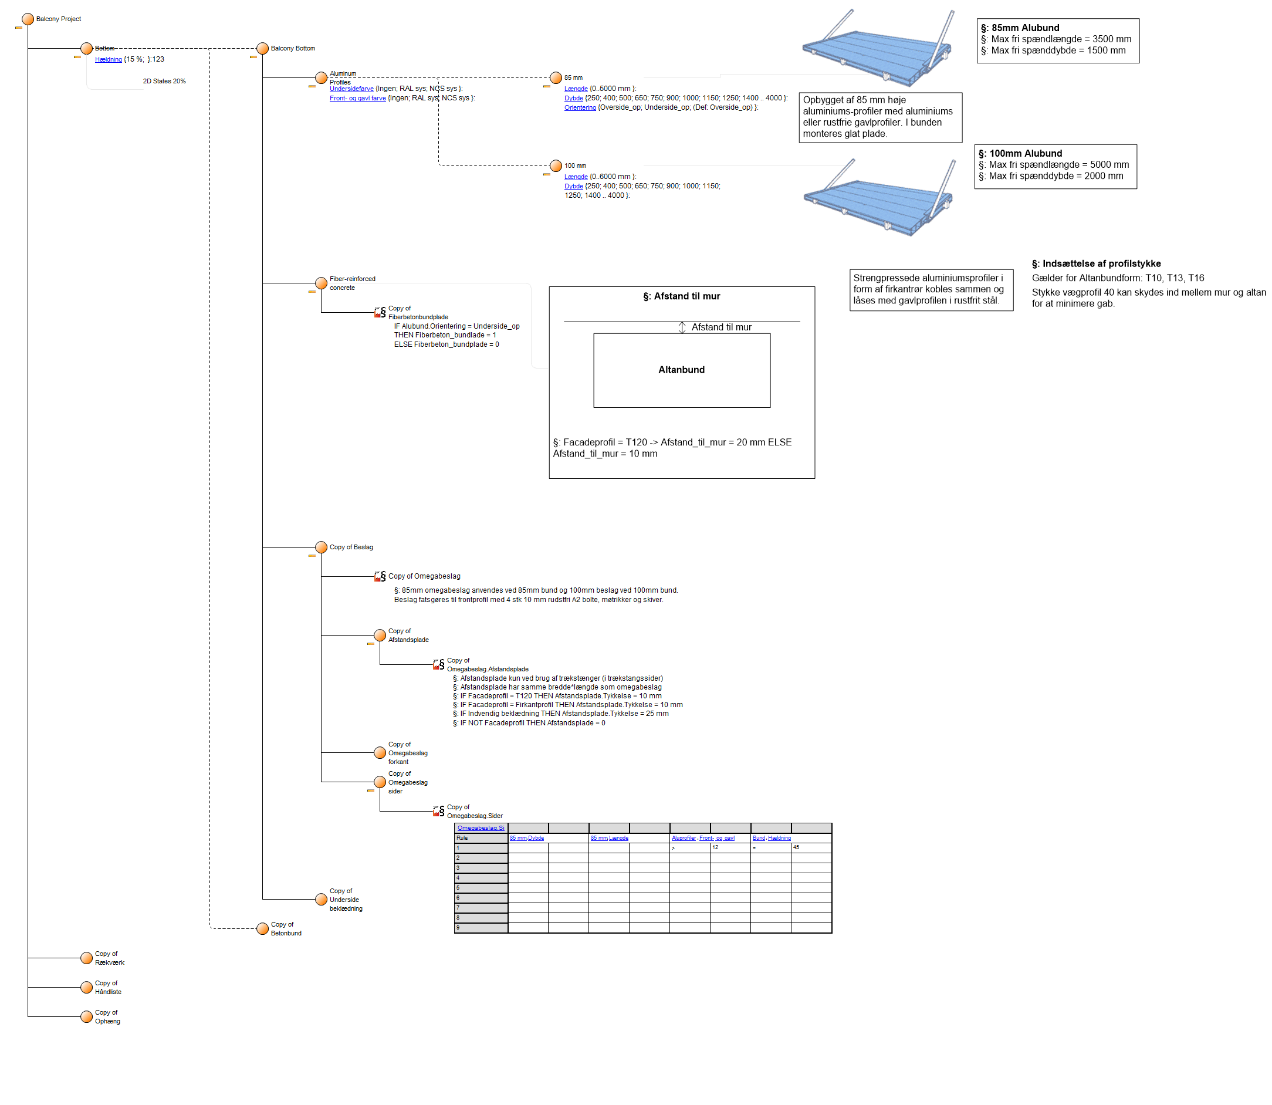
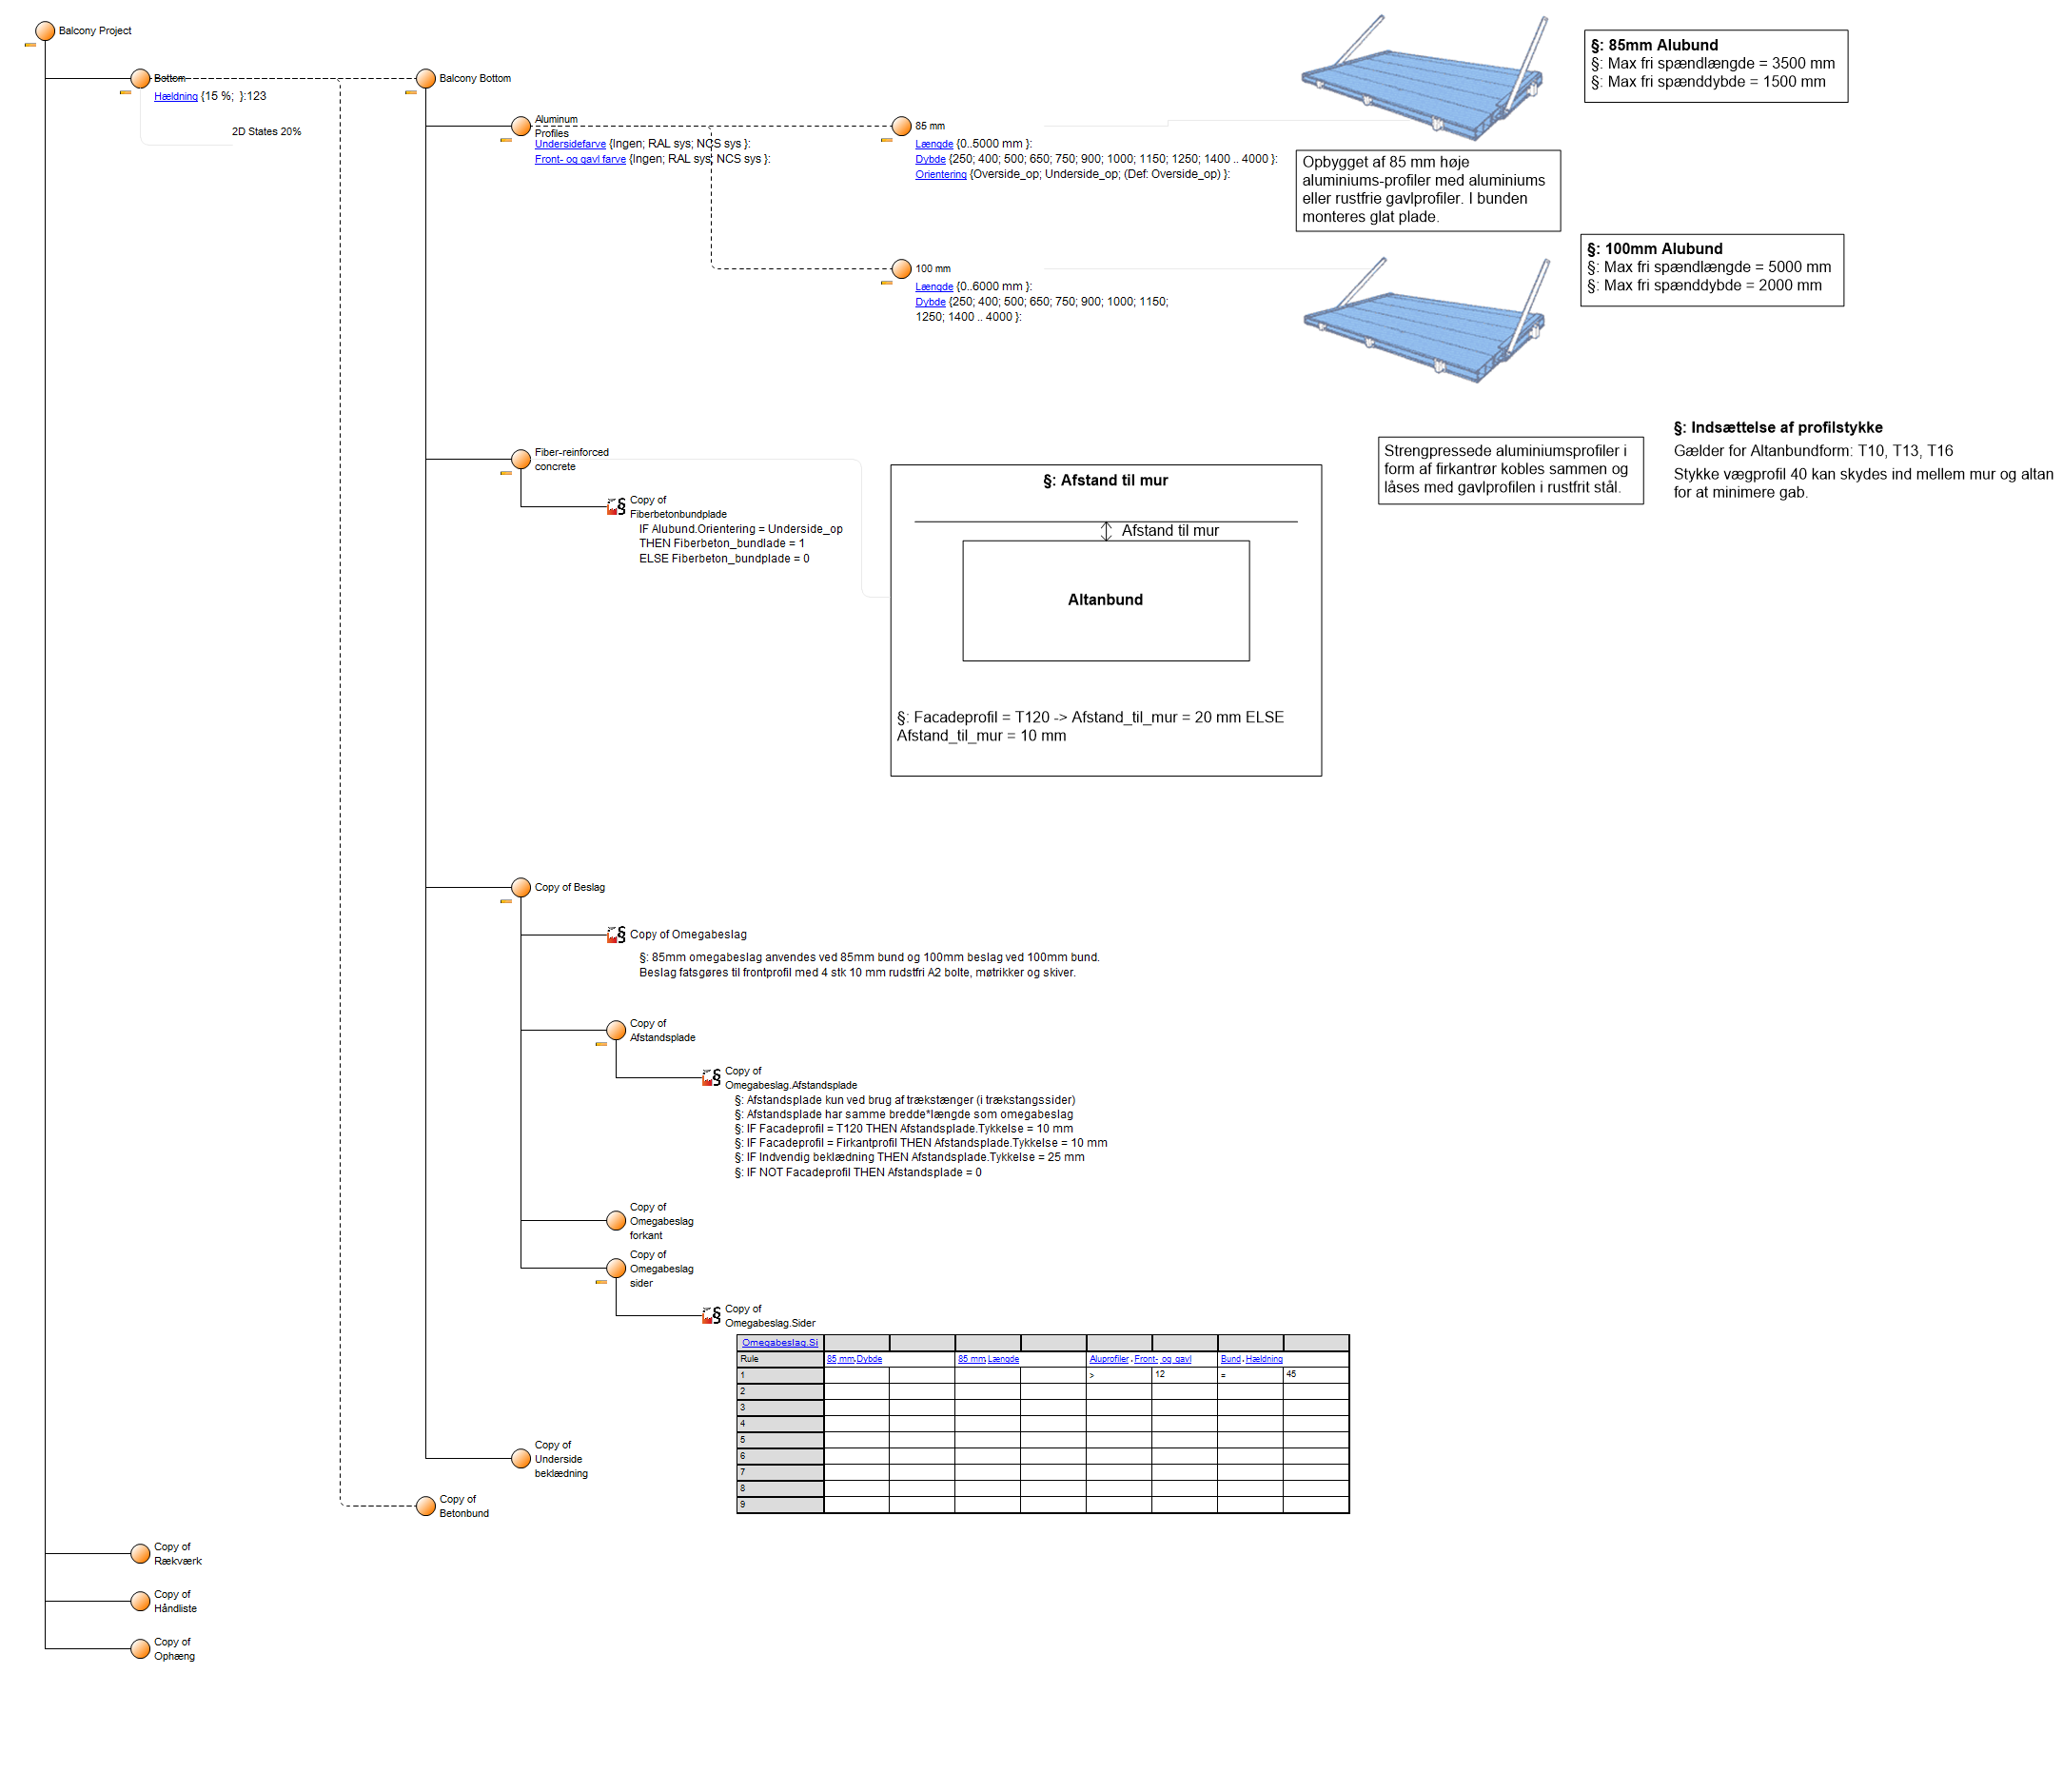
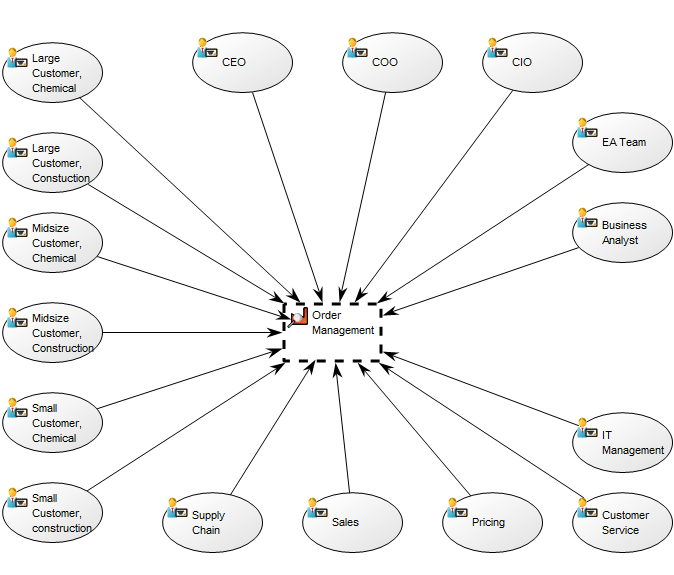
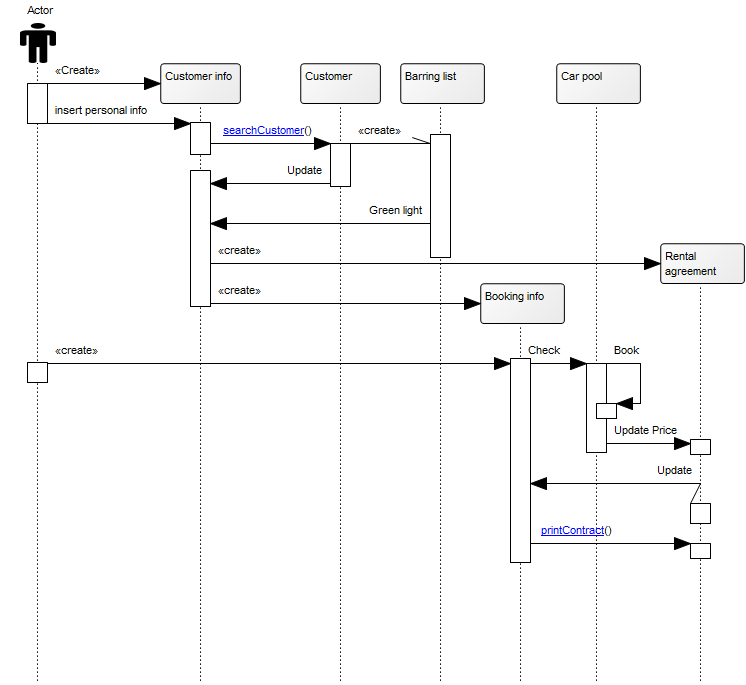
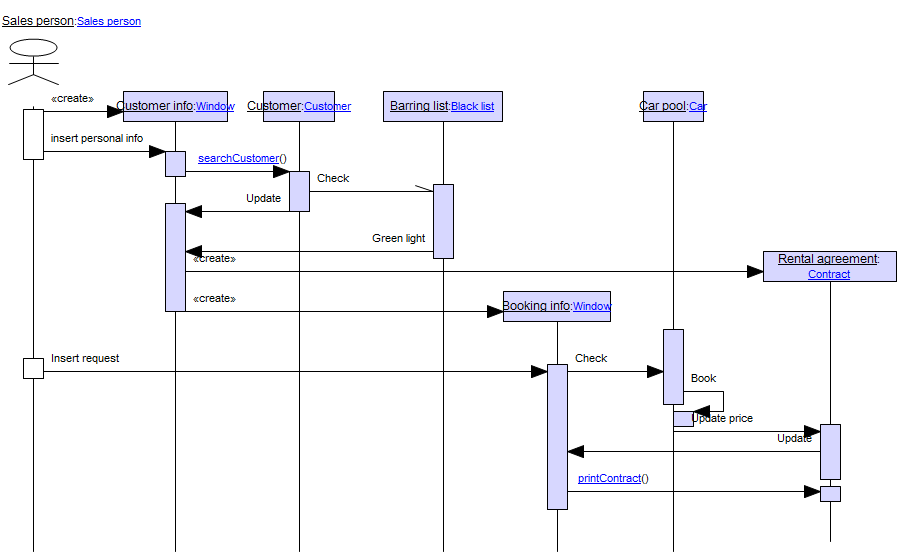
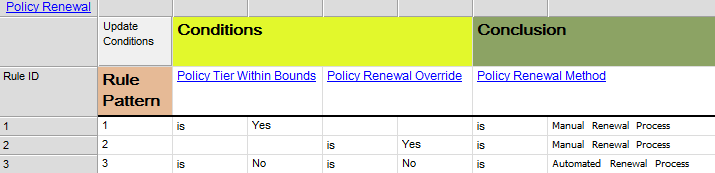
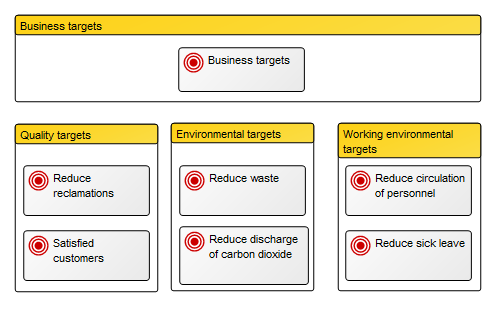
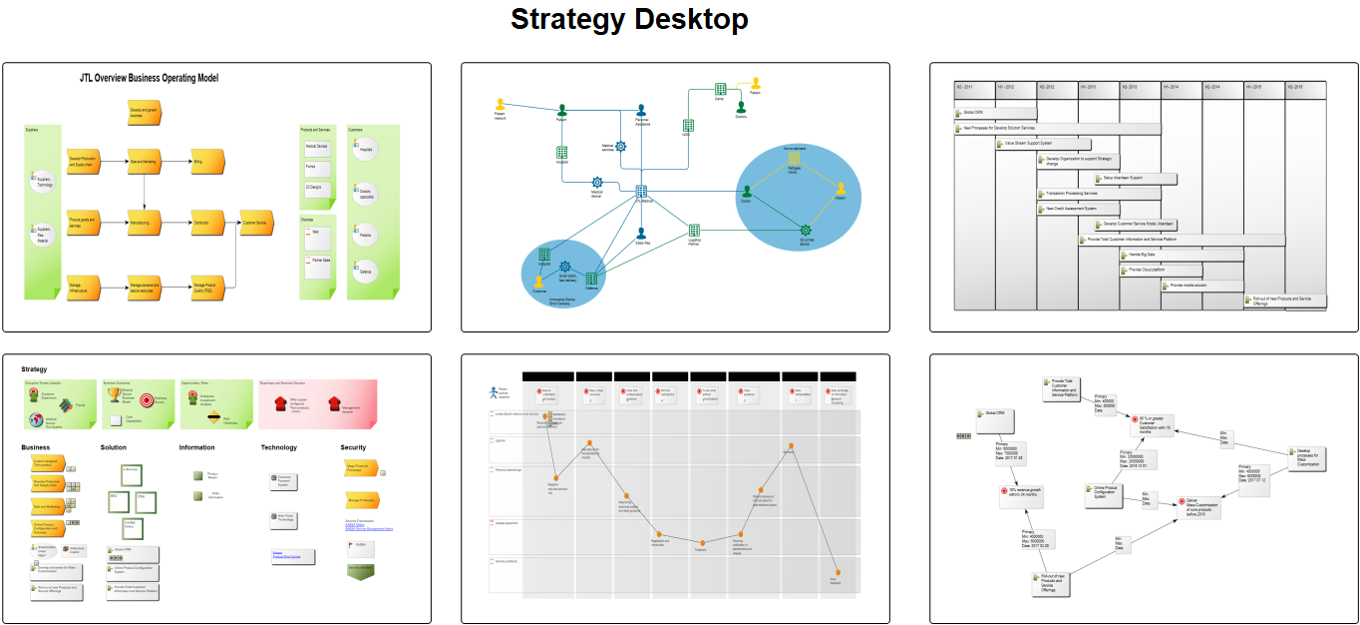
Below, you can see an example of a State Event Diagram for an ordering system:

Relation to other templates: The State Event Diagram template should not be used to model Machines States. The State Machine Diagram template should be used to model these types of diagrams instead. The State Event Diagram offers a view of a system which is complimentary to those presented by for example, Use Case Diagrams Communication Diagrams, Component diagrams and Sequence Diagrams.
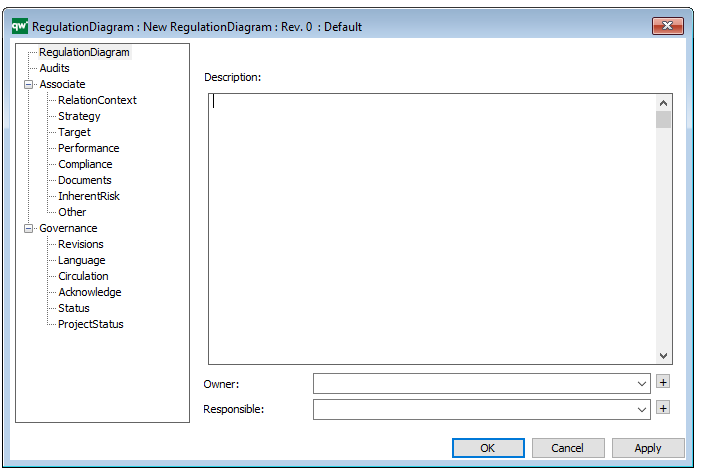
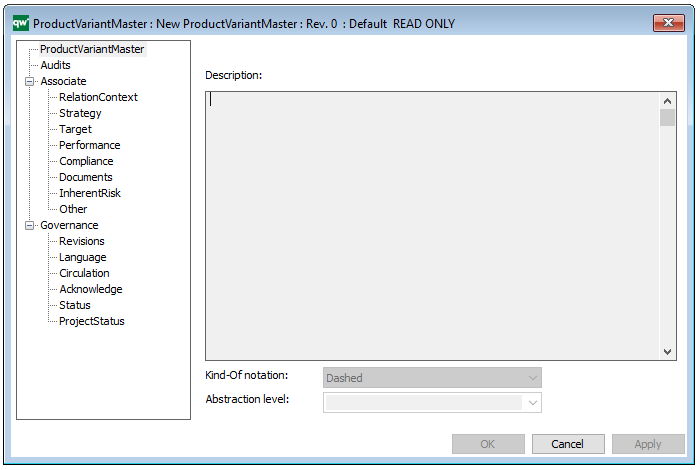
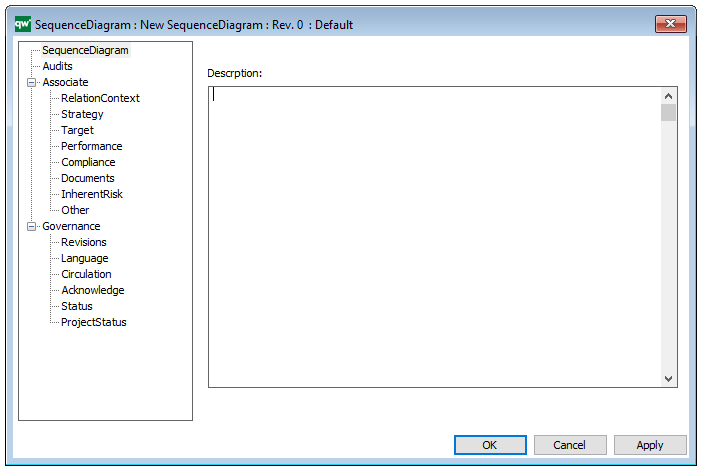
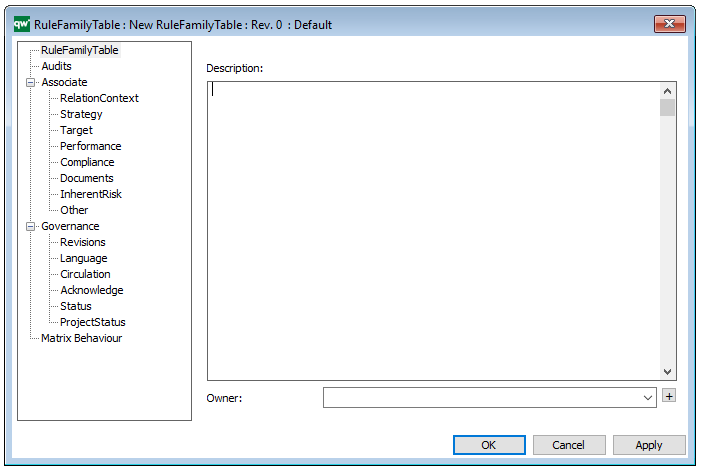
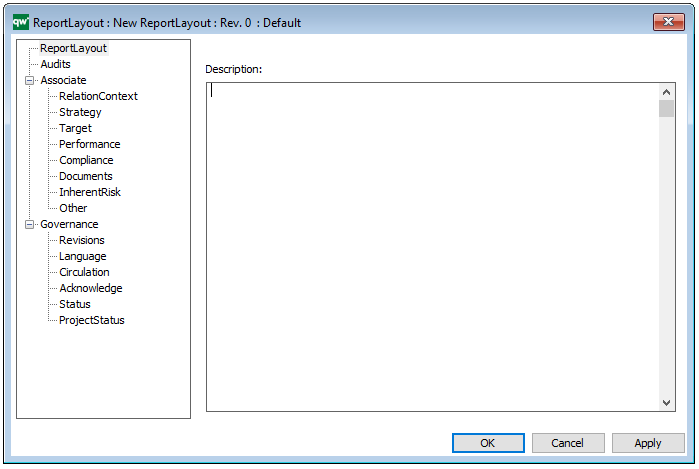
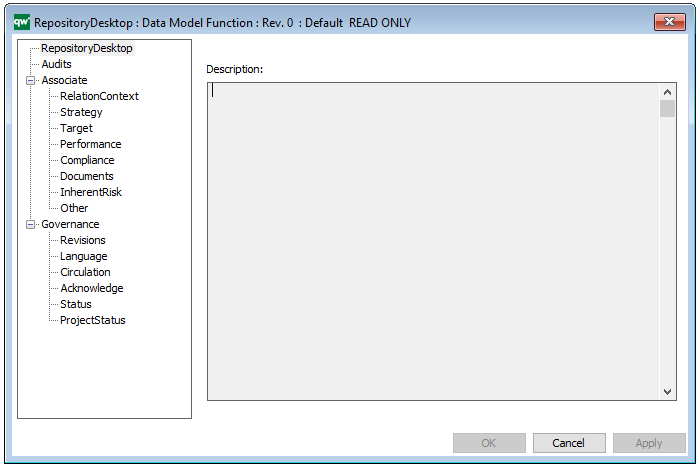
Properties and metadata: The State Event Diagram template can for example retain the following information:
- A description of the diagram
- Link to the owner of the diagram
- Link to the one responsible for the diagram
- Audits (auto generated information regarding its current state and access rights)
- Associated documents, diagrams and other objects
- Inherent Risk detailing risk considerations
- Governance information detailing information about the published diagram and who has been involved in the approval of the diagram
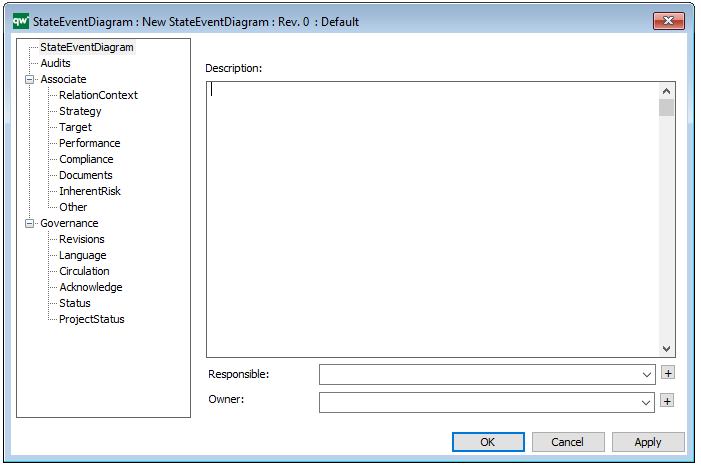
The above picture shows the properties dialogue window for the State Event Diagram template, where you can view and edit the diagram’s properties in QualiWare Lifecycle Manager.


 Relation to other templates: As mentioned, the regulations can be linked to the relevant Business Processes or Activities, that typically are detailed in a