Innovation Canvas

Purpose: The Purpose of the Innovation Canvas is to model ideas for Innovation detailing their goals and ideas for action.

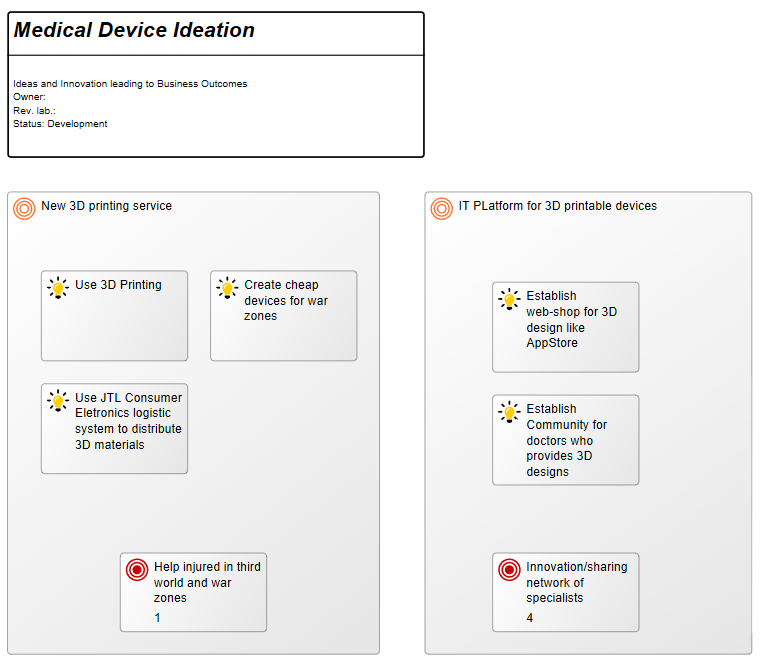
Core concerns: The Innovation Canvas allows you to model an innovation detailing the ideas that exist in relation to it. In the example below, the goals of the innovation have also been defined and attached. Goals, vision, mission and many more strategic objects are available in the default extended syntax for the diagram, enabling you to model your ideas for innovation in as much detail as you prefer.

Relation to other templates: The Innovation Canvas is a strategic template and the elements modelled in it can easily be connected to other strategic templates such as a Strategy Model, Enterprise Investment Portfolio, Business Canvas or Business Capability Model.

Properties and metadata: The Innovation Canvas can for example retain the following information:

  • A description of the diagram
  • Link to the owner of the diagram
  • Link to the one responsible for the accuracy of the diagram
  • Audits (auto generated information regarding its current state and access rights)
  • Associated documents, diagrams and other objects
  • Inherent Risk detailing risk considerations
  • Governance information detailing information about the published diagram and who has been involved in the approval of the diagram
  • Project status: information about budgeted and actual man-hours spent, percentage completed and the latest milestone, result and quality control of a change process.

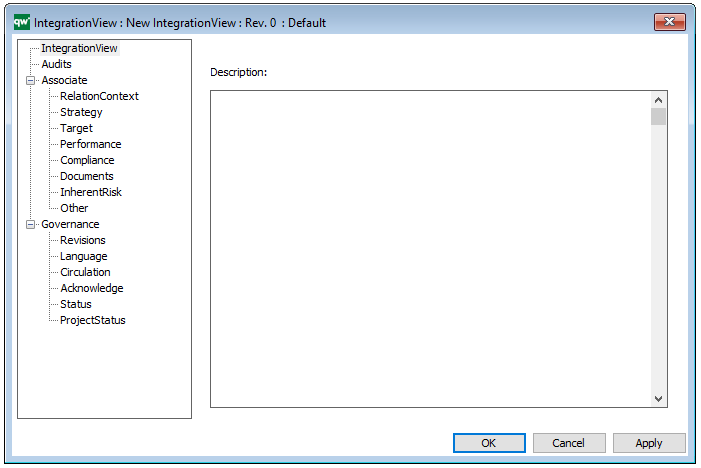
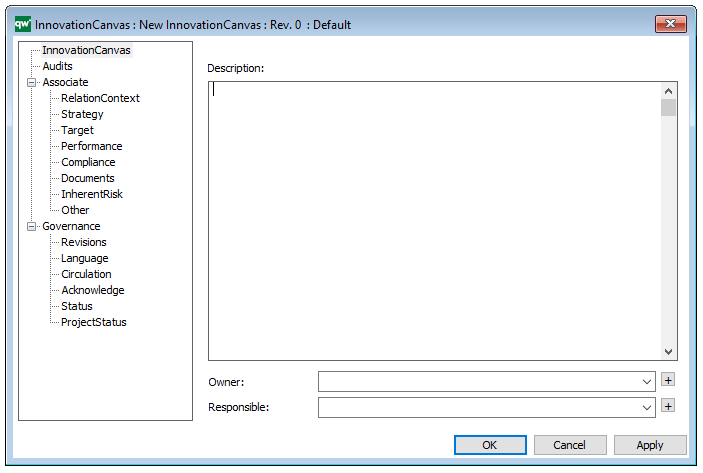
In the picture below you can see the Innovation Canvas’ properties dialogue window, where the properties can be viewed and edited:

Infrastructure Diagram

Purpose: The purpose of the Infrastructure Diagram template is to document the physical infrastructure of the enterprise, which includes but is not limited to databases, wires, firewalls, computers etc.

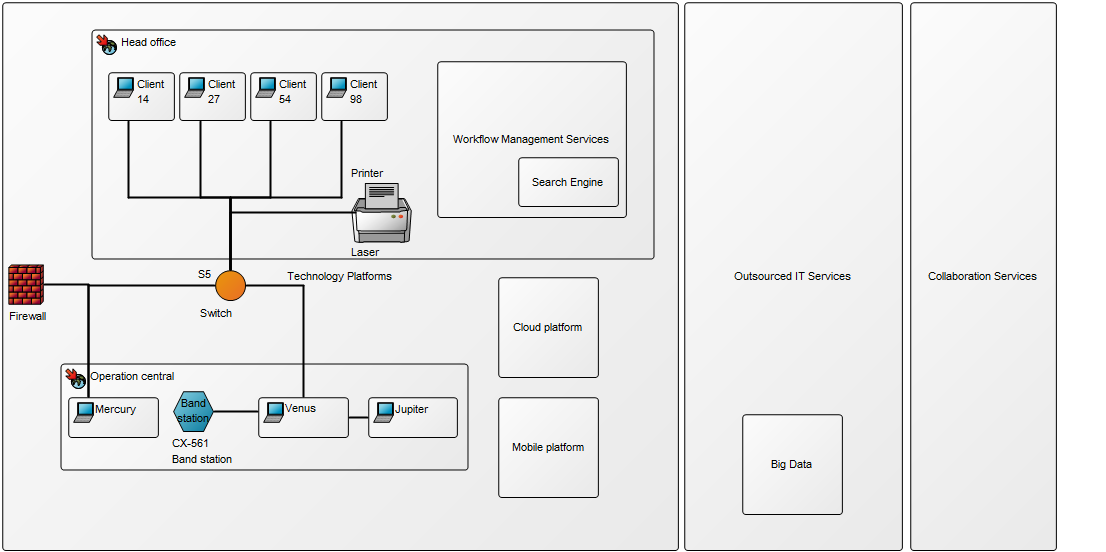
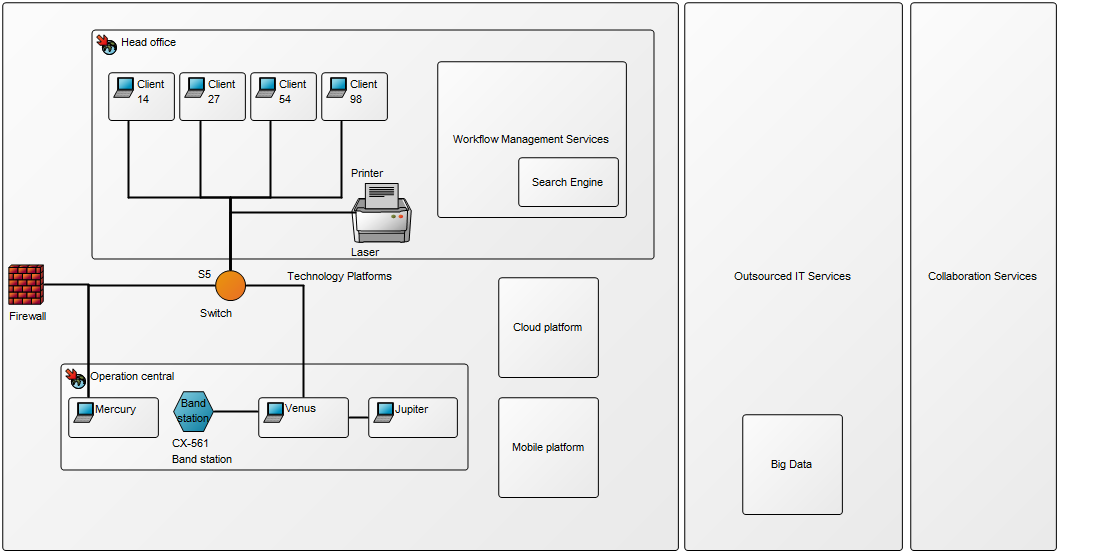
Core concerns: The Infrastructure Diagram enables you to model your organizations infrastructure including: Computer Categories, Computers, Firewalls, Printers, Networks, Connection Points, Peripherals, Locations, Information Systems, System Components, Databases, Network Connections, Object Dependencies, Technology Domains, Technology Capabilities and Technology Components.

The models below exemplify how you would construct this type of diagram:

InfraStructureDiagram_1

InfraStructureDiagram_2

Relation to other templates: The Infrastructure Diagram template should not be used to document logical architecture, as the connections available in an Infrastructure Diagram are predominately geared towards documenting physical information about IT infrastructure. The Infrastructure Diagram can through its components be linked to other architectural diagrams such as the Application Architecture Diagram, and the data they contain. This way, if a firewall is breached, you would be able to very quickly identify what data has been vulnerable.

Properties and metadata: The Infrastructure Diagram can for example retain the following information:

  • A description of the diagram
  • Link to the owner of the diagram
  • Link to the one responsible for the diagram
  • Audits (auto generated information regarding its current state and access rights)
  • Associated documents, diagrams and other objects
  • Inherent Risk detailing risk considerations
  • Governance information detailing information about the published diagram and who has been involved in the approval of the diagram


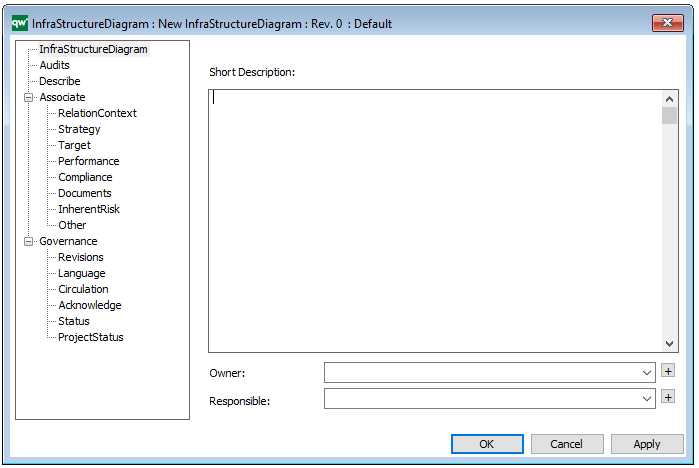
The above picture shows the properties dialogue window for the Infrastructure Diagram, where you can view and edit the diagram’s properties in QualiWare Lifecycle Manager.
Freehand Diagram

Purpose: The purpose of the Free Hand Diagram template is to document using drawings that do not match any of the other structured diagram templates.

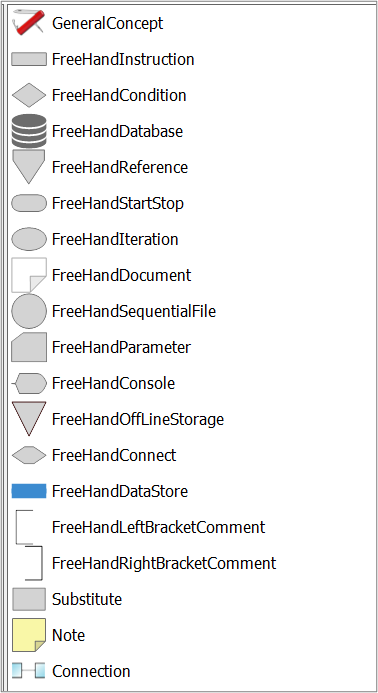
Core concerns: The Freehand Diagram template enables you to, for example, insert a General Concept, paste a picture file on it and describe it using Freehand symbols. You can also link to other diagrams from it. The Freehand symbols used can be placed either on or behind the Picture you choose and present information or links when clicked on.

Objects available in the Freehand Diagram template:

The Free Hand Diagram template should not be used to document any information that can be documented in other templates.

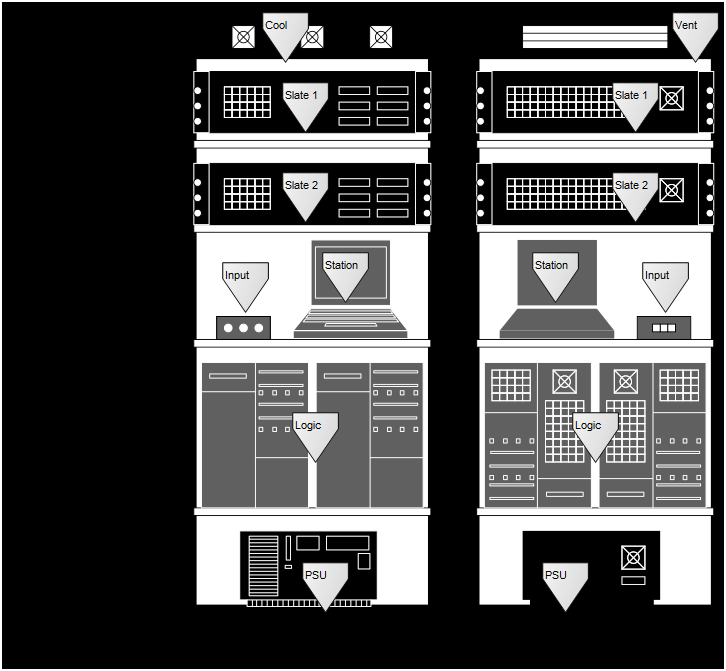
Below, you can see two examples of Freehand Diagrams, where the Freehand Objects are made visible:

FreeHandDiagram_1

FreeHandDiagram_2

Relation to other templates: The Freehand Diagram can, because of its flexibility, be related to any of QualiWare’s diagram templates. It can be a decomposition of Logistical Flows, Business Functions, Lines of Buisness, Business Scopes, Activities, Inventory and Information Systems.

Properties and metadata: The Freehand Diagram template ­­­­can for example retain the following information:

  • A description of the diagram
  • Link to the owner of the diagram
  • Link to the one responsible for the diagram
  • Audits (auto generated information regarding its current state and access rights)
  • Associated documents, diagrams and other objects
  • Inherent Risk detailing risk considerations
  • Governance information detailing information about the published diagram and who has been involved in the approval of the diagram

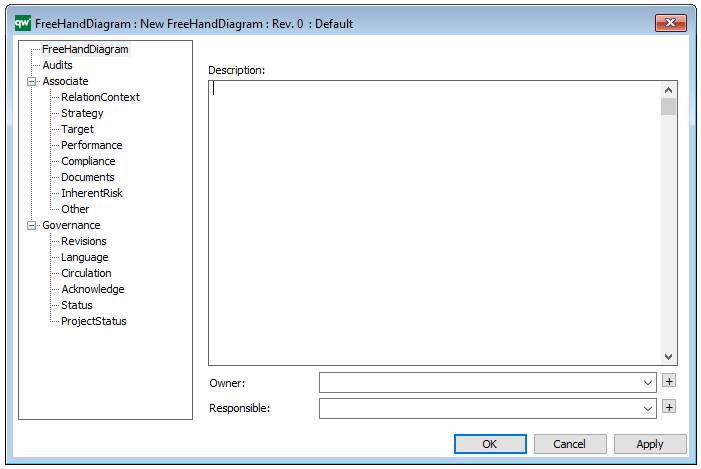
The above picture shows the properties dialogue window for the Freehand Diagram template, where you can view and edit the diagram’s properties in QualiWare Lifecycle Manager.
Firewall

Purpose: The purpose of the Firewall template is to document network zones designated by firewalls.

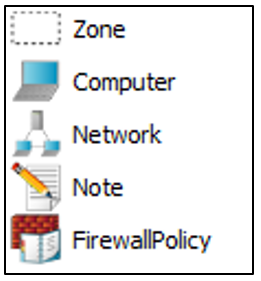
Core concerns: The Firewall template enables you to model Zones, Computers, Networks and Firewall Policies to create a model of a firewall. A firewall is used to control the communication between different networks, typically for security reasons.

Graphical representation of objects:

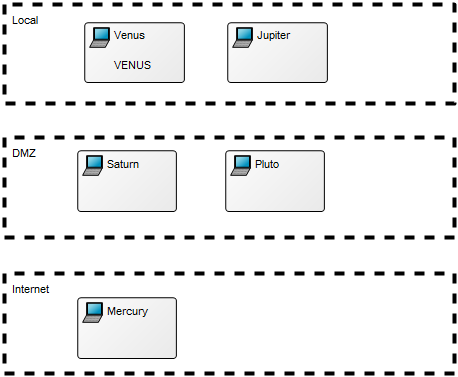
A Firewall diagram will typically show the Zones of the firewall and the communication policies/rules (Firewall Policies) that exist between the zones. Below, you can see an example of a Firewall diagram containing Zones and Servers (represented by the Computer object):

Firewall_1

Relation to other templates: The Firewall template is a technology template and related to the Infrastructure Diagram.

Properties and metadata: The Firewall template ­­­­can for example retain the following information:

  • A description of the diagram
  • Link to Vendor and Hardware
  • Link to servers
  • Contract information
  • Details about resources, costs and benefits
  • Audits (auto generated information regarding its current state and access rights)
  • Associated documents, diagrams and other objects
  • Inherent Risk detailing risk considerations
  • Governance information detailing information about the published diagram and who has been involved in the approval of the diagram


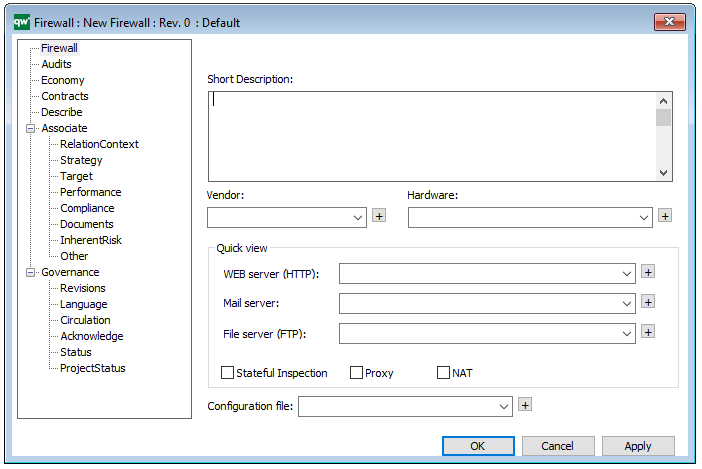
The above picture shows the properties dialogue window for the Firewall template, where you can view and edit the diagram’s properties in QualiWare Lifecycle Manager.
Environmental Impact Diagram

Purpose: The purpose of the Environmental Impact Diagram template is to document the environmental aspects and impacts for an Activity or Business Process.

Core concerns: The Environmental Impact Diagram enables you to model Business Functions, Activities, Business Objects, Environmental Aspects (Environmental Aspect, Environmental Impact, Health and safety impact) and Business Scopes. These elements can then be connected by Impact Quantities.

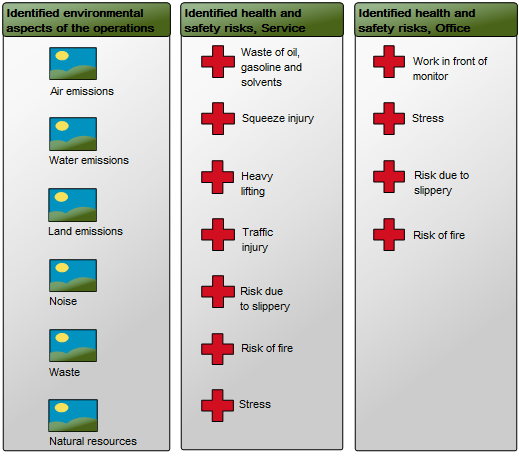
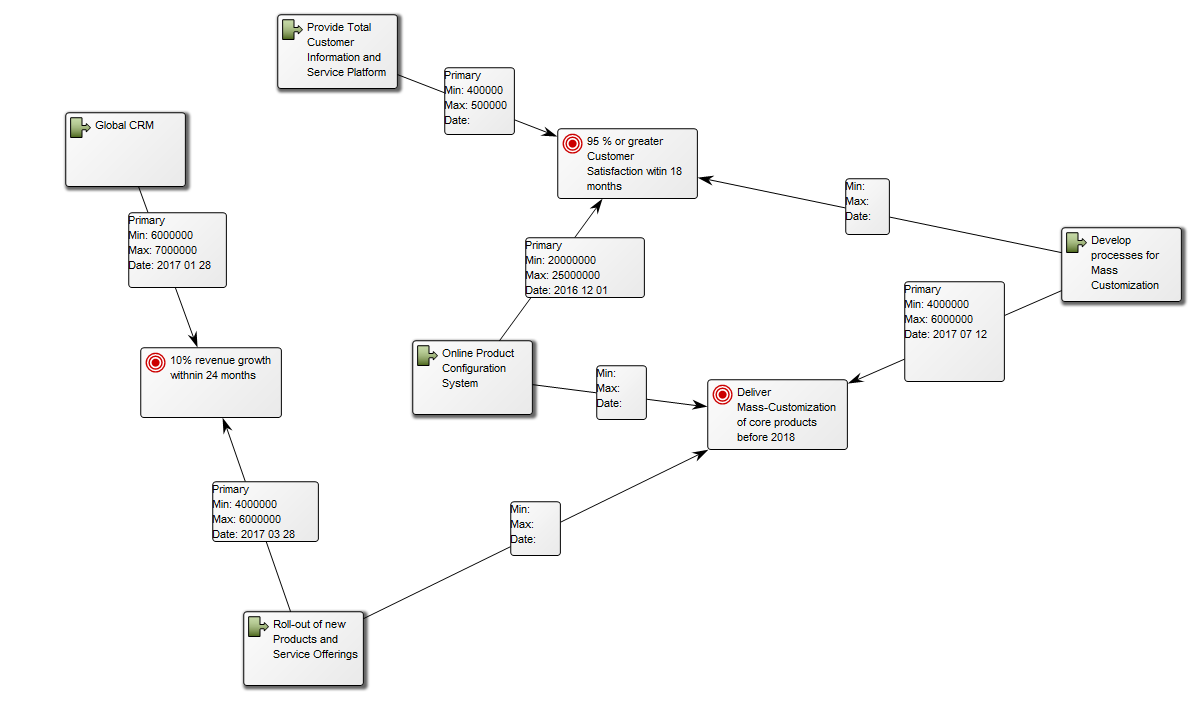
Below, you can see an example of an Environmental Impact Diagram, detailing the Environmental aspects and Health and safety impact:

EnvironmentalImpactDiagram_1

The diagram shows all identified aspects and modes of impact for one or more specific processes.

Relation to other templates: The Environmental Impact Diagram is related to the Lifecycle Assessment diagram as well as templates containing Activities, Business Functions, Lines of Business, and Logistical Flows. As such, it is related to, for example, Business Process Diagrams, Workflow Diagrams, Business Diagrams, and Strategy Models.

Properties and metadata: The Environmental Impact Diagram template ­­­­can for example retain the following information:

  • A description of the diagram
  • Link to the owner
  • Link to the responsible
  • Audits (auto generated information regarding its current state and access rights)
  • Associated documents, diagrams and other objects
  • Inherent Risk detailing risk considerations
  • Governance information detailing information about the published diagram and who has been involved in the approval of the diagram

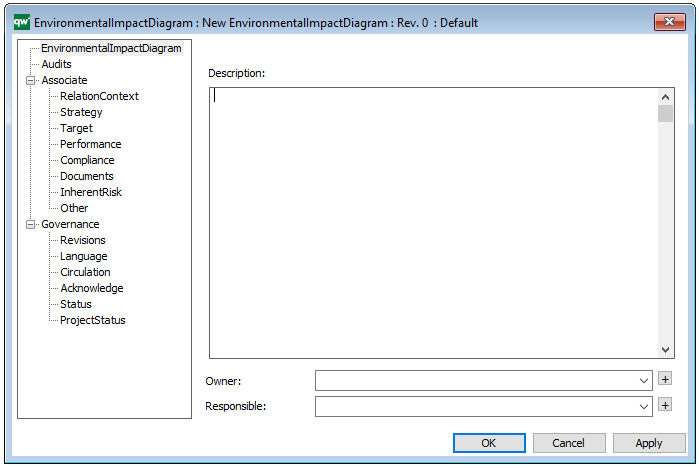
The above picture shows the properties dialogue window for the Environmental Impact Diagram, where you can view and edit the diagram’s properties in QualiWare Lifecycle Manager.

Enterprise Investment Portfolio

Purpose: The purpose of the Enterprise Investment Portfolio template is to model enterprise goals and investments.

Core concerns: The Enterprise Investment Portfolio template enables you to model Goals, Projects, and Initiatives. The projects and initiatives can be connected to enterprise goals them through Project Contributions, that show the viable minimum and optimistic maximum of the value contribution. Below, you can see an example of an Enterprise Investment Portfolio, where the way goals are realized is visualized:


EnterpriseInvestmentPortfolio_1

Other Functionalities: By using the Enterprise Investment Actions tab, you can create, for example, a Portfolio Value matrix, which offers another way to view the same data:

Relation to other templates: The Enterprise Investment Portfolio is a strategic template and is as such related to the enterprise’s Strategy Model, Strategic Roadmap, Business Canvas and Innovation Canvas. The projects contained in the initiatives can also be further described in the Work Model template.

Properties and metadata: The Enterprise Investment Portfolio template can for example retain the following information:

  • A description of the diagram
  • Link to the owner of the diagram
  • Link to the one responsible for the diagram
  • Audits (auto generated information regarding its current state and access rights)
  • Associated documents, diagrams and other objects
  • Inherent Risk detailing risk considerations
  • Governance information detailing information about the published diagram and who has been involved in the approval of the diagram

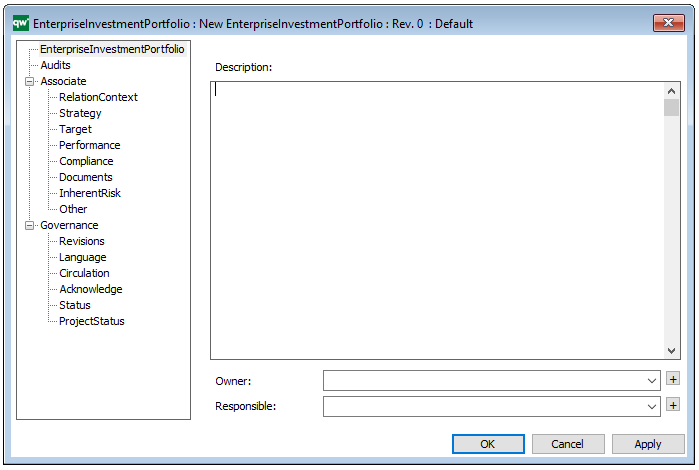
The above picture shows the properties dialogue window for the Enterprise Investment Portfolio template, where you can view and edit the diagram’s Properties in QualiWare Lifecycle Manager.
For more information: This model type is used in the Enterprise Investment Methodology developed by Chris Potts and QualiWare. To learn more about Enterprise Investment, you can about it here:Enterprise Investment.

Data Model Diagram

Purpose: The Purpose of the Data Model Diagram template is to model the structure of data entities of an Information System and their relationships. Documenting the structure of information is a very important part of the preliminary analysis before implementing any Information System.

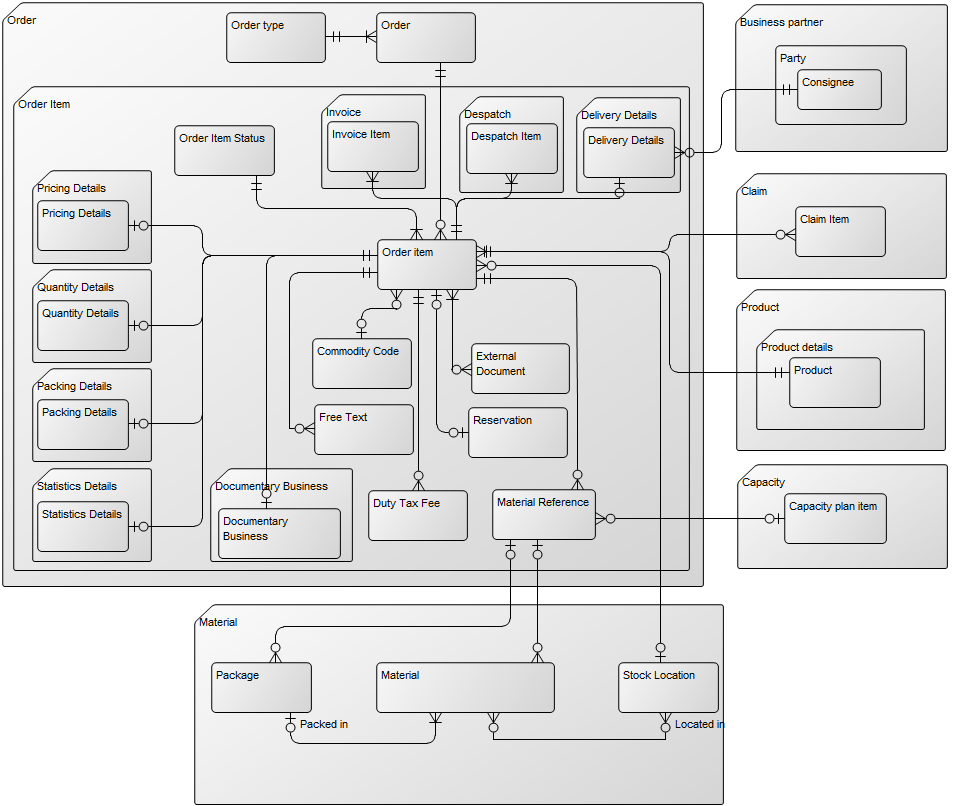
Core concerns: The Data Model Diagram template enables the user to document the structure of the information, that an Information System is supposed to store. The template allows you to model using Data Entities, Subject Area, Data Entity View, Model View and inheritance. The Connection types available are: Data Relation, Inheritance Connection, Complex Relation and Generalization. Below you can see an example of a Data Model Diagram describing the information structure related to an order:

DataModelDiagram_1

Relation to other templates: The Data Model Diagram template should not be used to document data flows. In that case the Data Flow Diagram template should be used.

Properties and metadata: The Data Model Diagram can for example retain the following information:

  • A description of the diagram
  • Link to the owner of the diagram
  • Link to the one responsible for the accuracy of the diagram
  • Audits (auto generated information regarding its current state and access rights)
  • Associated documents, diagrams and other objects
  • Inherent Risk detailing risk considerations
  • Governance information detailing information about the published diagram and who has been involved in the approval of the diagram
  • Project status: information about budgeted and actual man-hours spent, percentage completed and the latest milestone, result and quality control of a change process.

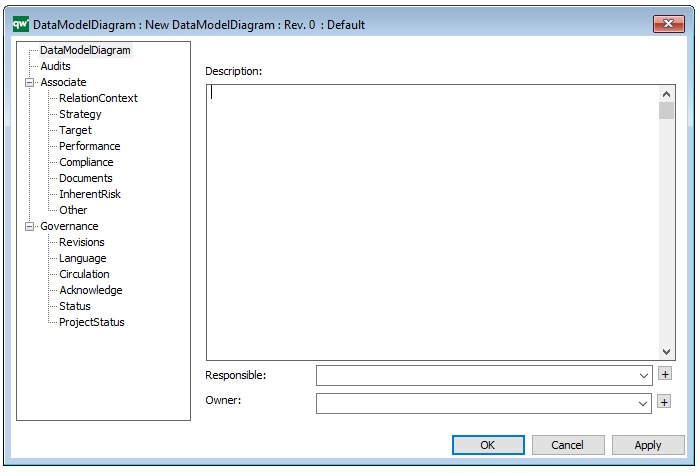
The above picture shows the properties dialogue window for the Data Model Diagram where you can view and edit the diagram’s properties.


Customer Journey Map

Purpose: The Purpose of the Customer Journey Map template is to document the customer’s journey from awareness to the end of their interaction with an organization, covering possible touch points from the customer’s perspective.

Core Concerns: The Customer Journey Map template allows you to model connections between different Personas, Customer Journey Phases, Touch Points, Goals, Roles, Locations, Channels, Technology and the aspects from a SWOT analysis.

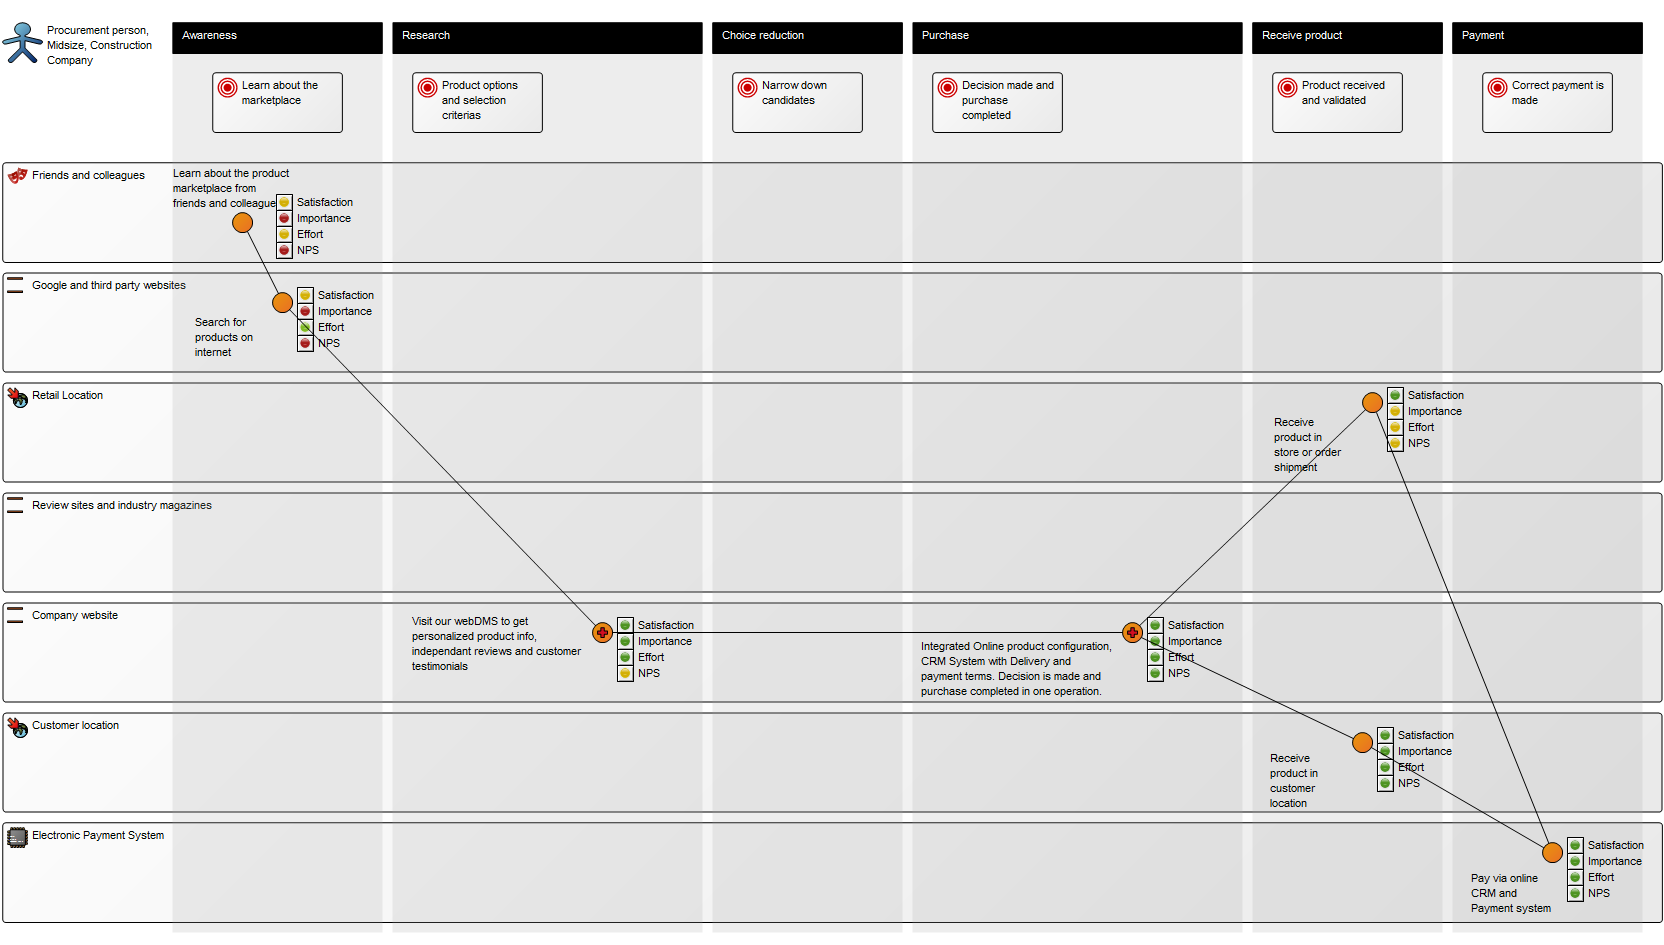
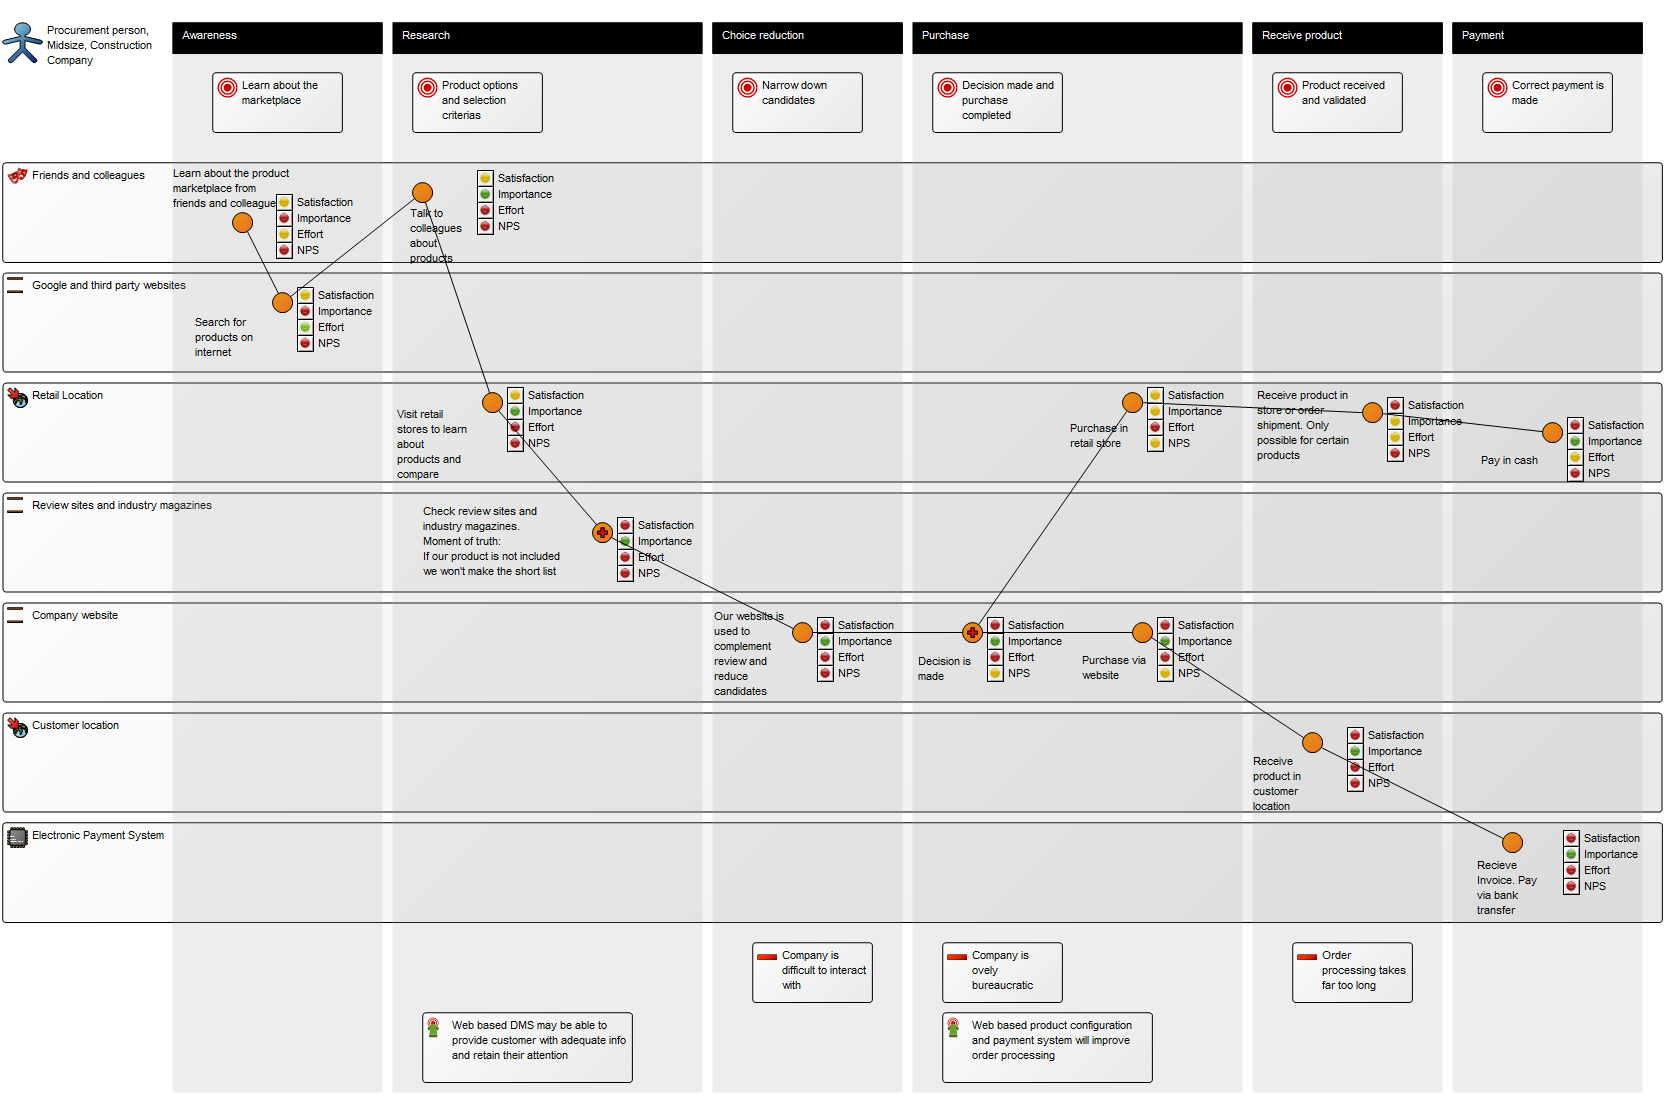
You can choose to model both a current state and a desired future state of the customer journey and use the documentation for process improvement. Below is an example of a current state model and a future state model:

Current state model:

CustomerJourneyMap_2

Desired future model:

CustomerJourneyMap_1

Other functionalities: The customer’s touchpoints can be elaborated upon with four scores for Customer Satisfaction, Customer Importance, Customer Effort and Net Promoter Score. Particularly vital touchpoints can be designated as a Moment of Truth.

Relation to other templates: The Customer Journey Map can be used as a groundwork for a strategic change, which for example can be modelled in a Work Model, a Business Capability Model and/or a Strategy Model.

Properties and metadata: The Customer Journey Map can for example retain the following information:

  • A description of the diagram
  • Link to the owner of the diagram
  • Link to the one responsible for the accuracy of the diagram
  • Audits (auto generated information regarding its current state and access rights)
  • Associated documents, diagrams and other objects
  • Inherent Risk detailing risk considerations
  • Governance information detailing information about the published diagram and who has been involved in the approval of the diagram
  • Project status: information about budgeted and actual man-hours spent, percentage completed and the latest milestone, result and quality control of a change process.

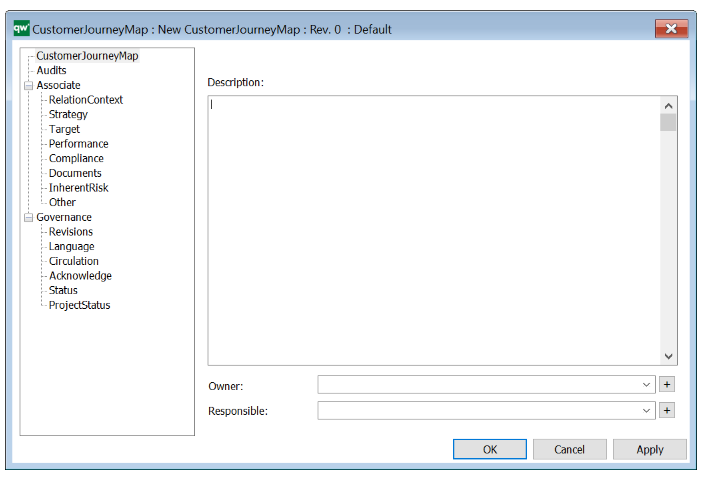
The above picture shows the properties dialogue window for the Customer Journey Map, where you can view and edit the diagram’s properties.

For more information: on Customer Journey Mapping, please view our webinar Experience Mapping – Customer Obsession for IT and Digital Professionals with Milan Guenther and Katharina Weber.


Conceptual Data Model

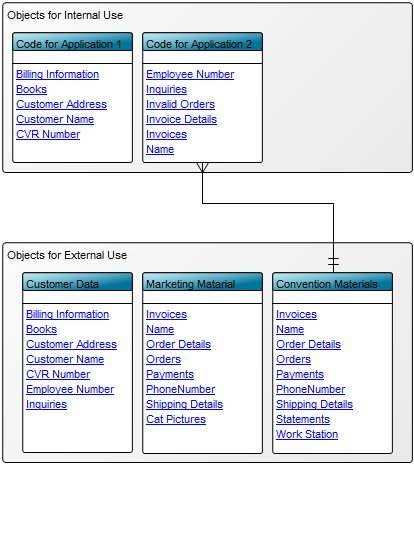
Purpose: The Conceptual Data Model template is used to describe a high-level business oriented structure of the information concept used in a specific business area. Below yo can se an example of a Conceptual Data Model where the data is divided into data for internal and external use:

ConceptualDataModel_2

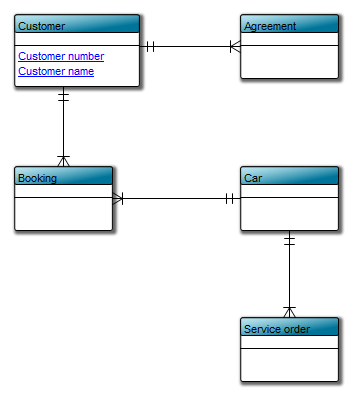
Core concerns: The conceptual data model template enables you to model a preliminary high level data model. It may be abstract in content and sparse in attributes. Its preliminary structure allows for many-to-many relationships. When using the Conceptual Data Model, you can model Information Concepts, Subject Areas, and their interrelationships. Below, you can see a car rental service’s Conceptual Data Model for a customer’s data.

ConceptualDataModel_1

Relation to other templates: The conceptual data model is a means of communicating information structures between participants in a project or documenting the overall Information Concept of a specific organization. For a more detailed model you should use a Data Model Diagram.

Properties and metadata: The Conceptual Data Model can for example retain the following metadata:

  • A description of the diagram
  • Link to the owner of the diagram
  • Link to the one responsible for the accuracy of the diagram
  • Audits (auto generated information regarding its current state and access rights)
  • Associated documents, diagrams and other objects
  • Inherent Risk detailing risk considerations
  • Governance information detailing information about the published diagram and who has been involved in the approval of the diagram
  • Project status: information about budgeted and actual man-hours spent, percentage completed and the latest milestone, result and quality control of a change process.

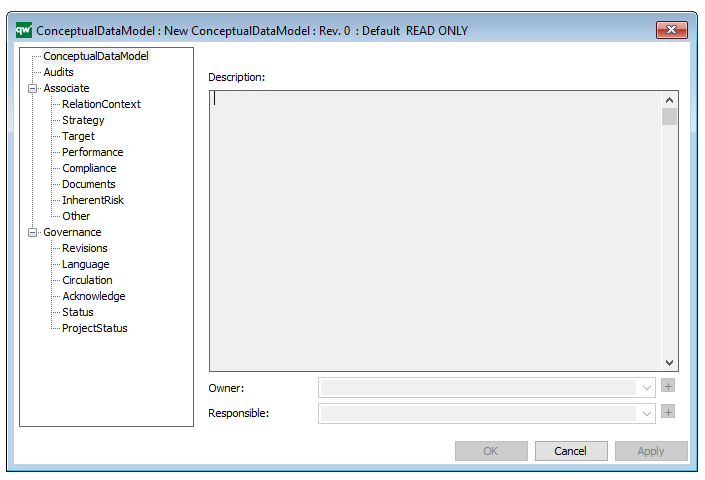
In the picture below you can see the Conceptual Data Model’s properties dialogue window, where the information can be viewed and edited:

Class Diagram

Purpose: The primary objective of the Class Diagram template is to visually represent and document the structural components of a system utilizing the Unified Modeling Language (UML). Displayed below is an example of a straightforward Class Diagram:

ClassDiagram_2

Core concerns: The Class Diagram effectively captures the various classes within a system, their attributes, operations, and the relationships between classes and other objects, such as packages. This comprehensive representation enables a clear understanding of the system’s structure, promoting efficient communication among stakeholders and facilitating system design and maintenance.

Example: In the Class Diagram below, the relationships between the classes “Customer” and “Internet User” and the packages “WEB-API”, “Reservation Control”, “GUI” (Graphical User Interface), and “Database” are illustrated. This example highlights the connections among different components and provides a visual overview of how they interact within the system:

ClassDiagram_1

Relation to other templates: The Class Diagram presents a detailed structural view of information. It can for example be a decomposition of an Information System which typically is presented in an Application Architecture Diagram. If a Class Diagram becomes too complex or large, a Package Diagram, where the classes are grouped into Packages, could be modelled instead.

Properties and metadata: The Class Diagram can for example retain the following information:

  • A description of the diagram
  • Link to the owner of the diagram
  • Link to the one responsible for the diagram
  • Audits (auto generated information regarding its current state and access rights)
  • Extensions regarding constraints and tagged values
  • Associated documents, diagrams and other objects
  • Inherent Risk detailing risk considerations
  • Governance information detailing information about the published diagram and who has been involved in the approval of the diagram

In the picture below you can see the Class Diagrams properties dialogue window, where the information can be viewed and edited: