Business Gauge

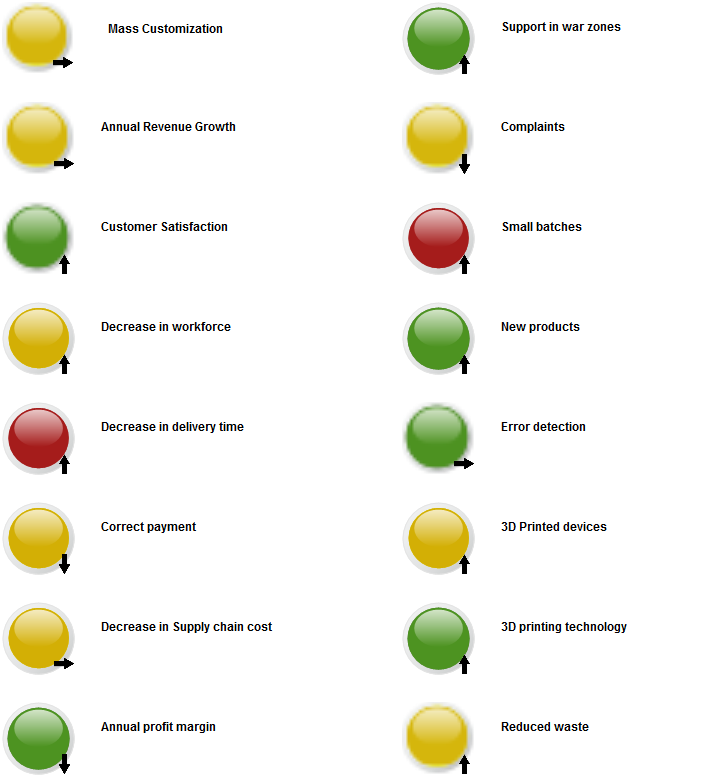
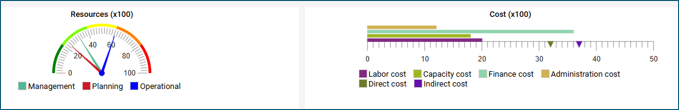
Gauges are a form of charts that can be used to in the web solution.

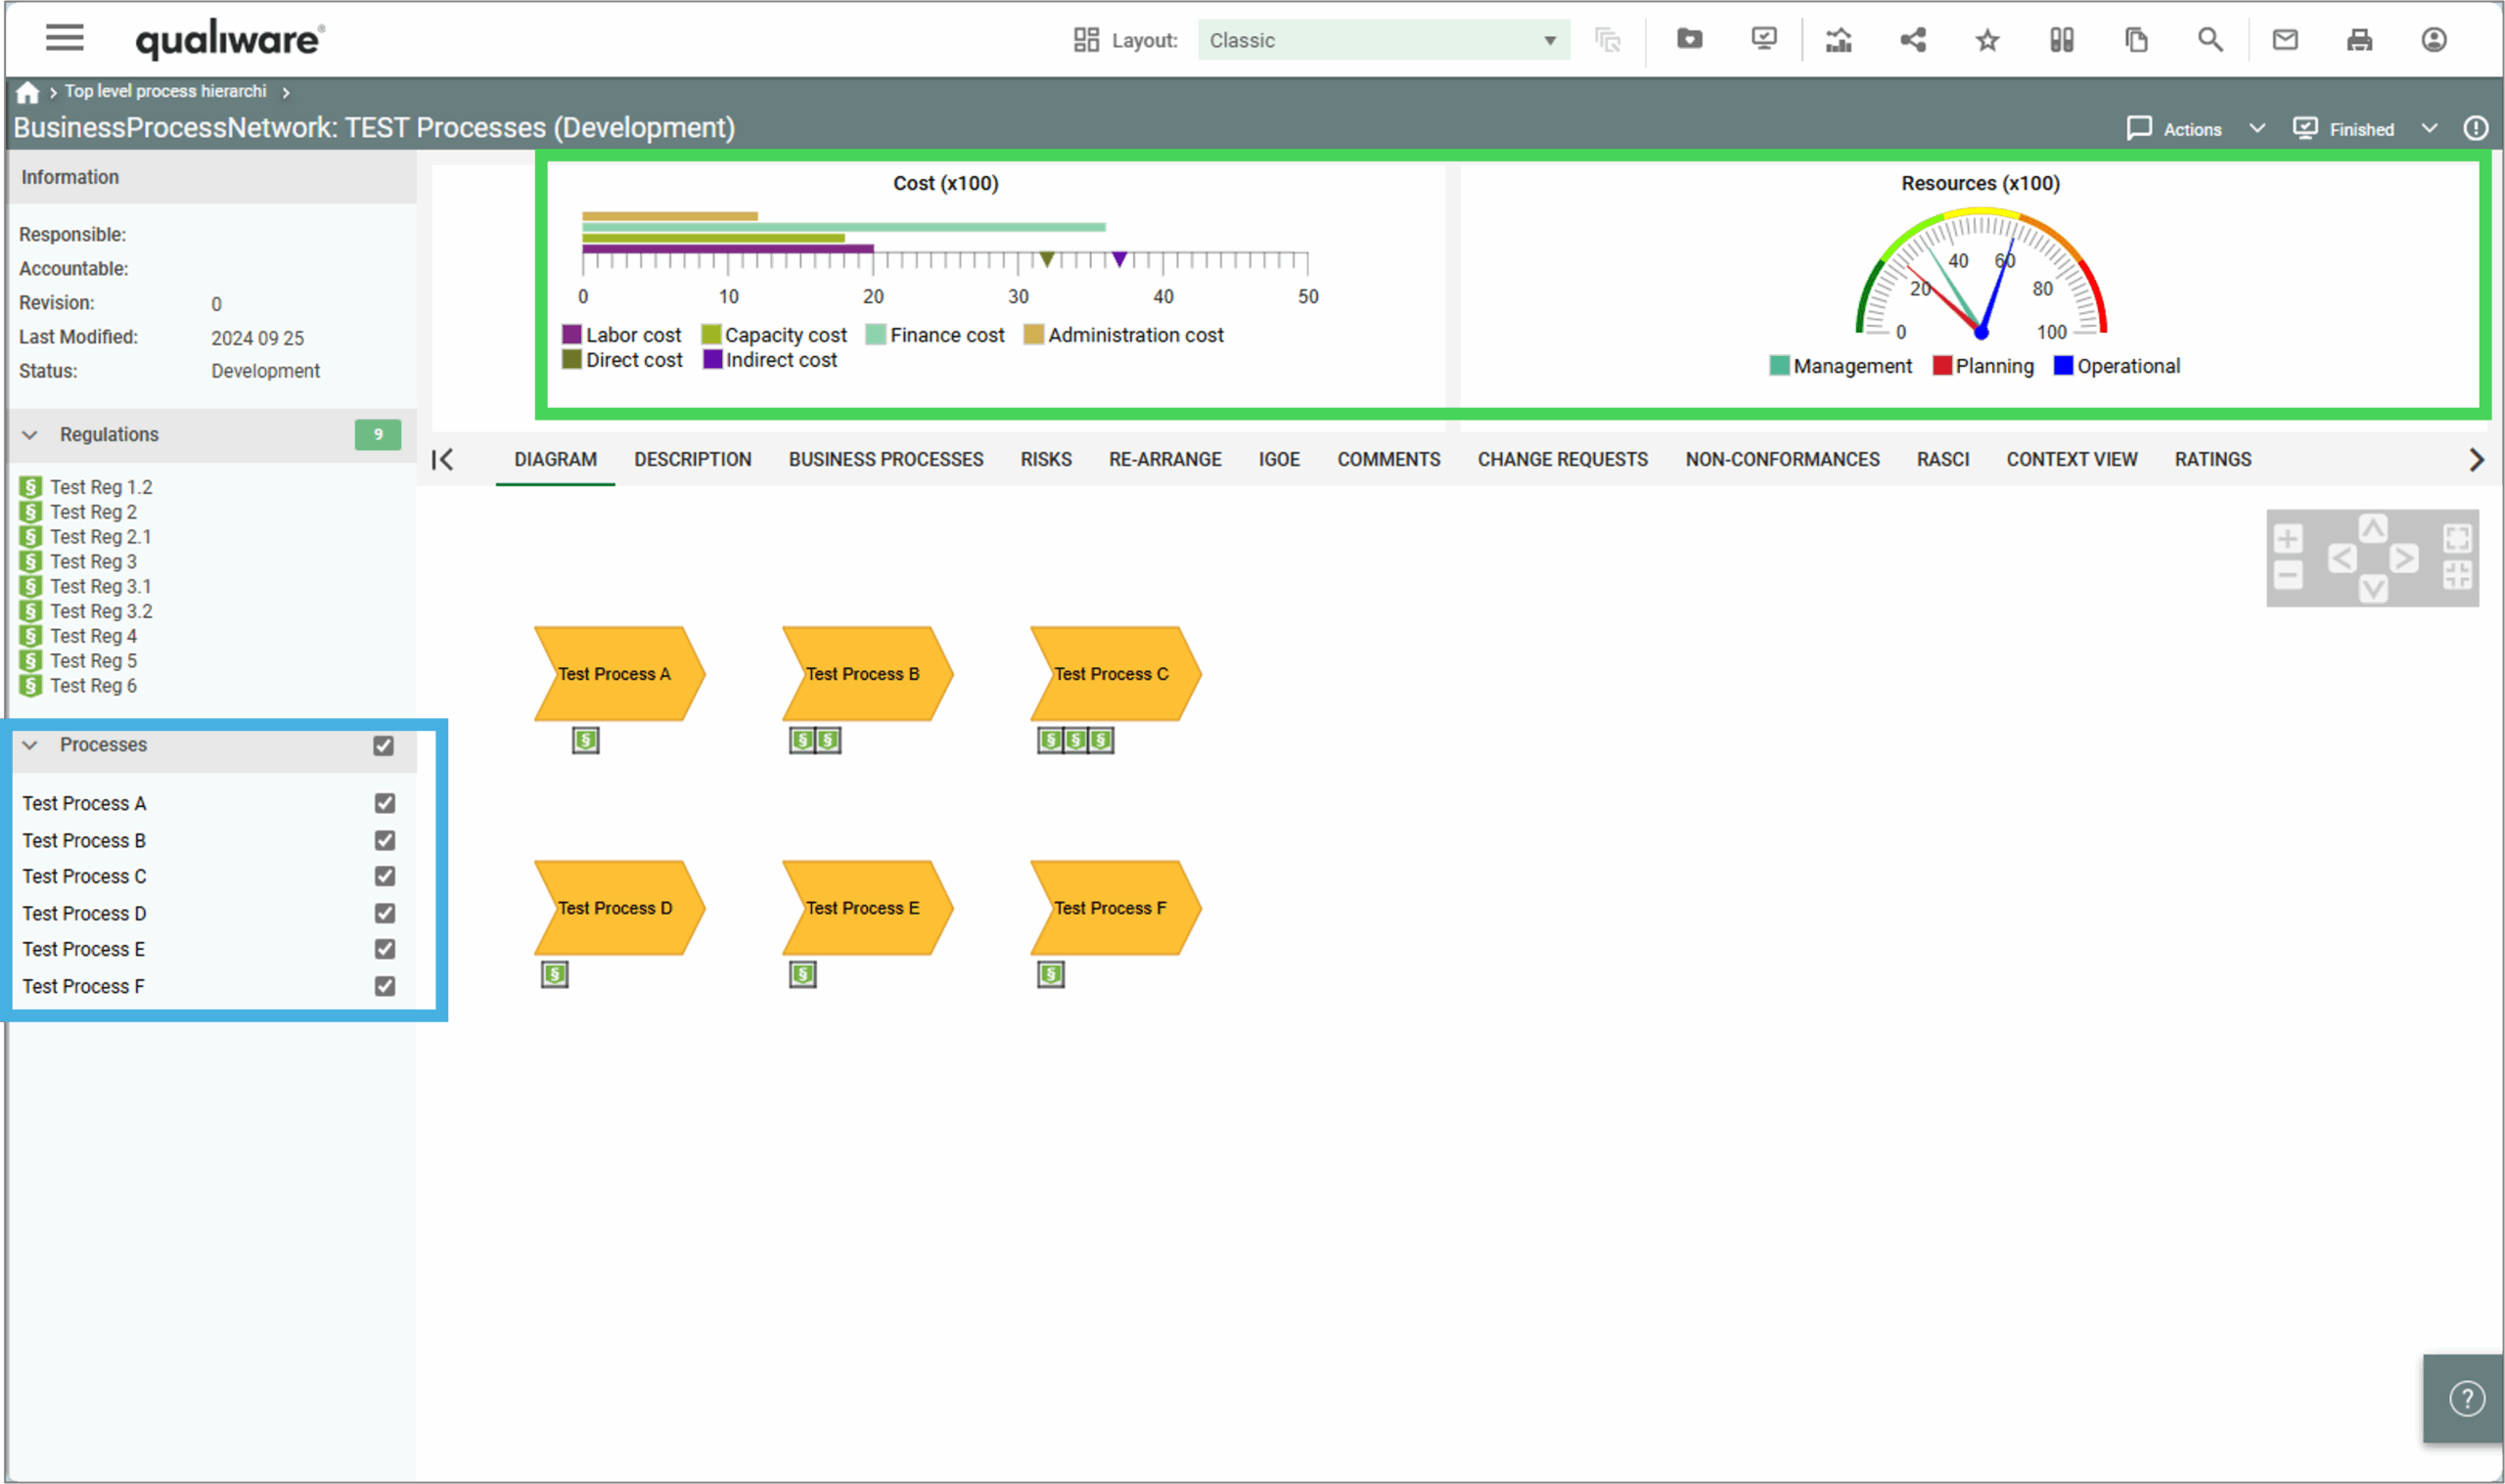
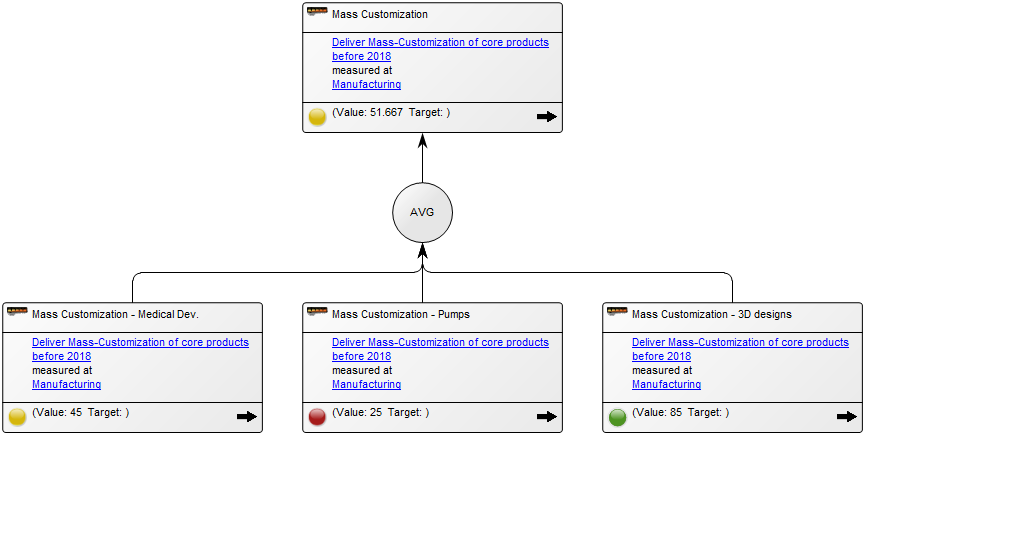
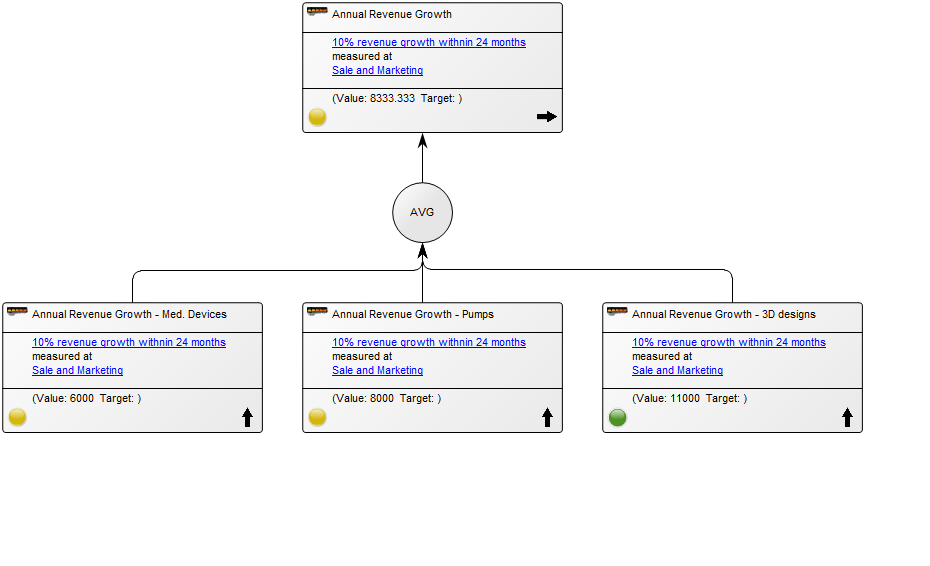
When used in relation to a contextbox with a checklist they aggregate based upon the checked selection.

Business Gauges can be used in the center top content of the HTMLTemplateDefinition.

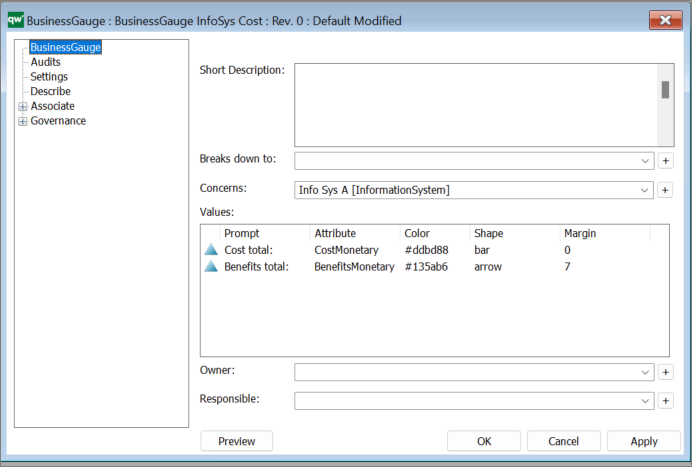
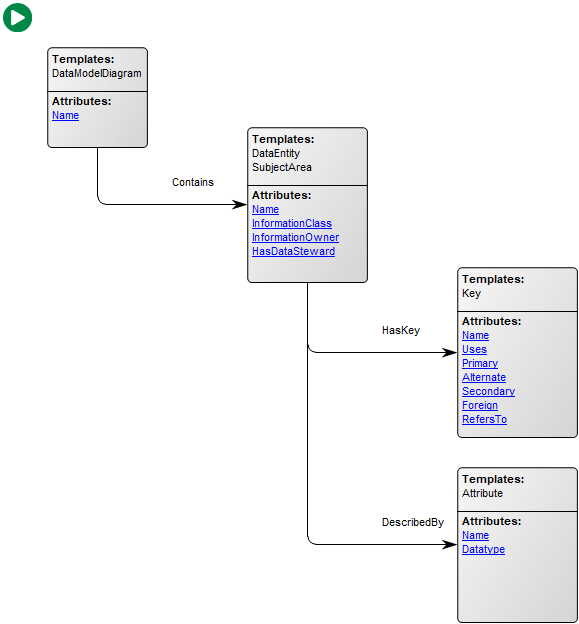
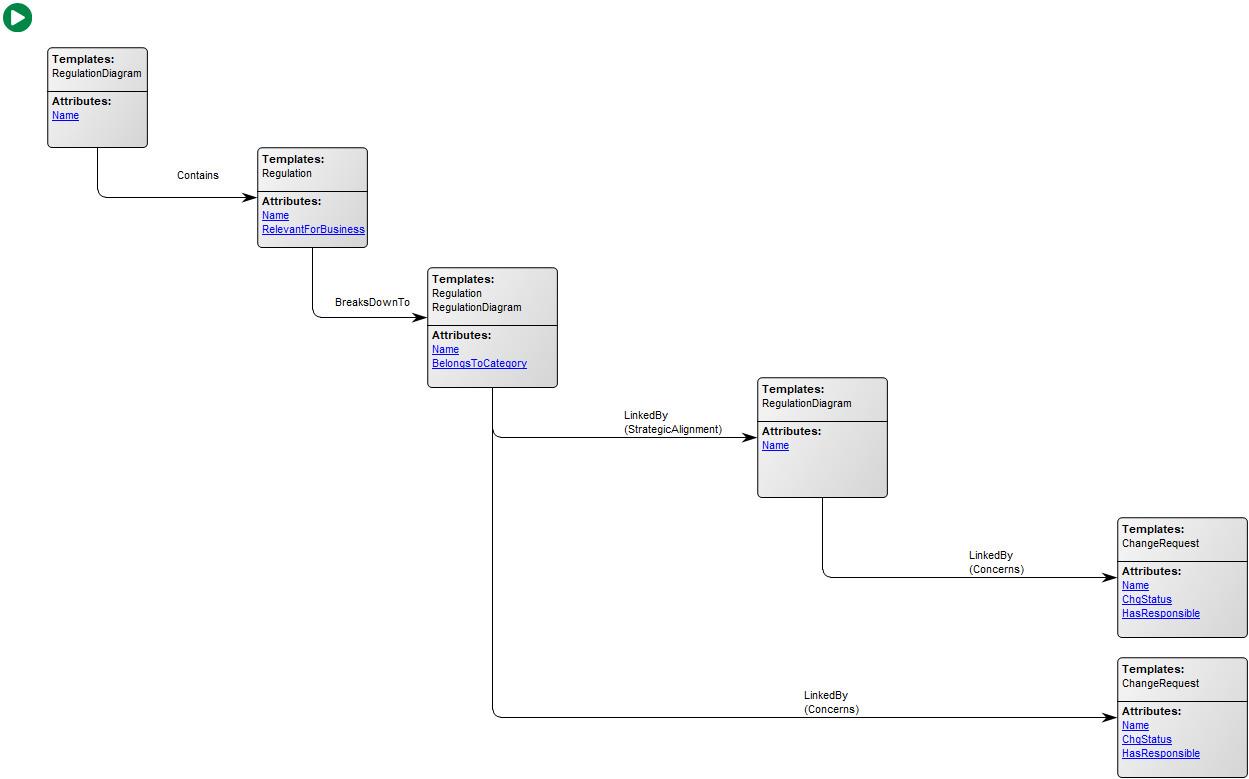
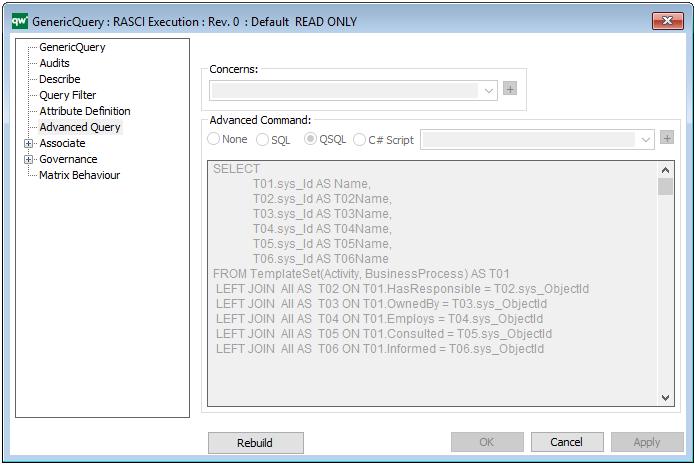
Concerns: Here you link to an object of the type which data you would like to display (in the example above an InformationSystem)

Value:

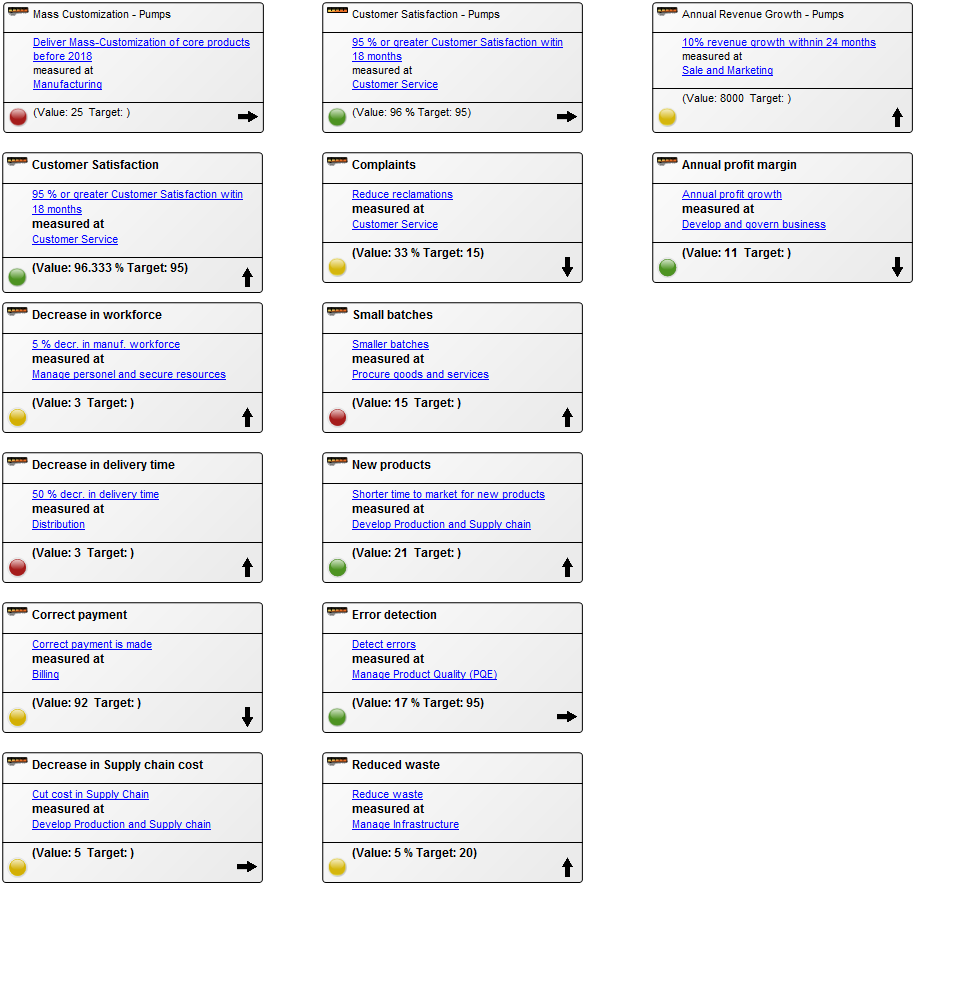
For the gauge chart to display anything, it needs some values. Values are provided by either using URL parameters or by setting up a checklist in a HTMLContentBox left or right panel. When using a checklist, the attributes, defined in Value, will be taken from the selected objects and used in the gauge chart.

  • Prompt: The prompt that explains to the user, what this value means.
  • Attribute: The attribute to take a value from.
  • Color: The color of the value. It will be used in the legend next to the prompt, and also in the chart. Colors should be defined in hexadecimal.
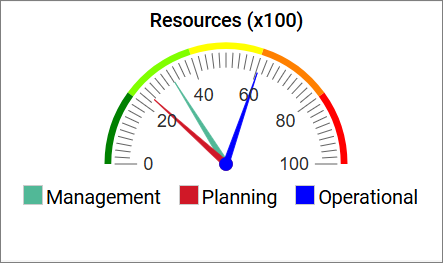
  • Shape: The shape of how the value is shown in the chart. Shape does not have any meaning for a radial gauge chart as all values will be shown as arrows.
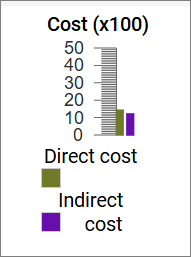
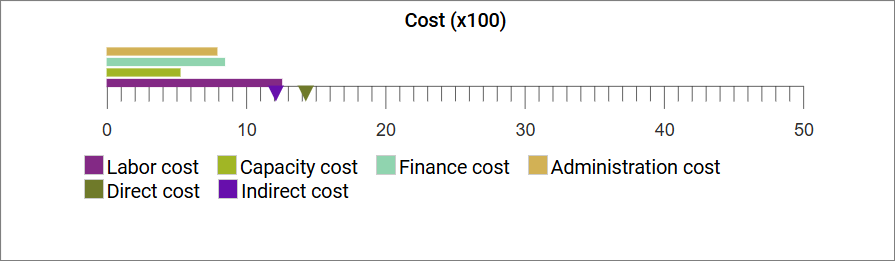
    For horizontal and vertical gauge charts, the following options apply:

    • bar – shows the value as a bar in the chart.
    • arrow – shows the value as a small arrow along the axis in the chart.
  • Margin: Margin does not have any meaning for a radial gauge chart and for arrow shapes in horizontal and vertical gauge charts.
    For bar shapes in horizontal and vertical gauge charts, margins can be used to place the bars next to each other.
    If no margin is used, then the bars will be placed on top of each other which will make it difficult for users to easily read the values.
    Tip: Use a margin divisible by 7 to space the bars evenly.

Settings:

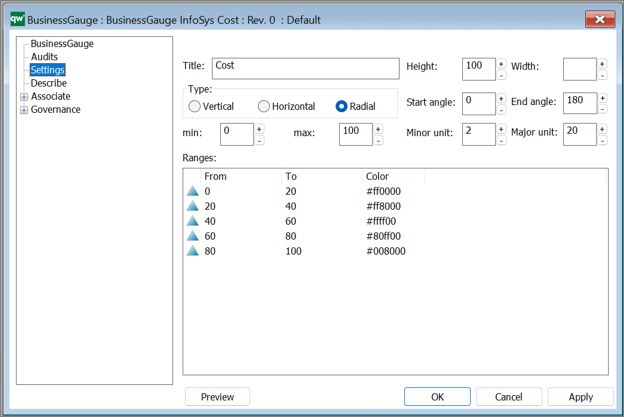
Title: The title will be shown in the top of the gauge chart on web.

Type:

  • Vertical:

  • Horizontal:

  • Radial:

Miscellaneous display settings:
These are a mix of settings that each has an impact on how the final chart is displayed.

  • Height: Height in pixels of the gauge chart without the legend.
  • Width: Width in pixels of the gauge chart without the legend.
  • Start angle: Only applicable to radial gauge chart.
    The starting angle of the chart.
  • End angle: Only applicable to radial gauge chart.
    The ending angle of the chart.
  • Minor unit: The minor unit of the chart shown with a small line.
  • Major unit: The major unit of the chart shown with a bigger line than minor unit.
  • min: The minimum value of the chart.
  • max: The maximum value of the chart.
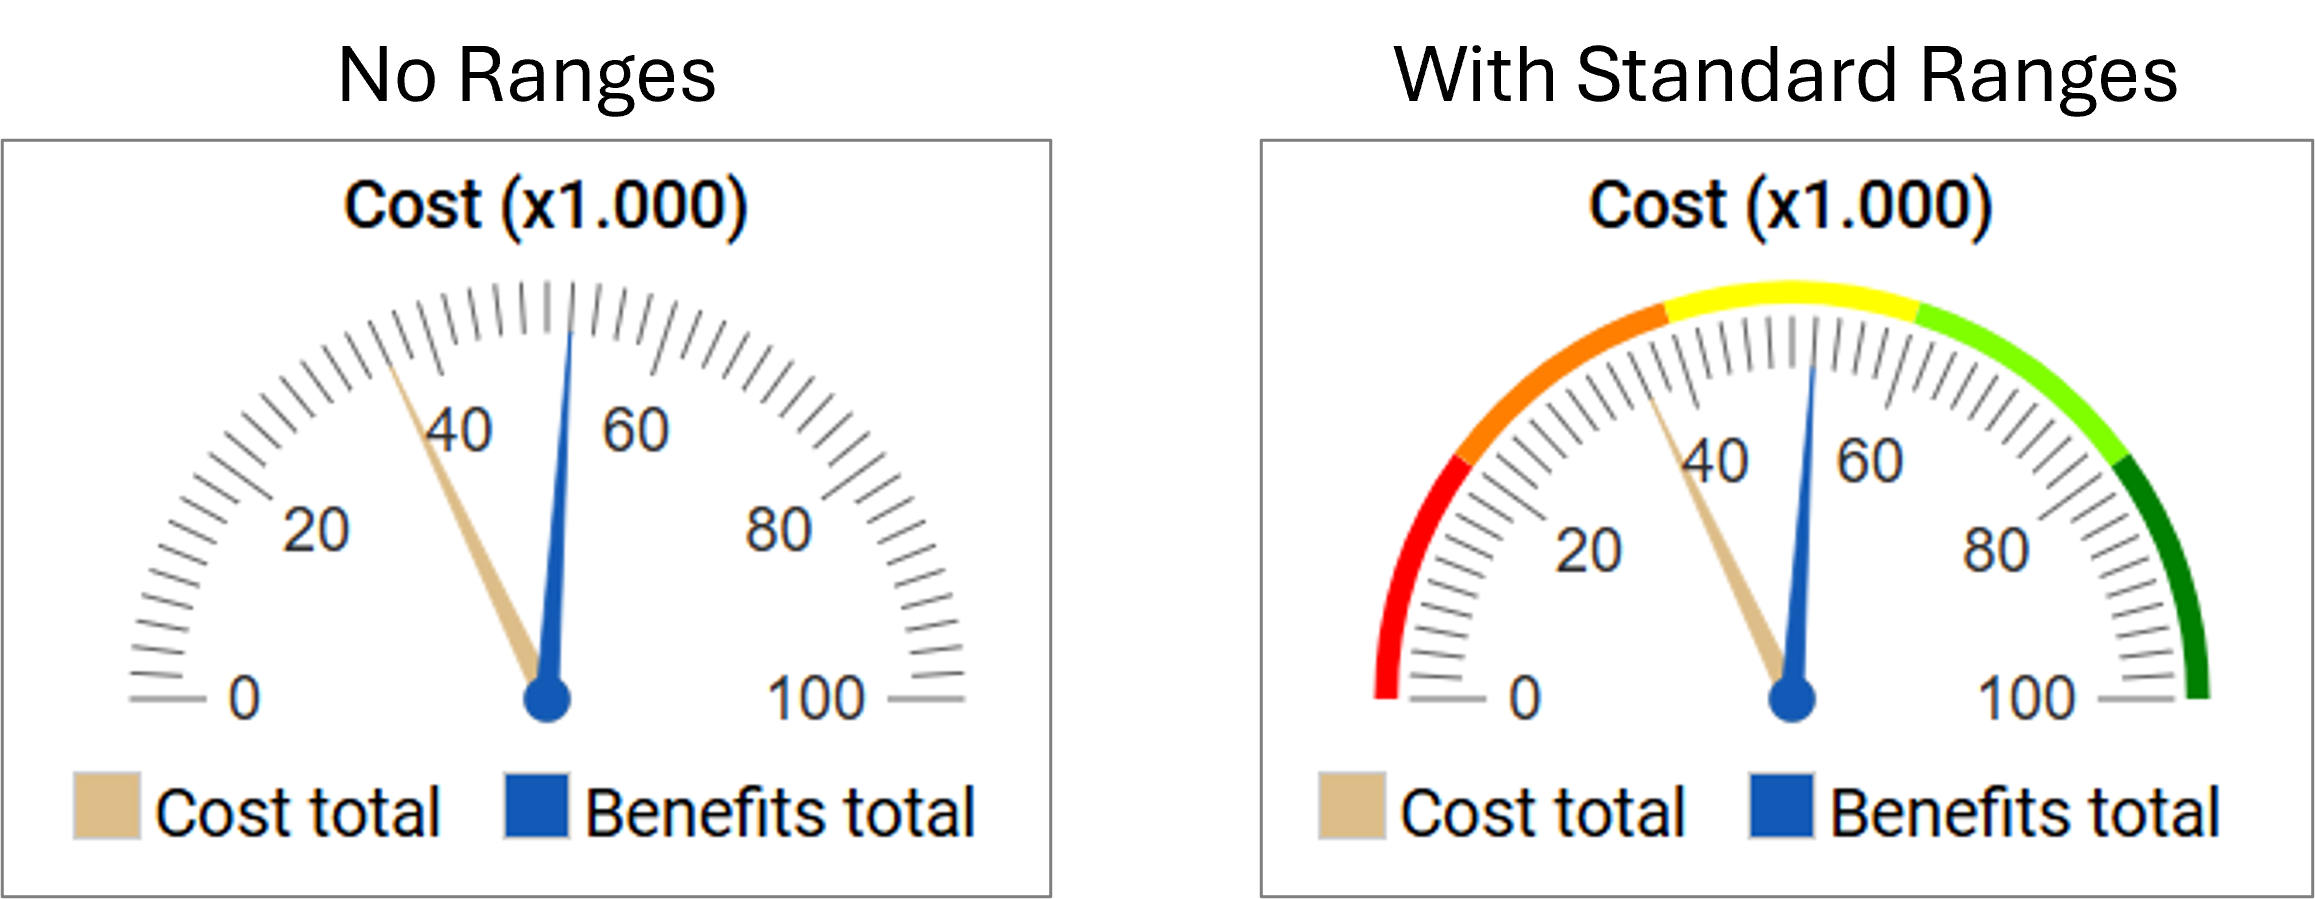
Ranges:

Ranges can be used to define if a range should be shown in a specific color. This can be used to enable a user to quickly see if any values are outside of normal values or in other ways concerning.

  • From: The value at which the color should start.
    It is accepted that the From value is the same as another range’s To value.
  • To: The value at which the color should end. It is accepted that the To value is the same as another range’s From value.
  • Color: The color of the range in hexadecimal.

Spreadsheet

The Spreadsheet template allows you to easily to review, edit and aggregate collections of data from across the repository from one window.

With the new dynamic spreadsheet, editing content from the web has never been easier.

Read more about the Spreadsheet functionality here.

Performance Diagram

Purpose: The purpose of the Performance Diagram is to provide a view over an organization’s performance in reaching their strategic goals.

Core concerns: The Performance Diagram enables you to model Key Performance Indicators – which can be related to strategic goals, derivative Performance Indicators and Derivation Rules. You can create a Performance Diagram as a decomposition of a Key Performance Indicator and model a hierarchy of performance diagrams. The model below shows an overview of an organizations Key Performance Indicators and their status:

In the following model the Key Performance Indicator has been enriched with derivative performance indicators explaining in more details the status of the performance and how it is measured:

The overview of the Key Performance Indicators can also be presented with a simplistic view, highlighting their status using color coded icons:

Relation to other templates: The Performance Diagram is a Strategic template and can be decomposed from Key Performance indicators contained in, for example, a Balanced Scorecard Diagram or Dashboard.


Properties and metadata: The Performance Diagram can for example retain the following information:

  • A description of the diagram
  • Link to the owner of the diagram
  • Link to the one responsible for the diagram
  • Audits (auto generated information regarding its current state and access rights)
  • Associated documents, diagrams and other objects
  • Inherent Risk detailing risk considerations
  • Governance information detailing information about the published diagram and who has been involved in the approval of the diagram

The above picture shows the properties dialogue window for the Performance Diagram where you can view and edit the diagram’s properties in QualiWare Lifecycle Manager.

Query Design

Purpose: The purpose of the Query Design template is to enable easy design of Generic Queries.

Core concerns: The Query Design template enables you to model Object Queries and Relation Queries into Generic Queries. When creating a Query Design, a Generic Query will be generated automatically and appear graphically on the diagram as a white triangle in a green circle – see the model below:

Relation to other templates: The Query Design template is used to generate Generic Query templates which can be used in creating Report Definitions, Spreadsheets and HTMLQueryResultViews.

Properties and Metadata: The Query Design Template can for example rentain the following information:

  • A description
  • Audits (auto generated information regarding its current state and access rights)
  • Query filter (with wizard for filter options)

The above pictures show the properties dialogue window for the Query Design Template where you can view and edit the diagram’s properties in QualiWare Lifecycle Manager

You can see an example of a Query Design in the QualiTube sections, where there is a video on Composity Query Design.

Read more about Query Design and GenericQuery here.

Generic Query

Purpose: The Purpose of the Generic Query template is to provide datasets for QualiWare System templates.

Core concerns: The Generic Query template is an auxiliary template. The Generic Query can be created using a Query Design template which enables you to easily structure the query for creating reports. When creating a Report for a diagram, the Generic Query created using the Query Design should be used as a Data Set in the Report Definition.

A Generic Query can also be generated using its Property Dialog, where you can link to Data Source and filter the data selection using a wizard – see example of the property dialog below:

The Generic Query can, for example, take the form of data sheets:

GenericQuery_2

The Generic Query template can also execute a command using the Advanced Query tab:

Relation to other templates: Generic Queries are automatically created when creating a Query Design. Generic Queries are used in the following templates: HTML Template Definitions, HTML Embedded content, HTML Publisher and HTML Content tab.

Properties and Metadata: The Generic Query can for example rentain the following information:

  • A description
  • Audits (auto generated information regarding its current state and access rights)
  • Query Filter, including a wizard for filter options
  • Attribute Definition
  • Advanced Query
  • Matrix Behavior

The above picture shows the properties dialogue window for the Generic Query where you can view and edit the diagram’s properties in QualiWare Lifecycle Manager.

Read more about Query Design and GenericQuery here.


Business Chart

For a quick introduction to BusinessCharts please see the video below as it explains how to create a BusinessChart based on Pie charts.
The video contains:

  • How to use the QML to create charts
  • How to customize the charts
  • An introduction to the versatility of using charts in QualiWare

Purpose: The purpose of the Business Chart template is to create different graphs and charts using information from other diagrams and templates. The Business charts can then either be published on a Dashboard and/or stored.

Core concerns: The Business Chart template is concerned with analyzing other templates and models. Therefore, it is not modelled like a typical template, but created using the Chart Wizard found in the template’s property window:

Below, you can see the Chart Wizard that helps you create your Business Chart:

The Business Chart template can for example be used to generate a chart over how the capabilities or Key Performance Indicators of an enterprise are performing over time or compared to desired values. Additionally, Business Charts can be used to analyze static data entered in a Matrix model. You choose the input to your Business Chart as a ‘Data Source’ in the templates metadata (see figure under Metadata).

Below, you can see two very different examples of business charts:

BusinessChart_2


BusinessChart_1

Relation to other templates: The Business Charts are published using the Dashboard template.

 Properties and metadata: The Business Chart template can for example retain the following information:

  • A description of the diagram
  • Link to the owner of the business chart
  • Link to the one responsible for the business chart
  • Link to data source
  • Audits (auto generated information regarding its current state and access rights)
  • Associated documents, diagrams and other objects
  • Inherent Risk detailing risk considerations
  • Governance information detailing information about the published diagram and who has been involved in the approval of the diagram

The above picture shows the properties dialogue window for the Business Chart Template where you can view and edit the diagram’s properties in QualiWare Lifecycle Manager.